Introduction
Mutual fund sales brochures and distributors often highlight past performance. Why? Because performance sells. The disclaimer that “past performance is not an indicator of future returns” is buried in small-print at the back of the book.
To see how bad a predictor past performance is of future returns, we came up with a novel idea. We used the Relative Strength Spread that we wrote about recently and applied it to mutual fund returns. This gave us three things:
- Normalized returns with respect to CNX 500 irrespective of the fund’s benchmark.
- A visualization of the performance gap between the best and the worst funds. And,
- A parade of top-10 and bottom-10 funds across different periods of time.
Relative Performance
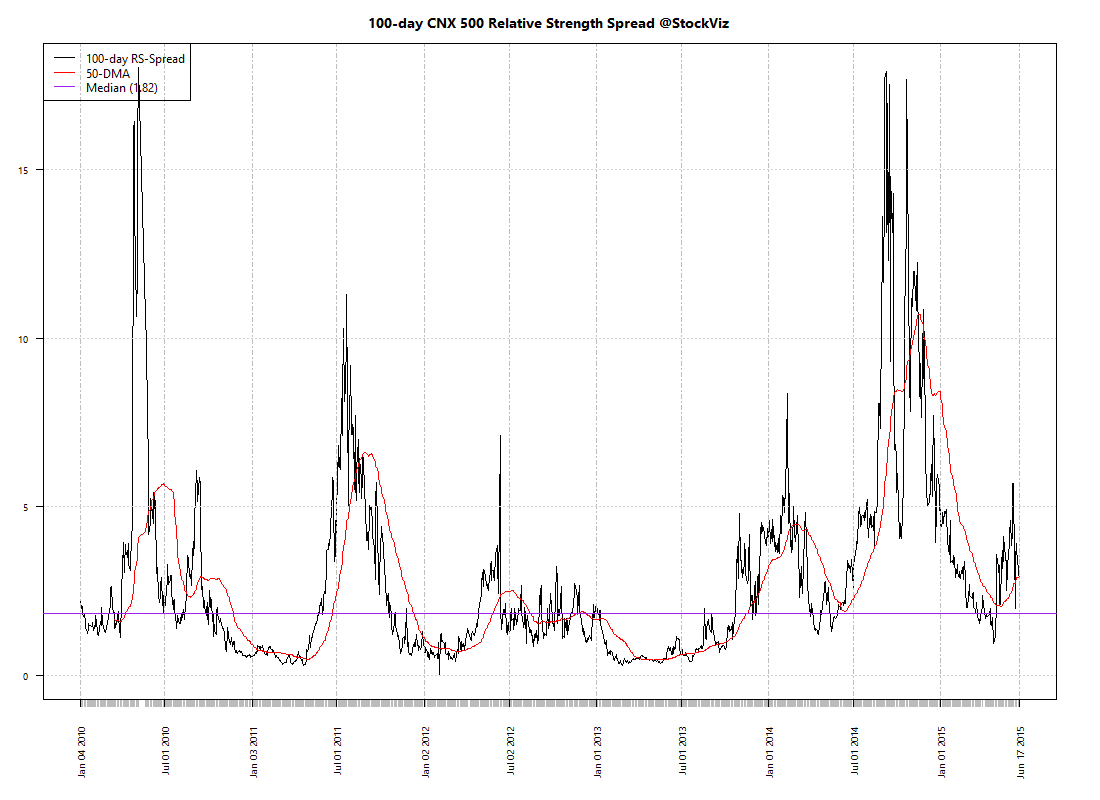
Here’s how the spread between the top and bottom-decile looks like with a 100-day lookback:
And with a 365-day lookback:
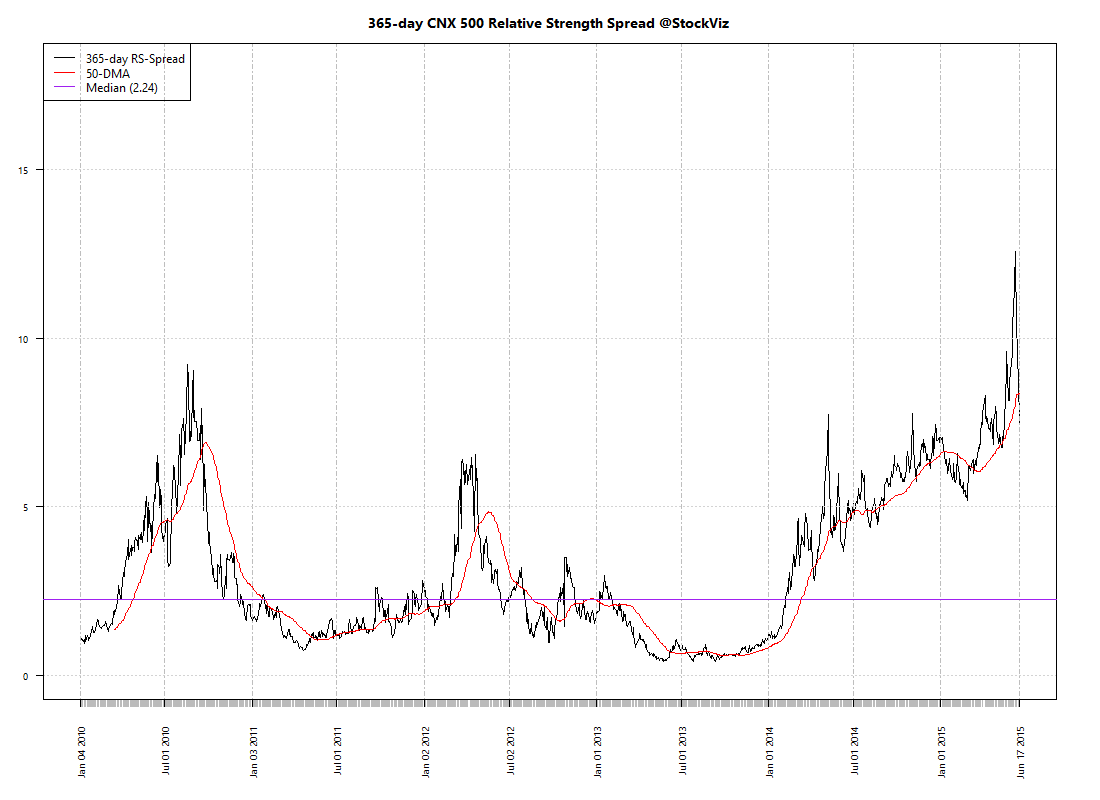
When the broad markets go up, the performance gap between the best and the worst funds widen. Some managers wring more out the markets than the others. However, during the bear phase, the relative performance between different funds compress. If the market is bad, they all look beige.
Longevity of returns
Is the out-performance sustainable? If you picked the best performing fund this year, will it retain its position the next? Click to embiggen:
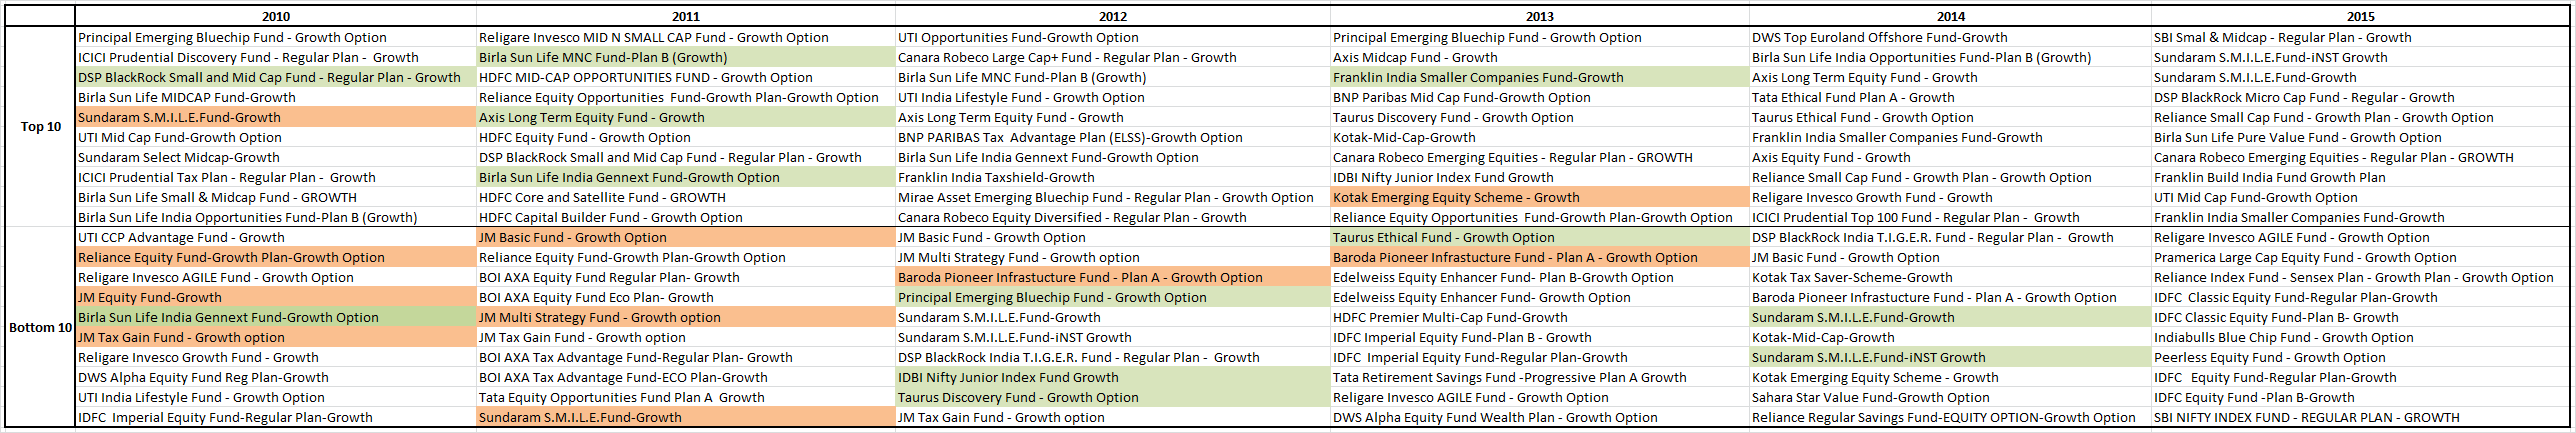
None of the top performers in 2010 retained their spot in 2011; same as in 2013 vs. 2014. There were a few cases where funds in the top-decile slipped to the bottom decile the next year. It is a total crap-shoot.
Conclusion
There is absolutely no connection between past performance and future returns. If fund managers require a broad-based rally in the markets to out-perform, then they are in effect, chasing momentum.