The dilemma
Ownership of a diversified, un-correlated set of assets remains the touchstone of a well crafted portfolio. We had discussed how adding bonds to your equity portfolio reduces volatility before. However, comparing correlations between funds within the same asset class is a challenge.
For example, say you already have the Reliance Equity Opportunities Fund in your portfolio and your agent is pitching the Sundaram Select Midcap fund, how do you figure out whether to add to your existing holding of the Reliance fund, add an extra line item or switch to Sundaram?
Comparative returns
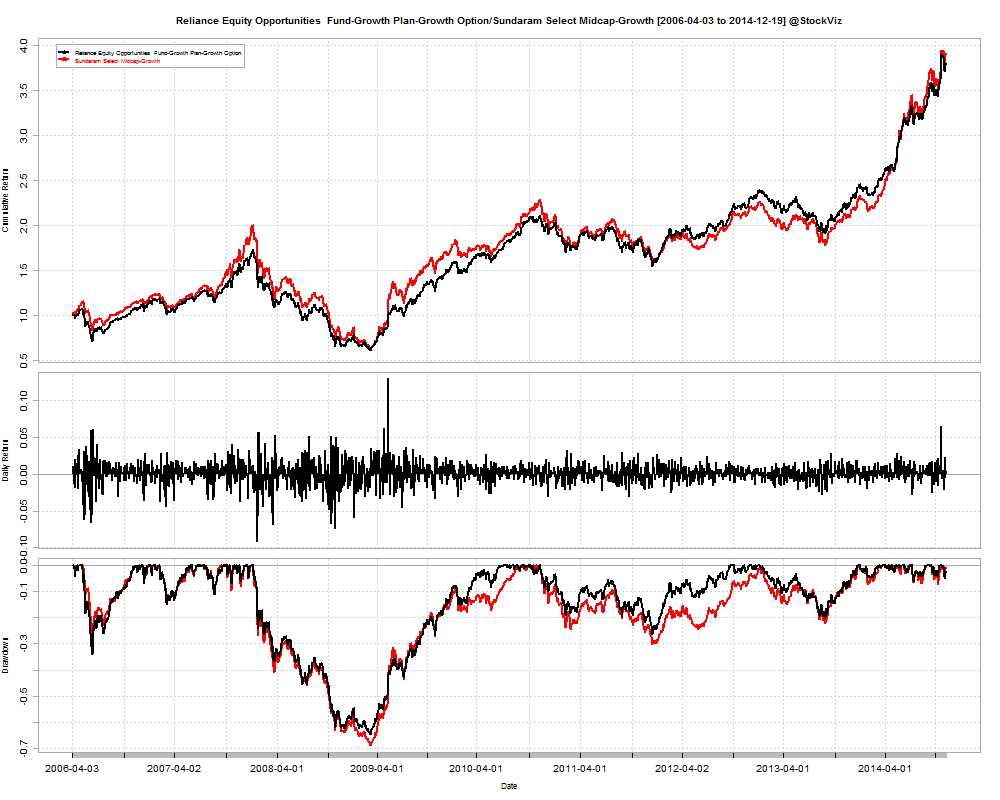
Between 2006-04-03 and 2014-12-19, Reliance’s Fund returned a cumulative 280.08% with an IRR of 16.55% vs. Sundaram’s cumulative return of 290.44% and an IRR of 16.91%.
As you can see, the wealth charts are almost on top of each other. The correlation chart confirms it:
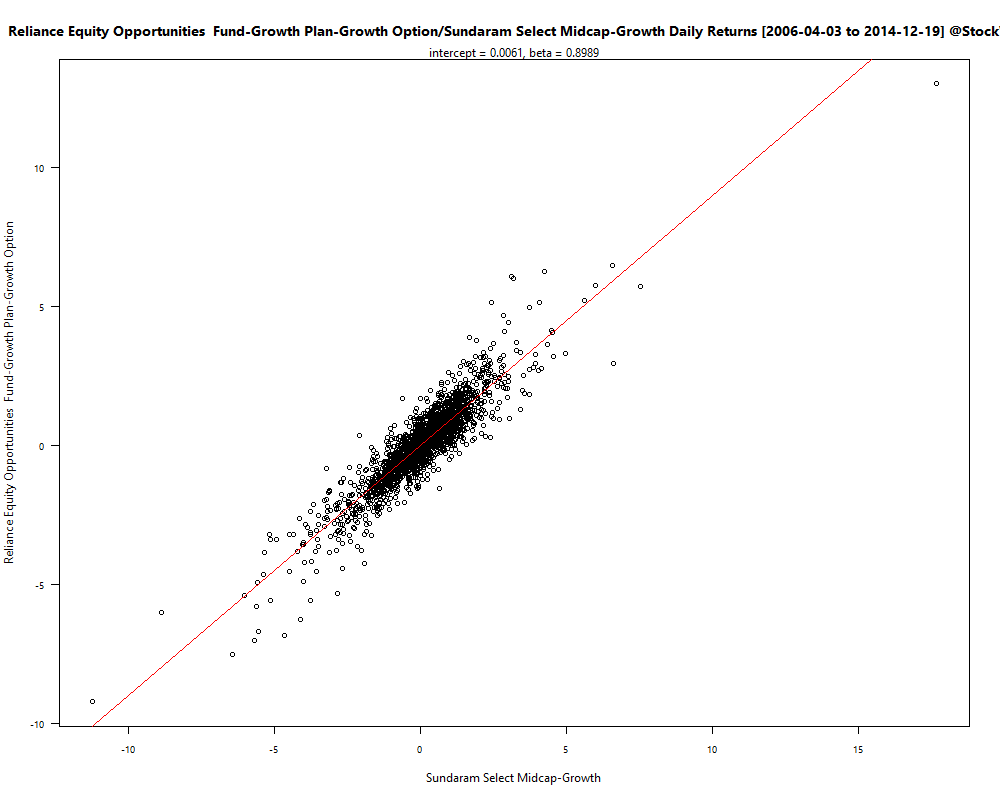
Except for a few outliers, they are almost the same fund packaged differently.
Histogram of returns
The FundCompare tool also gives you the histogram of fund returns and the associated skewness. In this case, the Reliance Fund has a skew of -0.15 vs. Sundaram’s +0.22. Given that the average returns are more-or-less the same, this means that Sundaram’s Fund is better. Besides, it also appears that Sundaram’s Fund has a better Sharpe ratio.
Given that Reliance’s Fund has an expense ratio of 2.29% vs. Sundaram’s 2.26%, I would say “switch.”
Compare Your Funds
Before pulling the trigger based on what your fund broker/adviser tells you, get a free quantitative analysis of your options on our FundCompare tool.