Momentum is known to trend. Our previous post explored trend overlays on momentum indices. The question now is, does it make sense to do the same to our own homegrown momentum models?
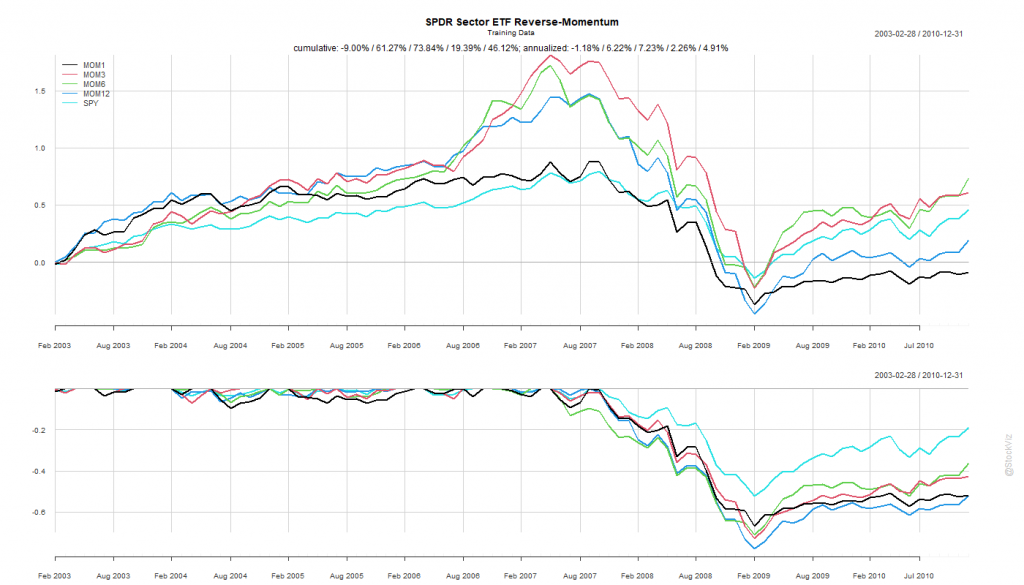
Our Momentum, Velocity and Acceleration models created between 2013 and 2015 have a monthly rebalance schedule. As a risk management measure, trailing stop-losses were introduced to them in 2016 and their momo versions – Momo (Relative) v1.1, Momo (Velocity) v1.0 and Momo (Acceleration) v1.0 – were born.
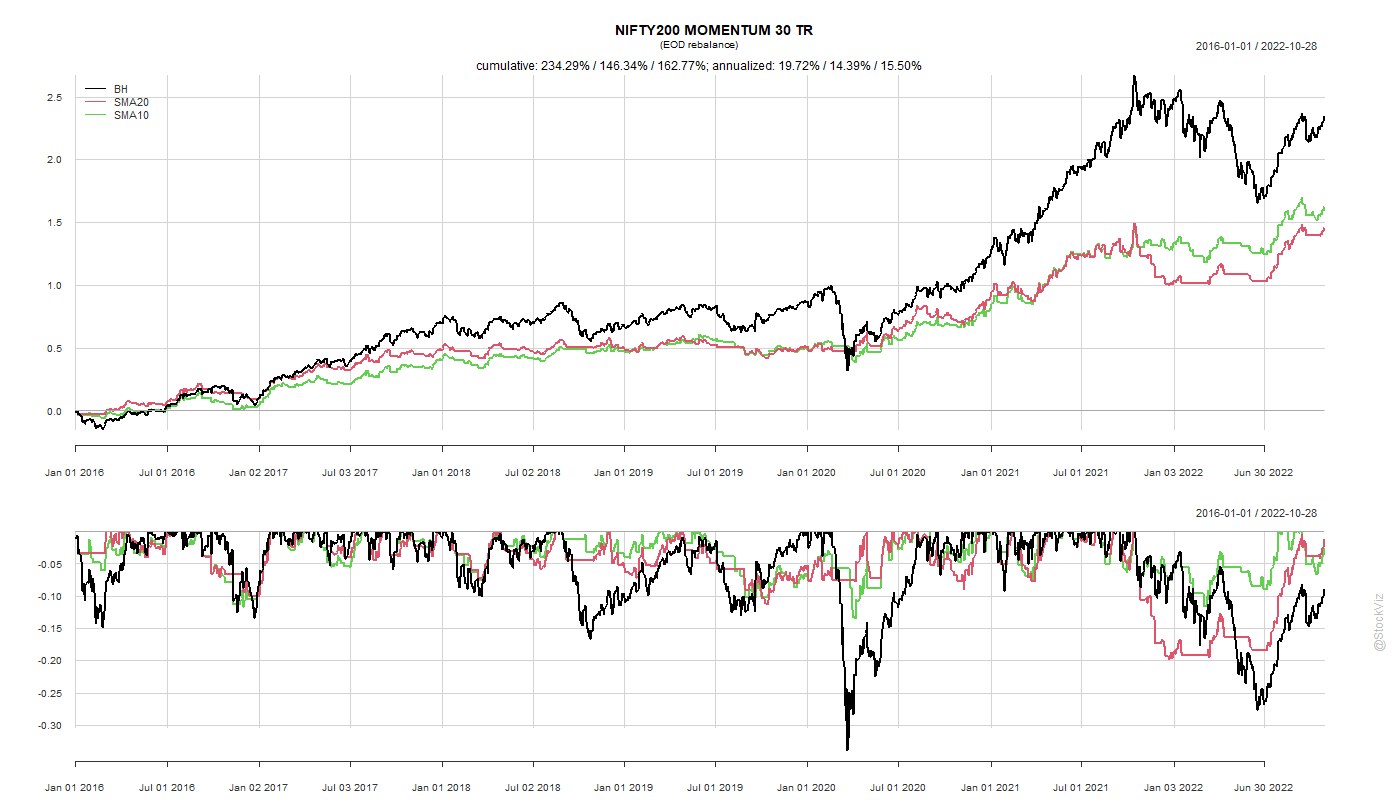
While these momo strategies do well with sudden market crashes, the problem has always been markets that grind down. Does a trend overlay on the original strategies perform better than momos after transaction costs?
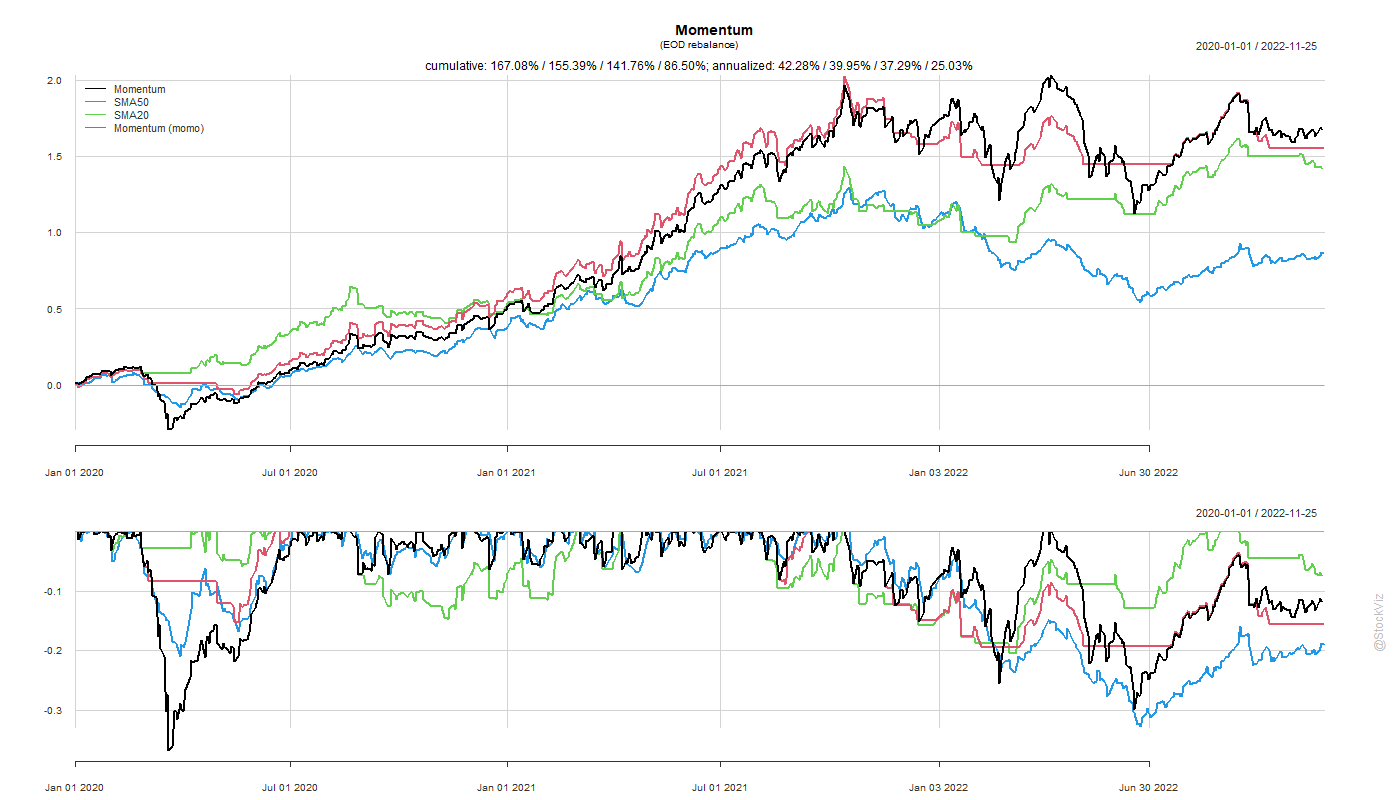
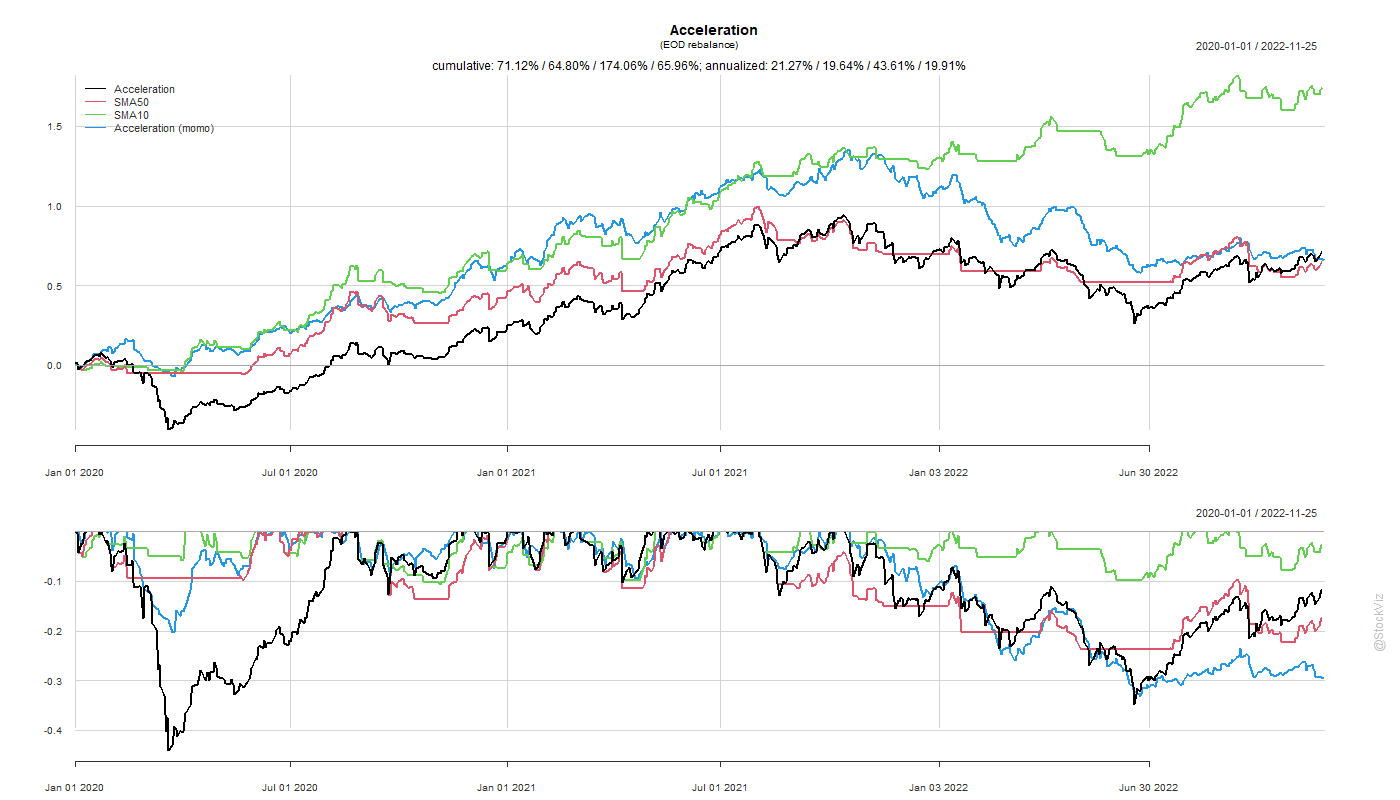
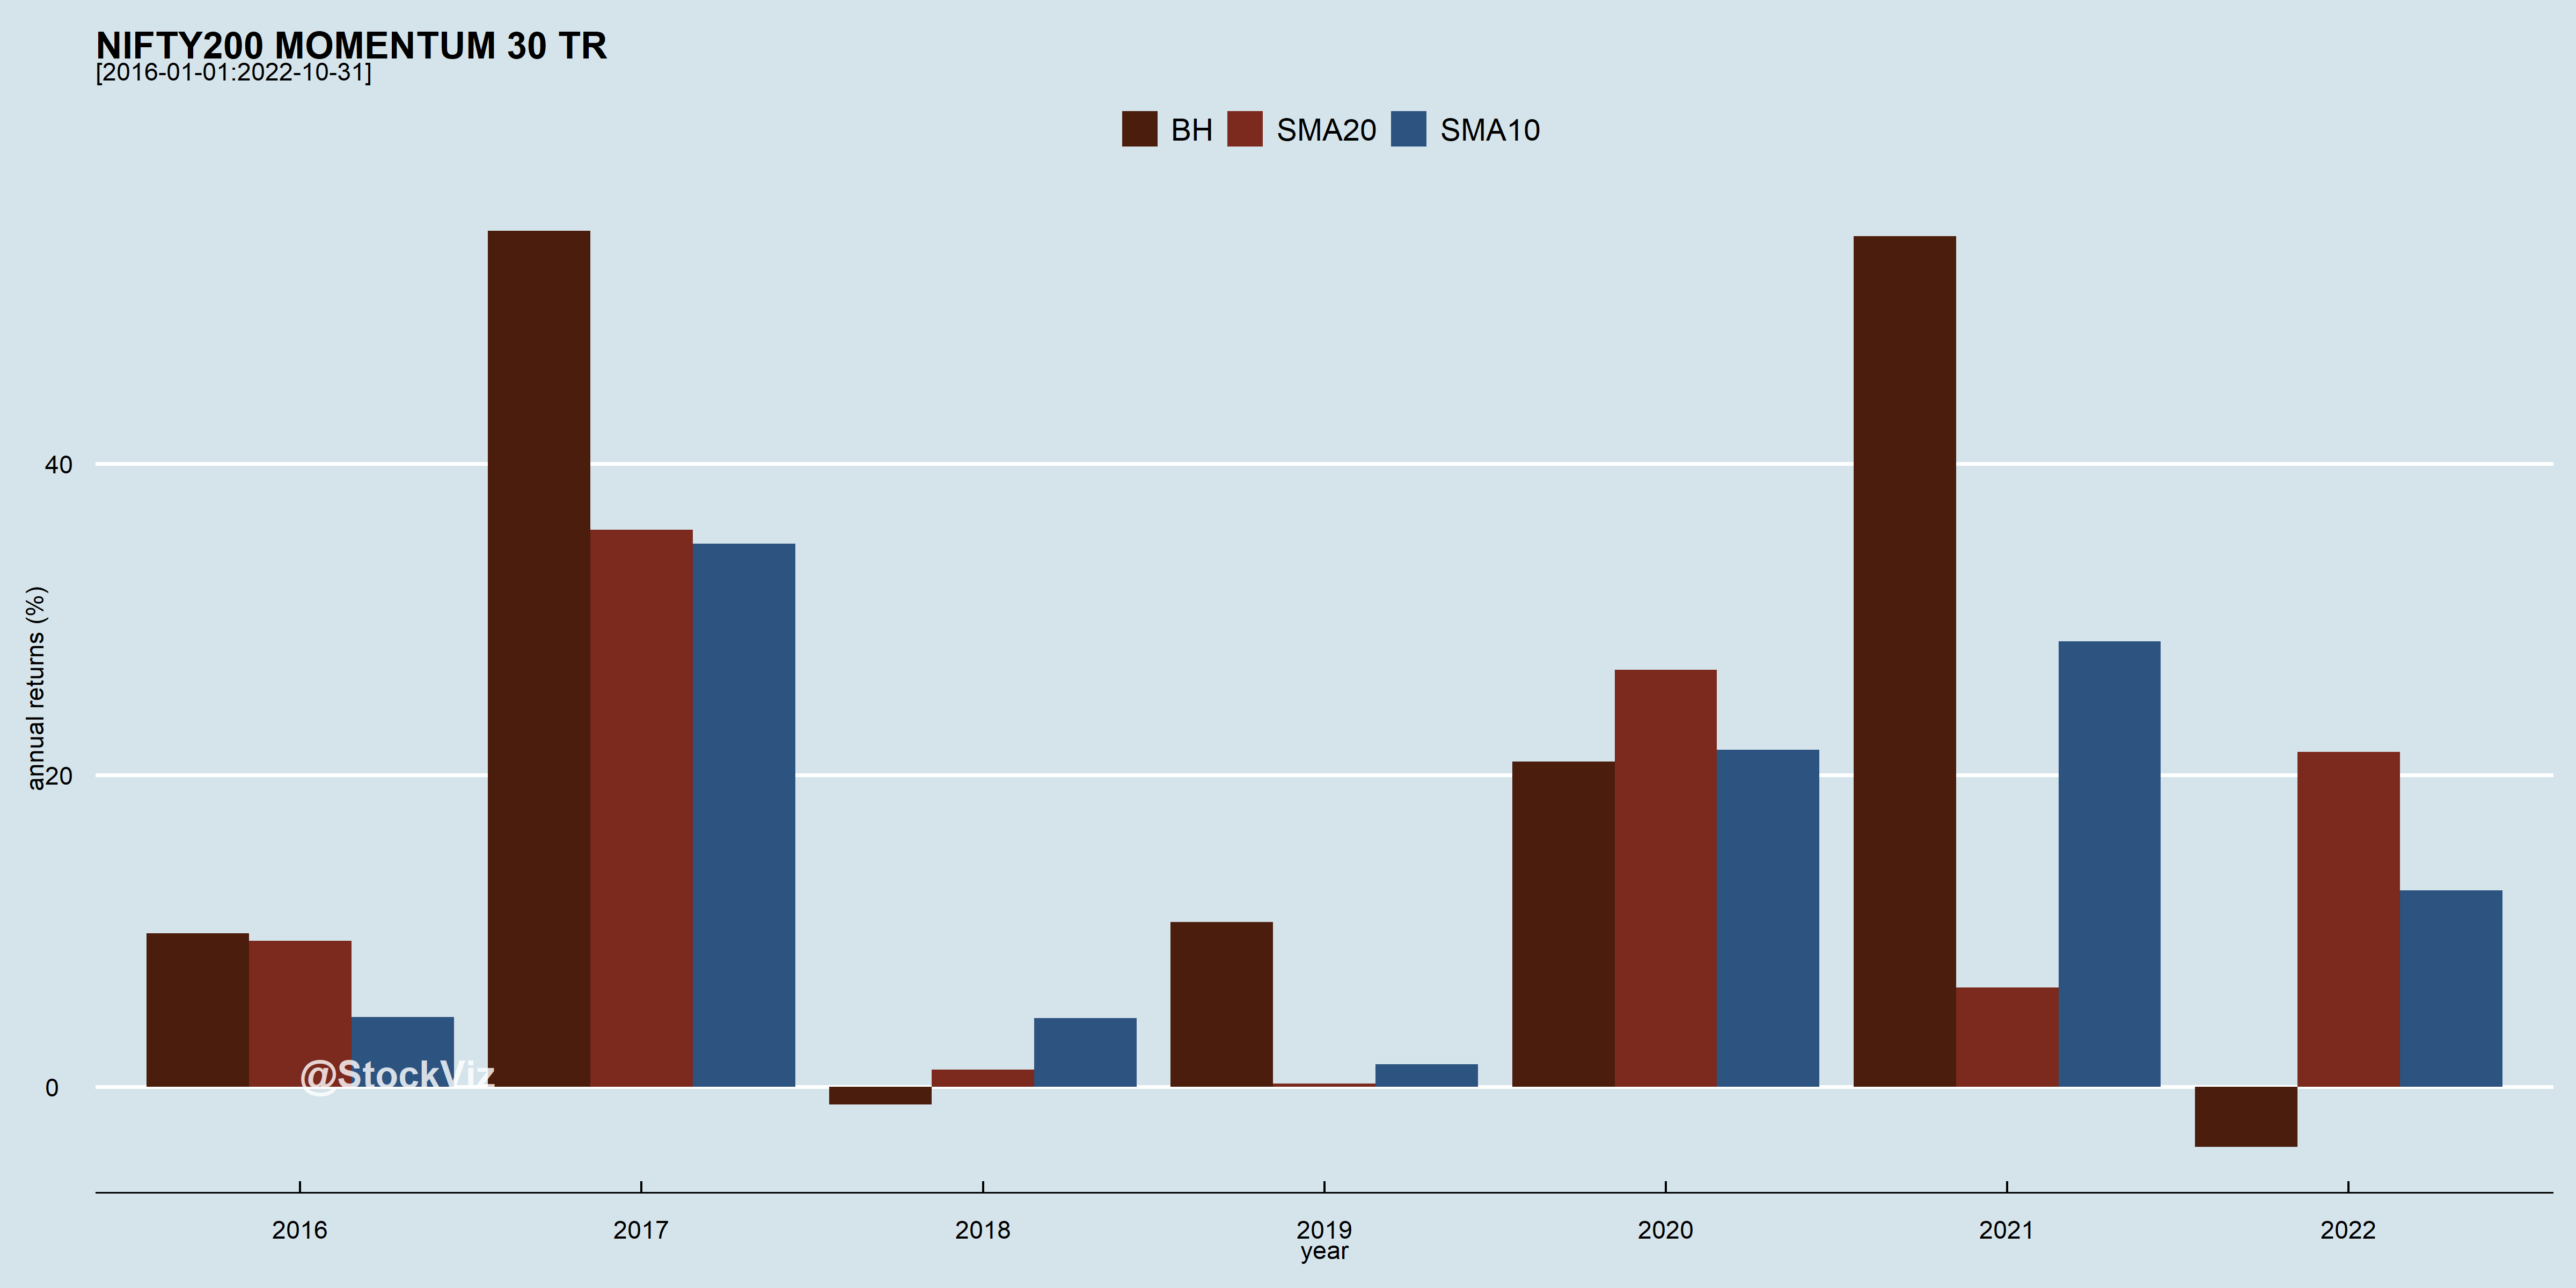
The trend-overlay strategies seem to avoid drawdowns and perform better than their momo counterparts. The post-2020 Corona Crash market rally was one for the record books. So, a strategy that sidesteps the crash may not necessarily perform better during the rally but the full dataset will show superior performance. What if we took the crash data out of the picture?
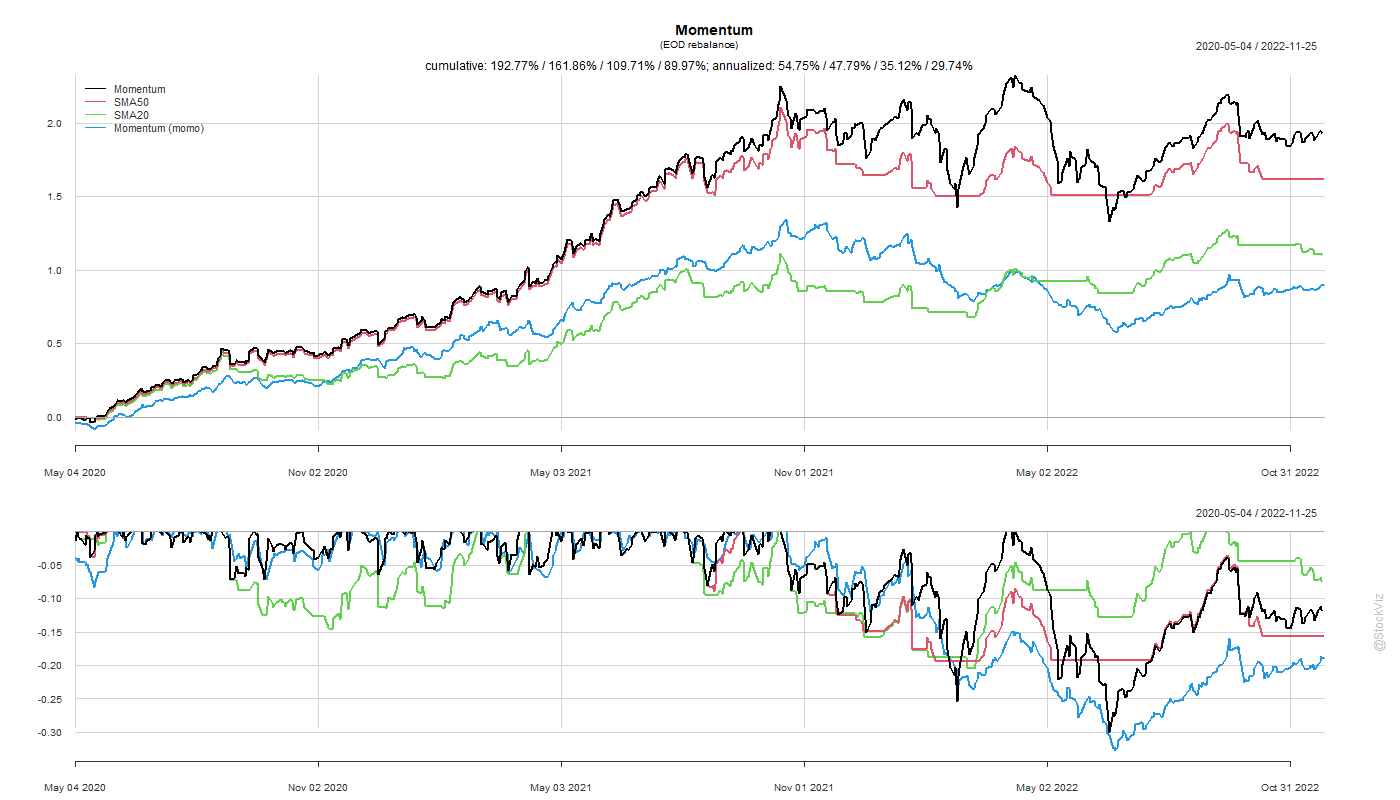
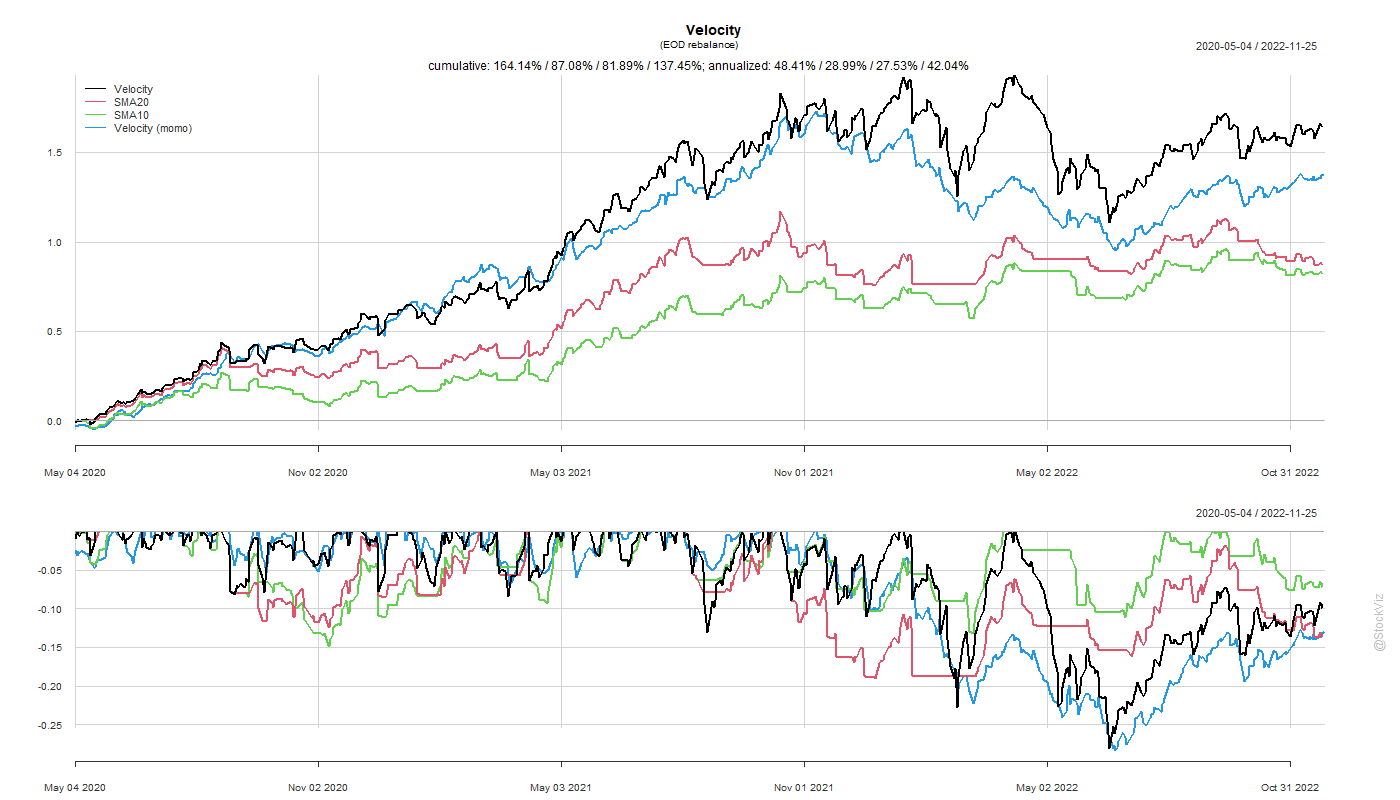
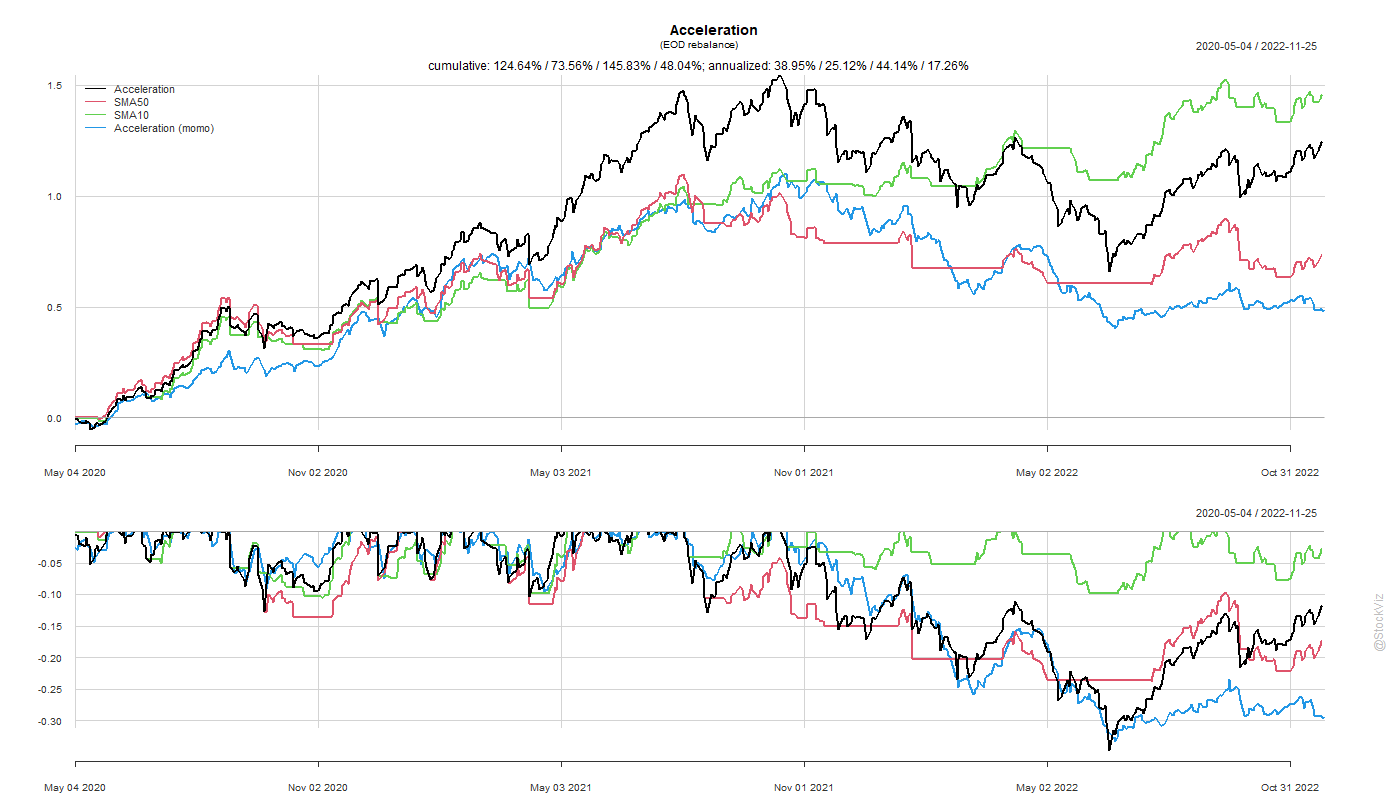
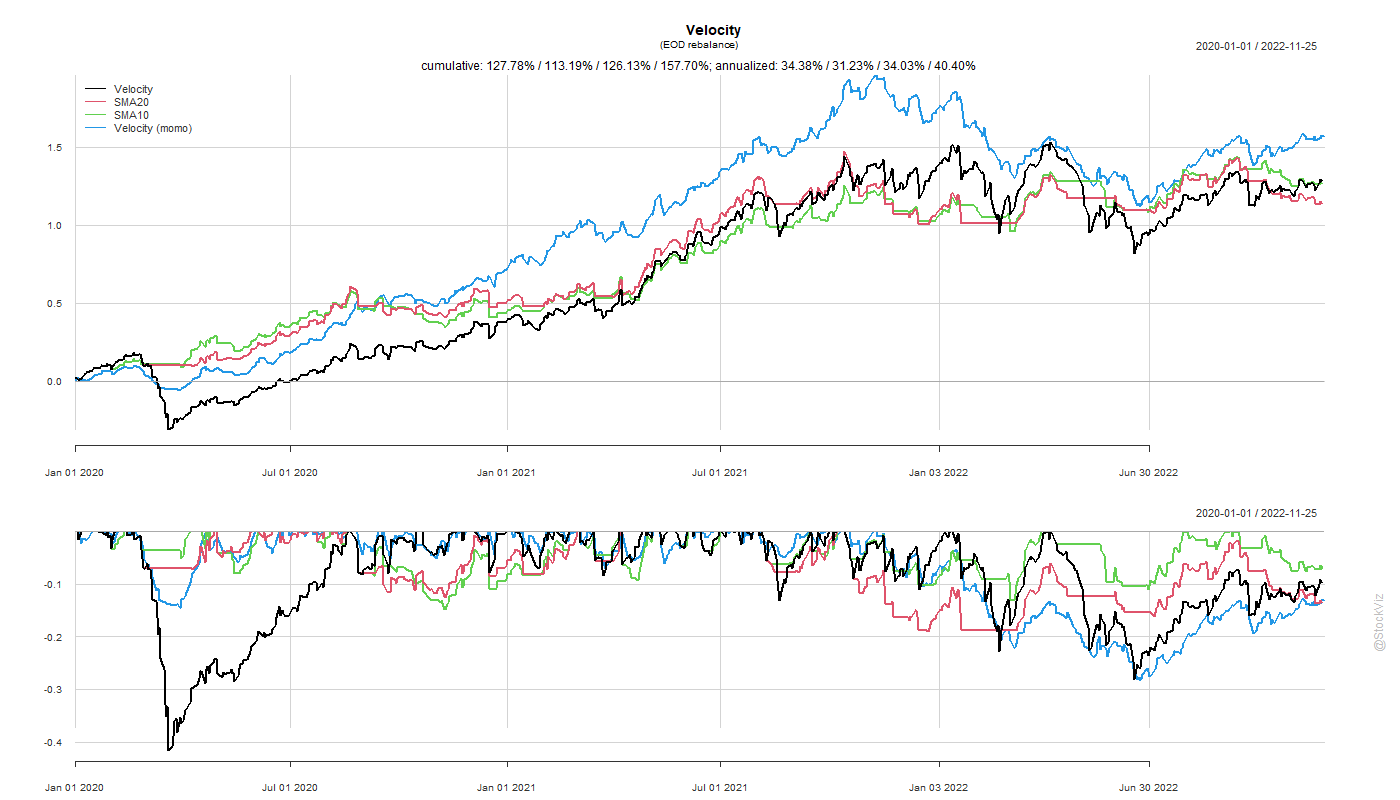
It looks like Momentum and Acceleration strategies saw big pickups in performance. A trend overlay on Velocity resulted in lower drawdowns but that came with a big performance penalty.
You can track these strategies here: Tactical Momentum, Tactical Velocity and Tactical Acceleration.
Code and charts: github