Previously, we looked at momentum rebalance frequencies with a monthly increment. However, if you observe the individual returns of momentum stocks (Returns under Momentum), you’ll notice that the returns of momentum stocks tail off after the first two weeks. Does switching to a weekly rebalance frequency make sense?
The biggest problem with a higher frequency of rebalance is the higher transaction cost that comes with it. So, we set the drag to be 0.5% and run 1- through 4-week rebalancing scenarios.
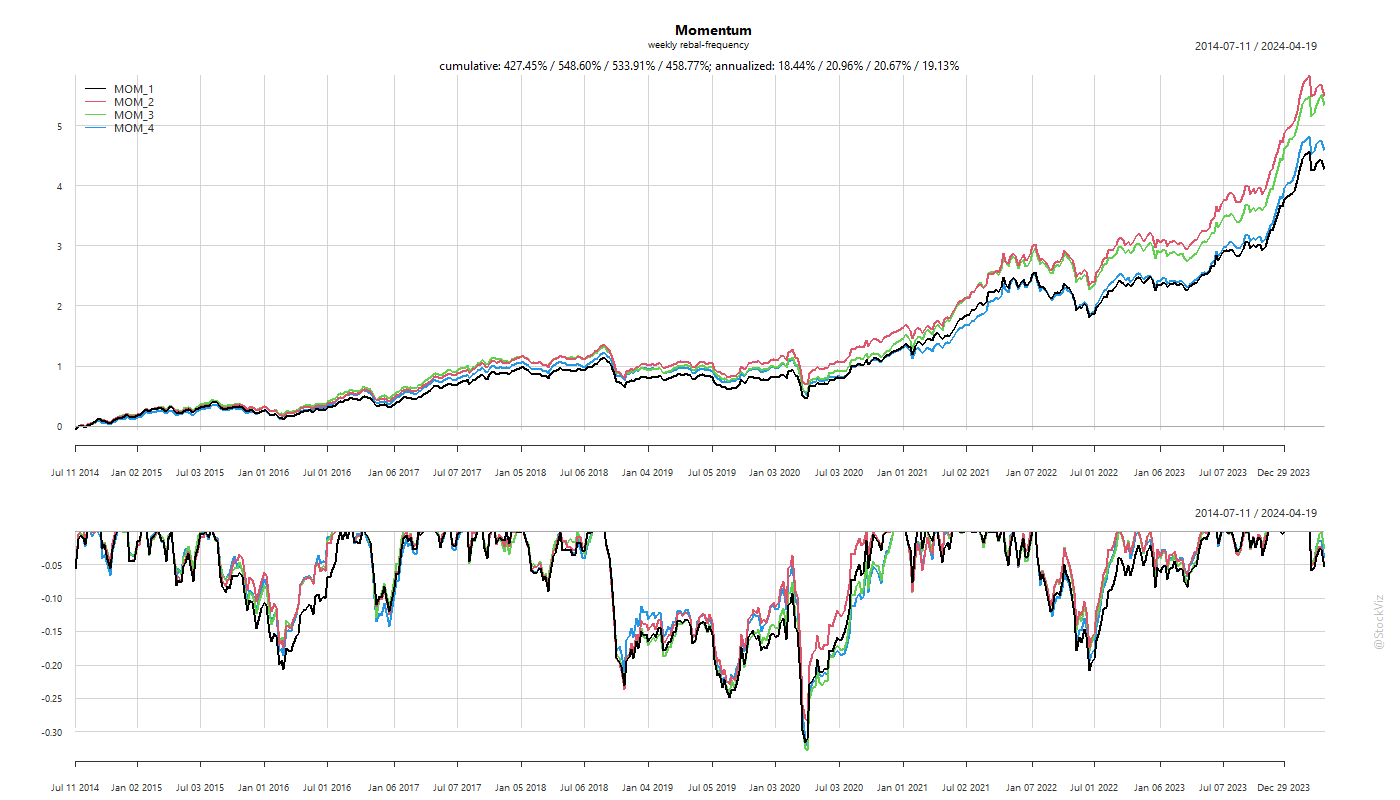
Turns out, there is an advantage to rebalancing a momentum portfolio once in two weeks rather than once a month.

The transaction costs are roughly 5% (annualized) vs. 3% of the monthly rebalanced version.
The main thing to watch out for is the portfolio overlap between rebalancing. The lower the overlap, higher the costs.

Costs are permanent and immediate while returns are hypothetical and distant. Make of this what you will.
Code and charts on github.
Related: Factors