Only buy stocks that go up…
The Fama French 5-Factors came in two installments. The first 3 were published in 1992 and the rest in 2014. They capture “fundamental” factors, i.e., factors that can be derived from looking at balance-sheet and income statements. In 1993, Jegadeesh and Titman published their ground-breaking work on momentum: Returns to Buying Winners and Selling Losers: Implications for Stock Market Efficiency (pdf)
Their paper singularly propelled momentum (or, trend-following) into the mainstream by giving it the academic vigor it lacked earlier. While its findings may not have been earth-shattering for most traders, most professional investors looked at momentum strategies as something that “traders” did and avoided them. But within a decade of the paper being published, momentum strategies were firmly established as a “legitimate” strategy that could be allocated to.
Basic Design
The J/T paper constructs a long-short portfolio by ranking stocks based on their prior 12 month returns (skipping the most recent month.) The top decile portfolio is called the “losers” decile and the bottom decile is called the “winners” decile. In each month, the strategy buys the winner portfolio and sells the loser portfolio. This is the classic 12_1 momentum, where 12 denotes the formation period and the 1 is the number of skip months.
The reason for the skip month is to account for the short-term reversal effect associated with momentum. Some researchers, like Fama and French, do 12_2 momentum, where the most recent 2 months are skipped. However, a more recent study by Medhat and Schmeling (2018) finds that once we discard the stocks with the lowest turnover, equity returns exhibit short-term momentum rather than short-term reversal. So, the short-term reversal effect may not be as prevalent as is usually thought and one could even go with a 12_0 momentum.
The French Momentum Library
Luckily for us, Ken French (of the Fama French fame) regularly updates factor statistics on his Tuck School of Business webpage.
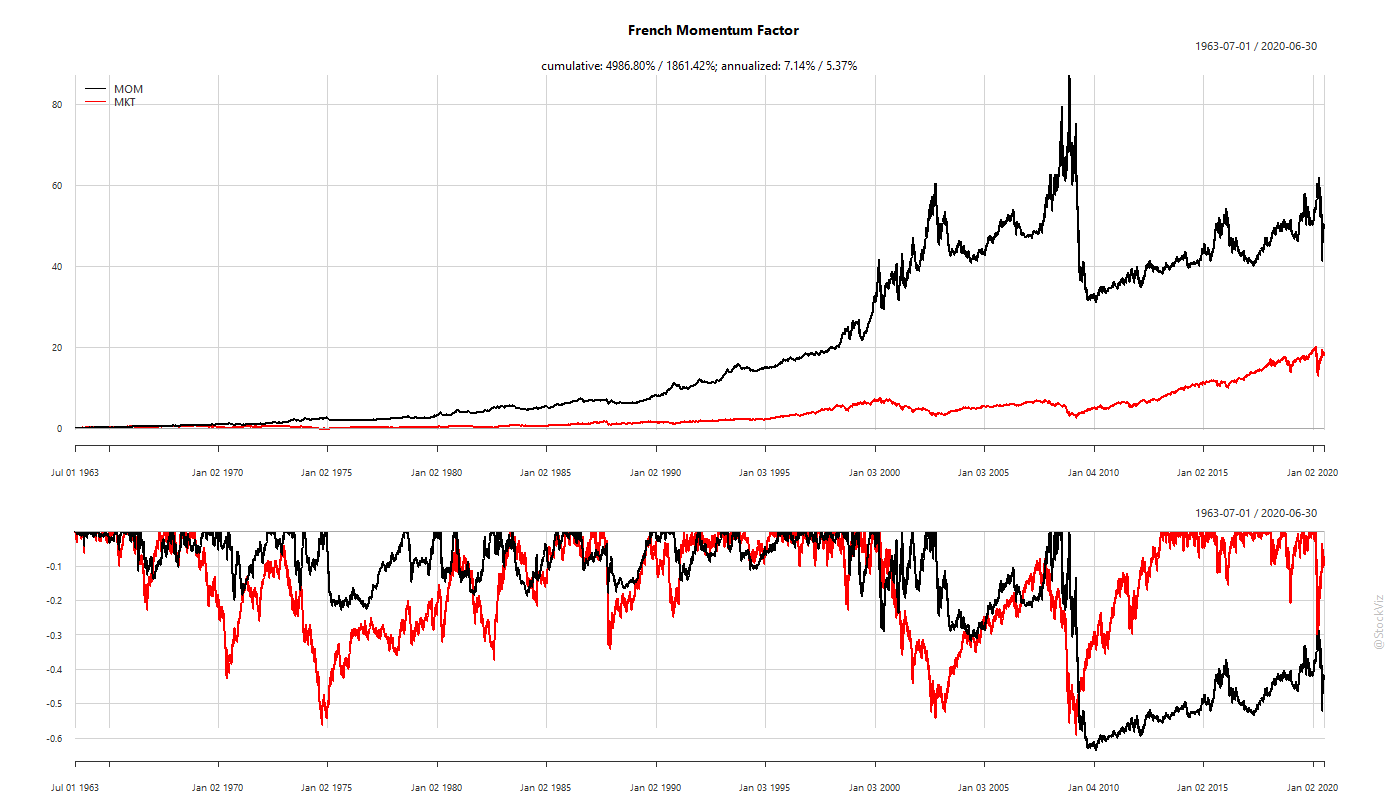
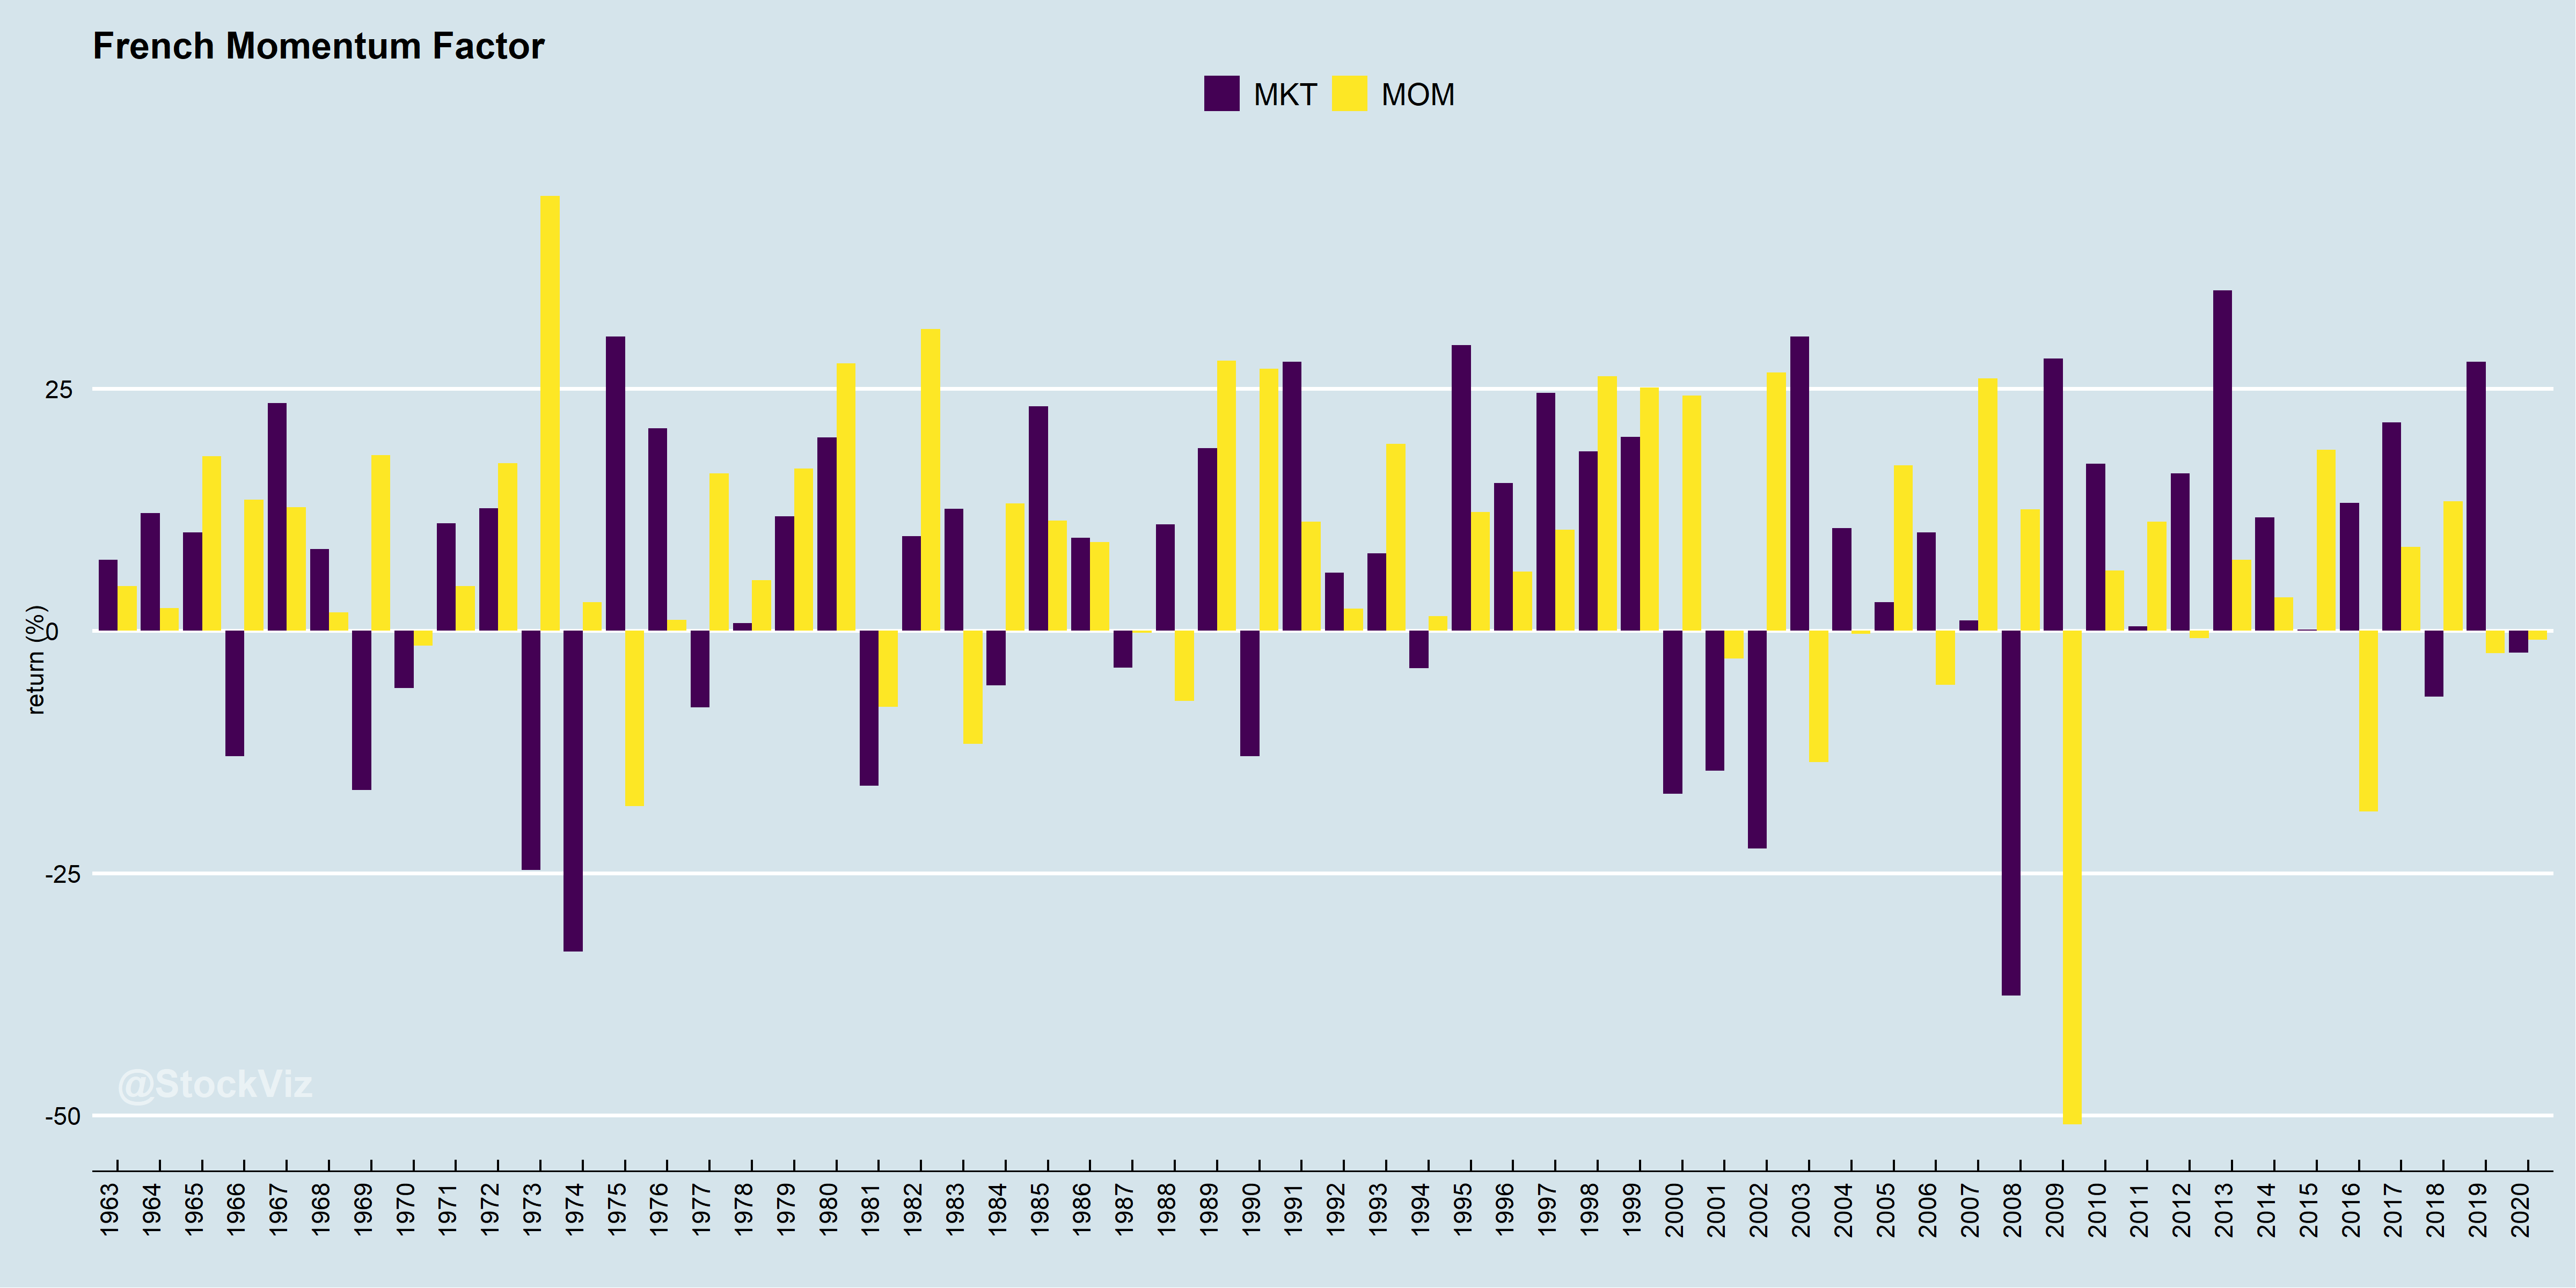
While the momentum factor (MOM) has out-performed the market factor (MKT = rm – rf = Market risk premium), over the long term, it is not without its share of pain.
Long-only Momentum
As “retail” investors, we typically invest in long-only portfolios. This makes momentum investing an extremely gut-wrenching ride. One day, you might be thinking which Greek island you are going to buy and the next day you might be scrambling to pay rent.
Momentum strategies have been packaged as an ETF for retail investors in the US for a while now. PDP, the Invesco DWA Momentum ETF, and MTUM, the iShares MSCI USA Momentum Factor ETF, are the 800-pound gorillas in the room.
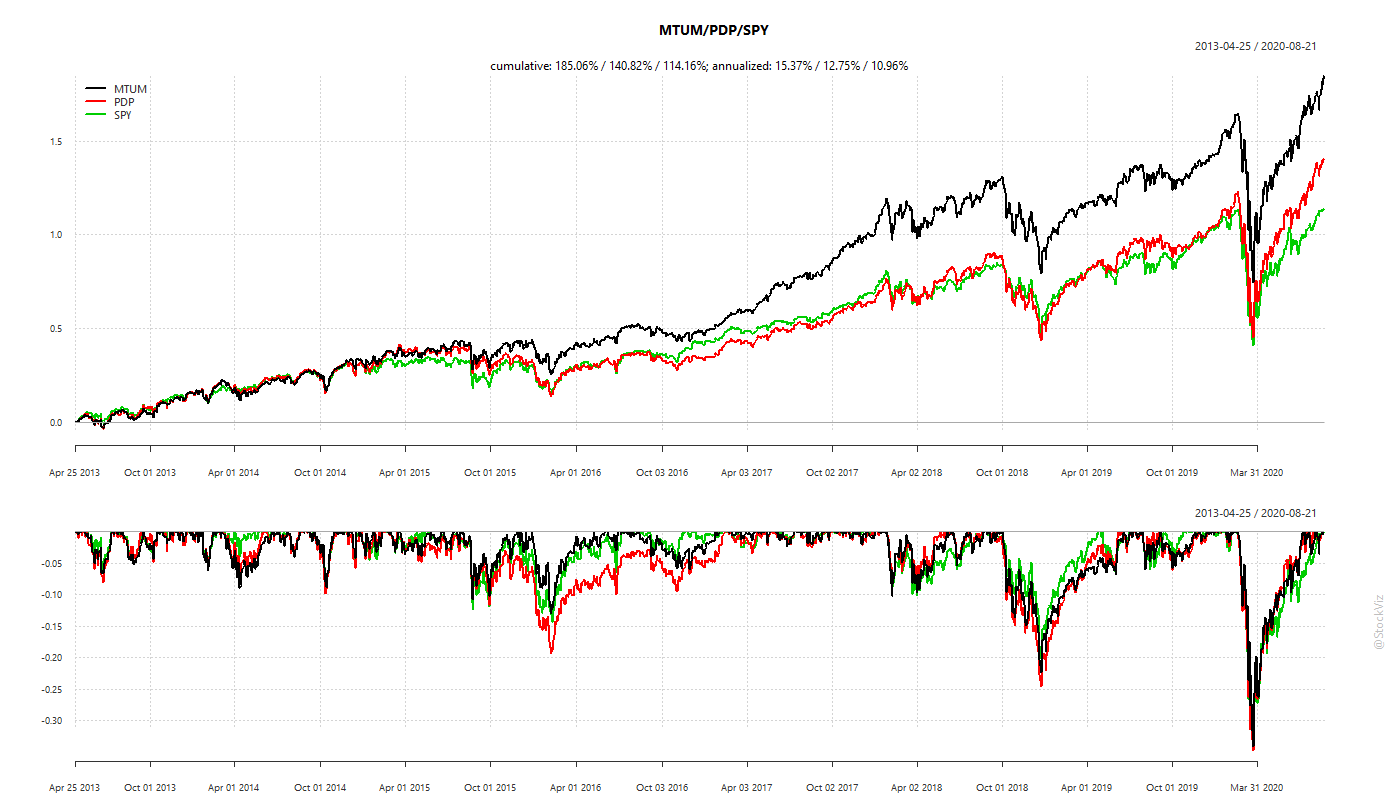
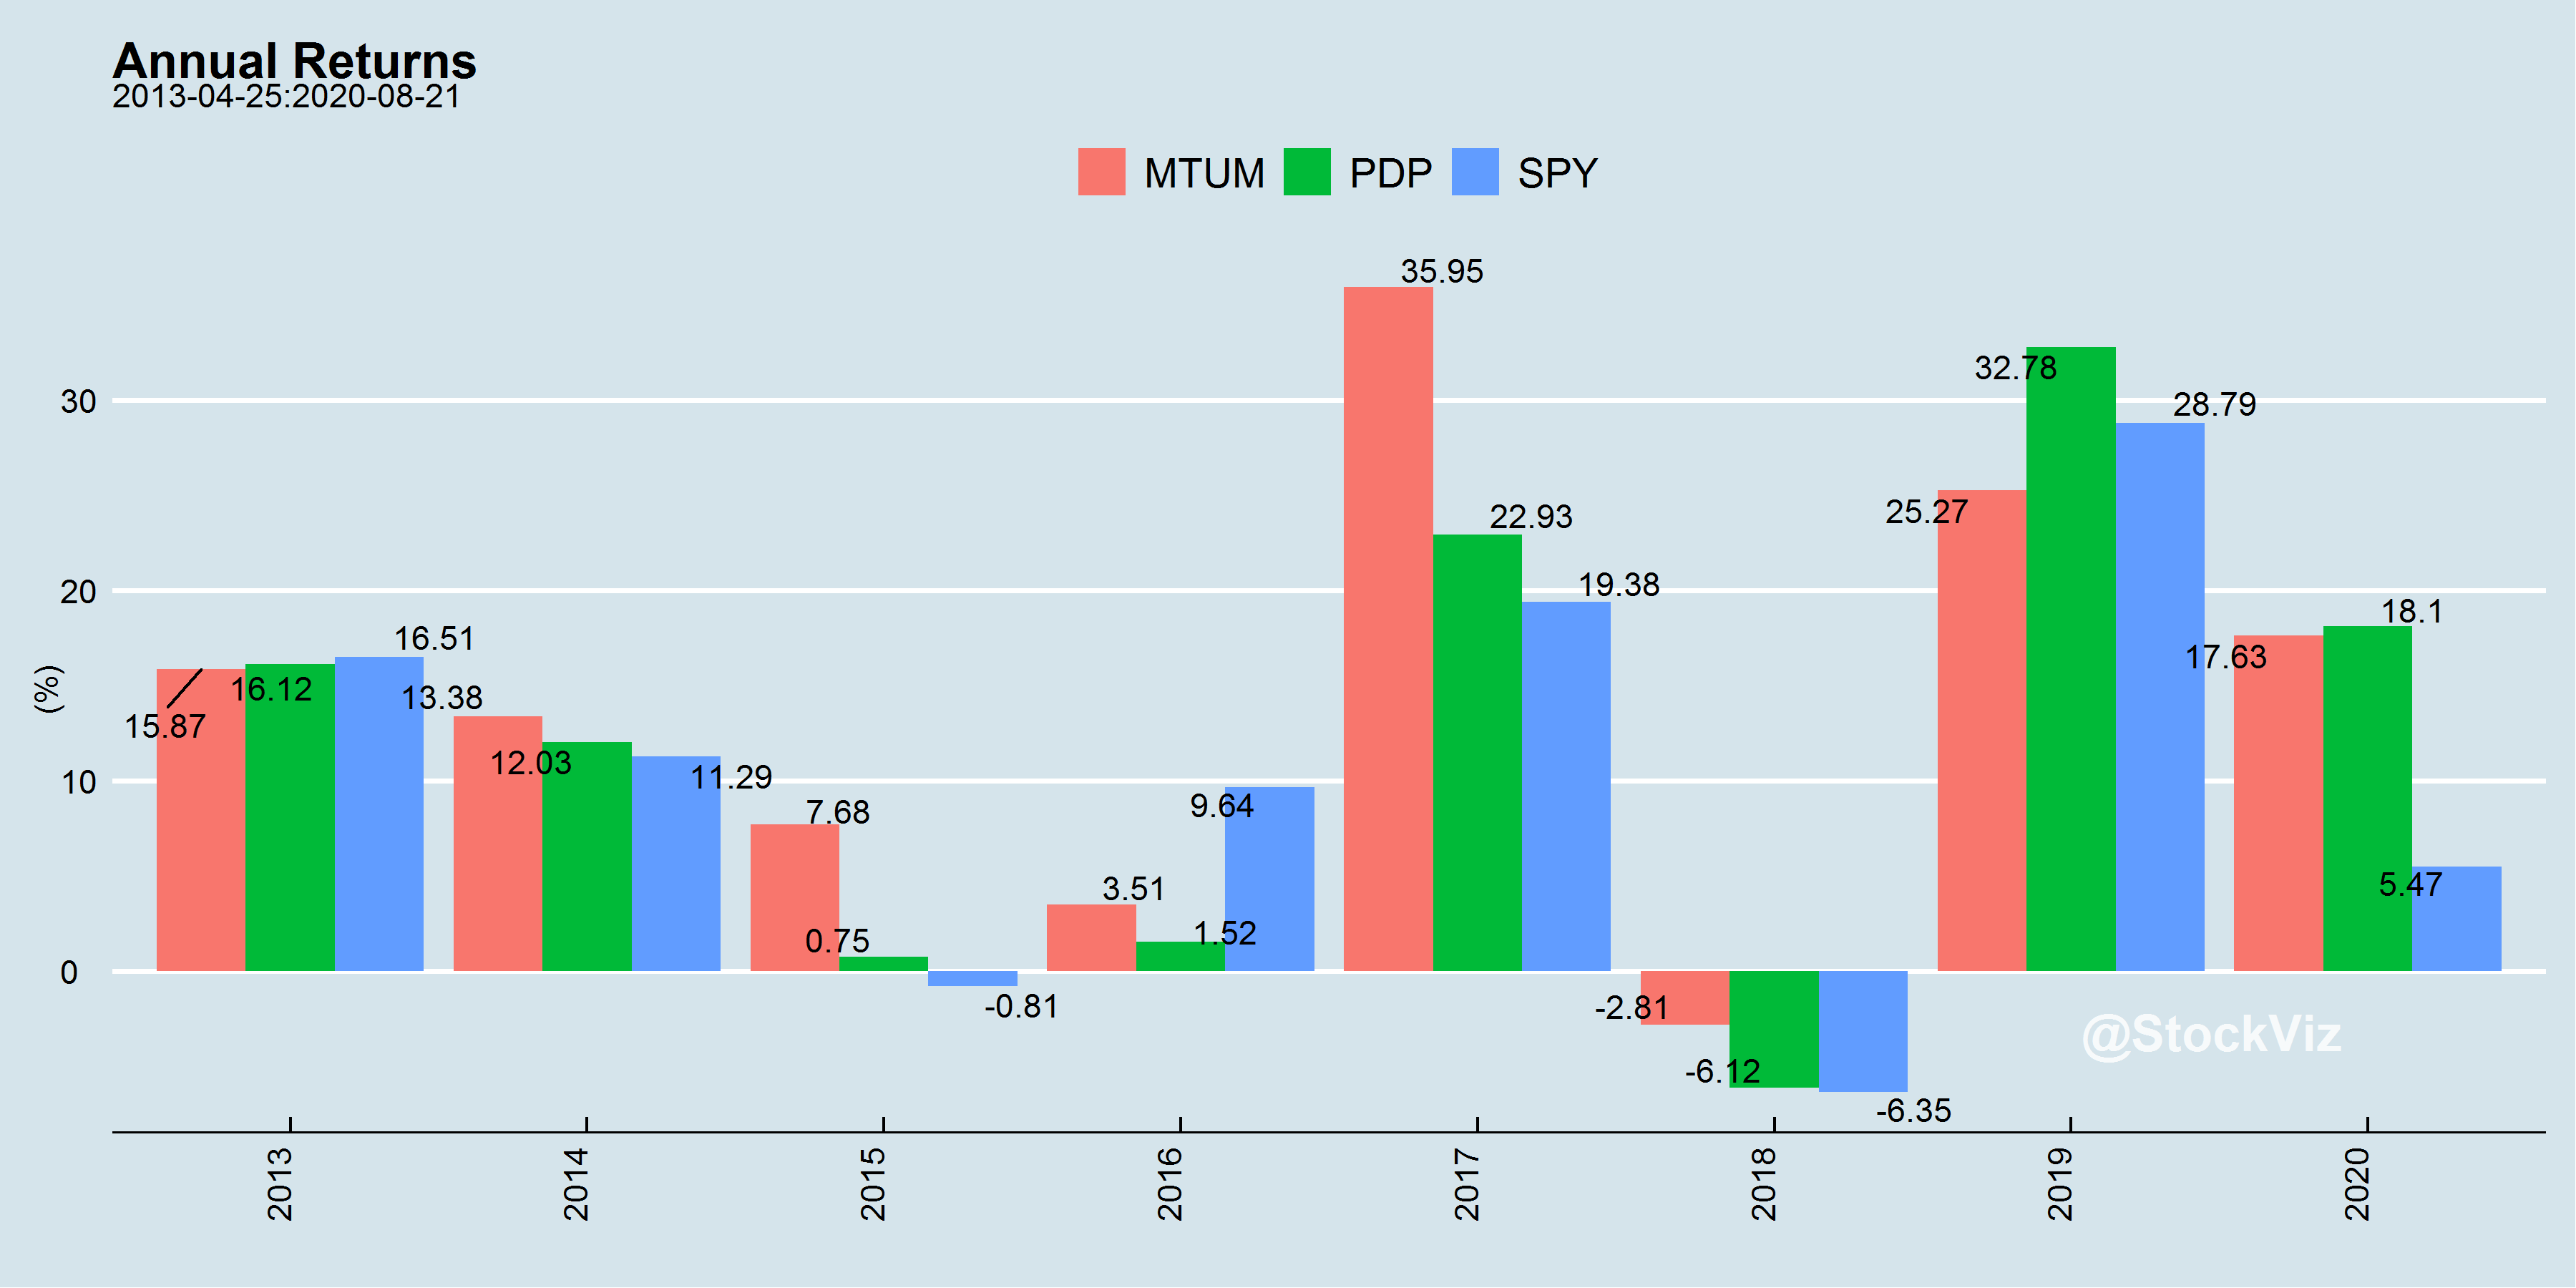
The differences in performance highlight the different ways momentum strategies can be implemented.
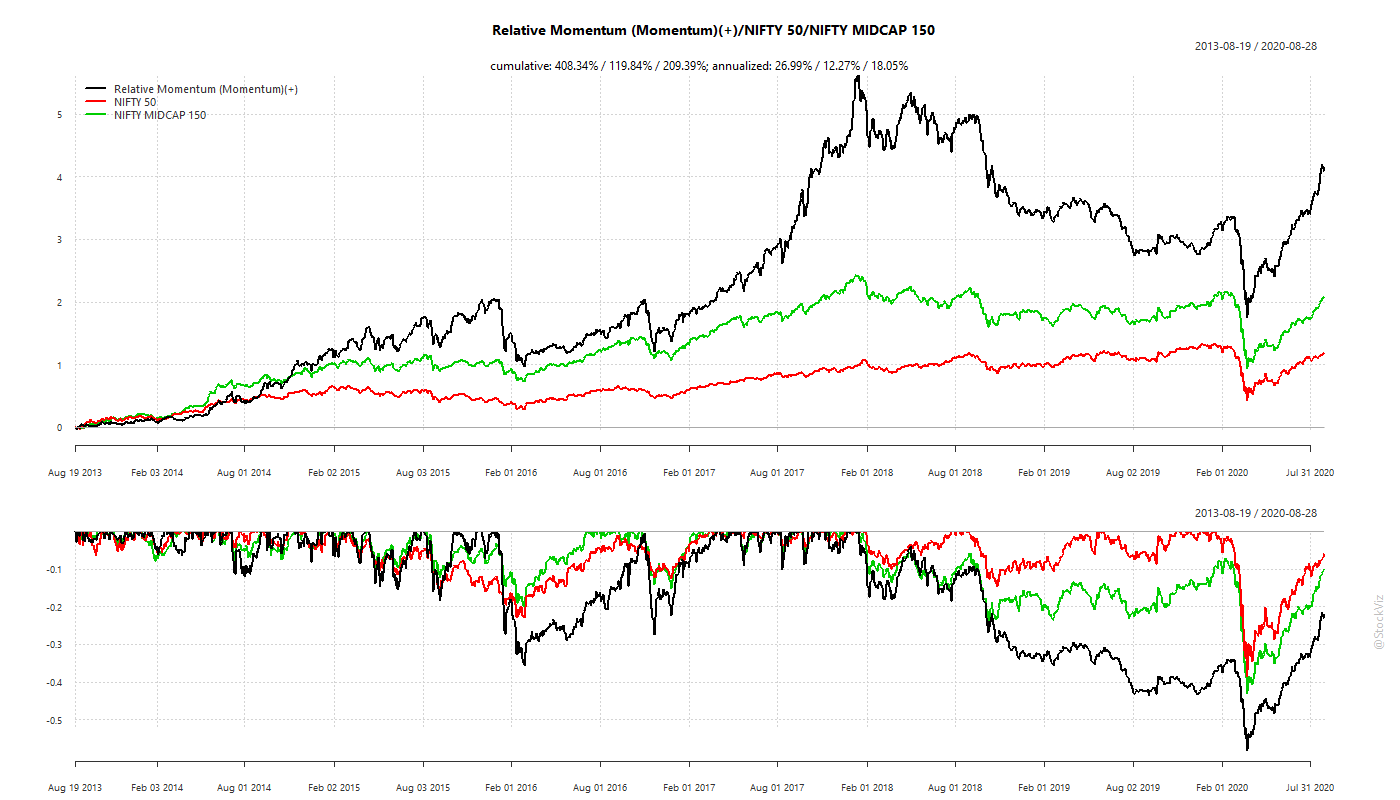
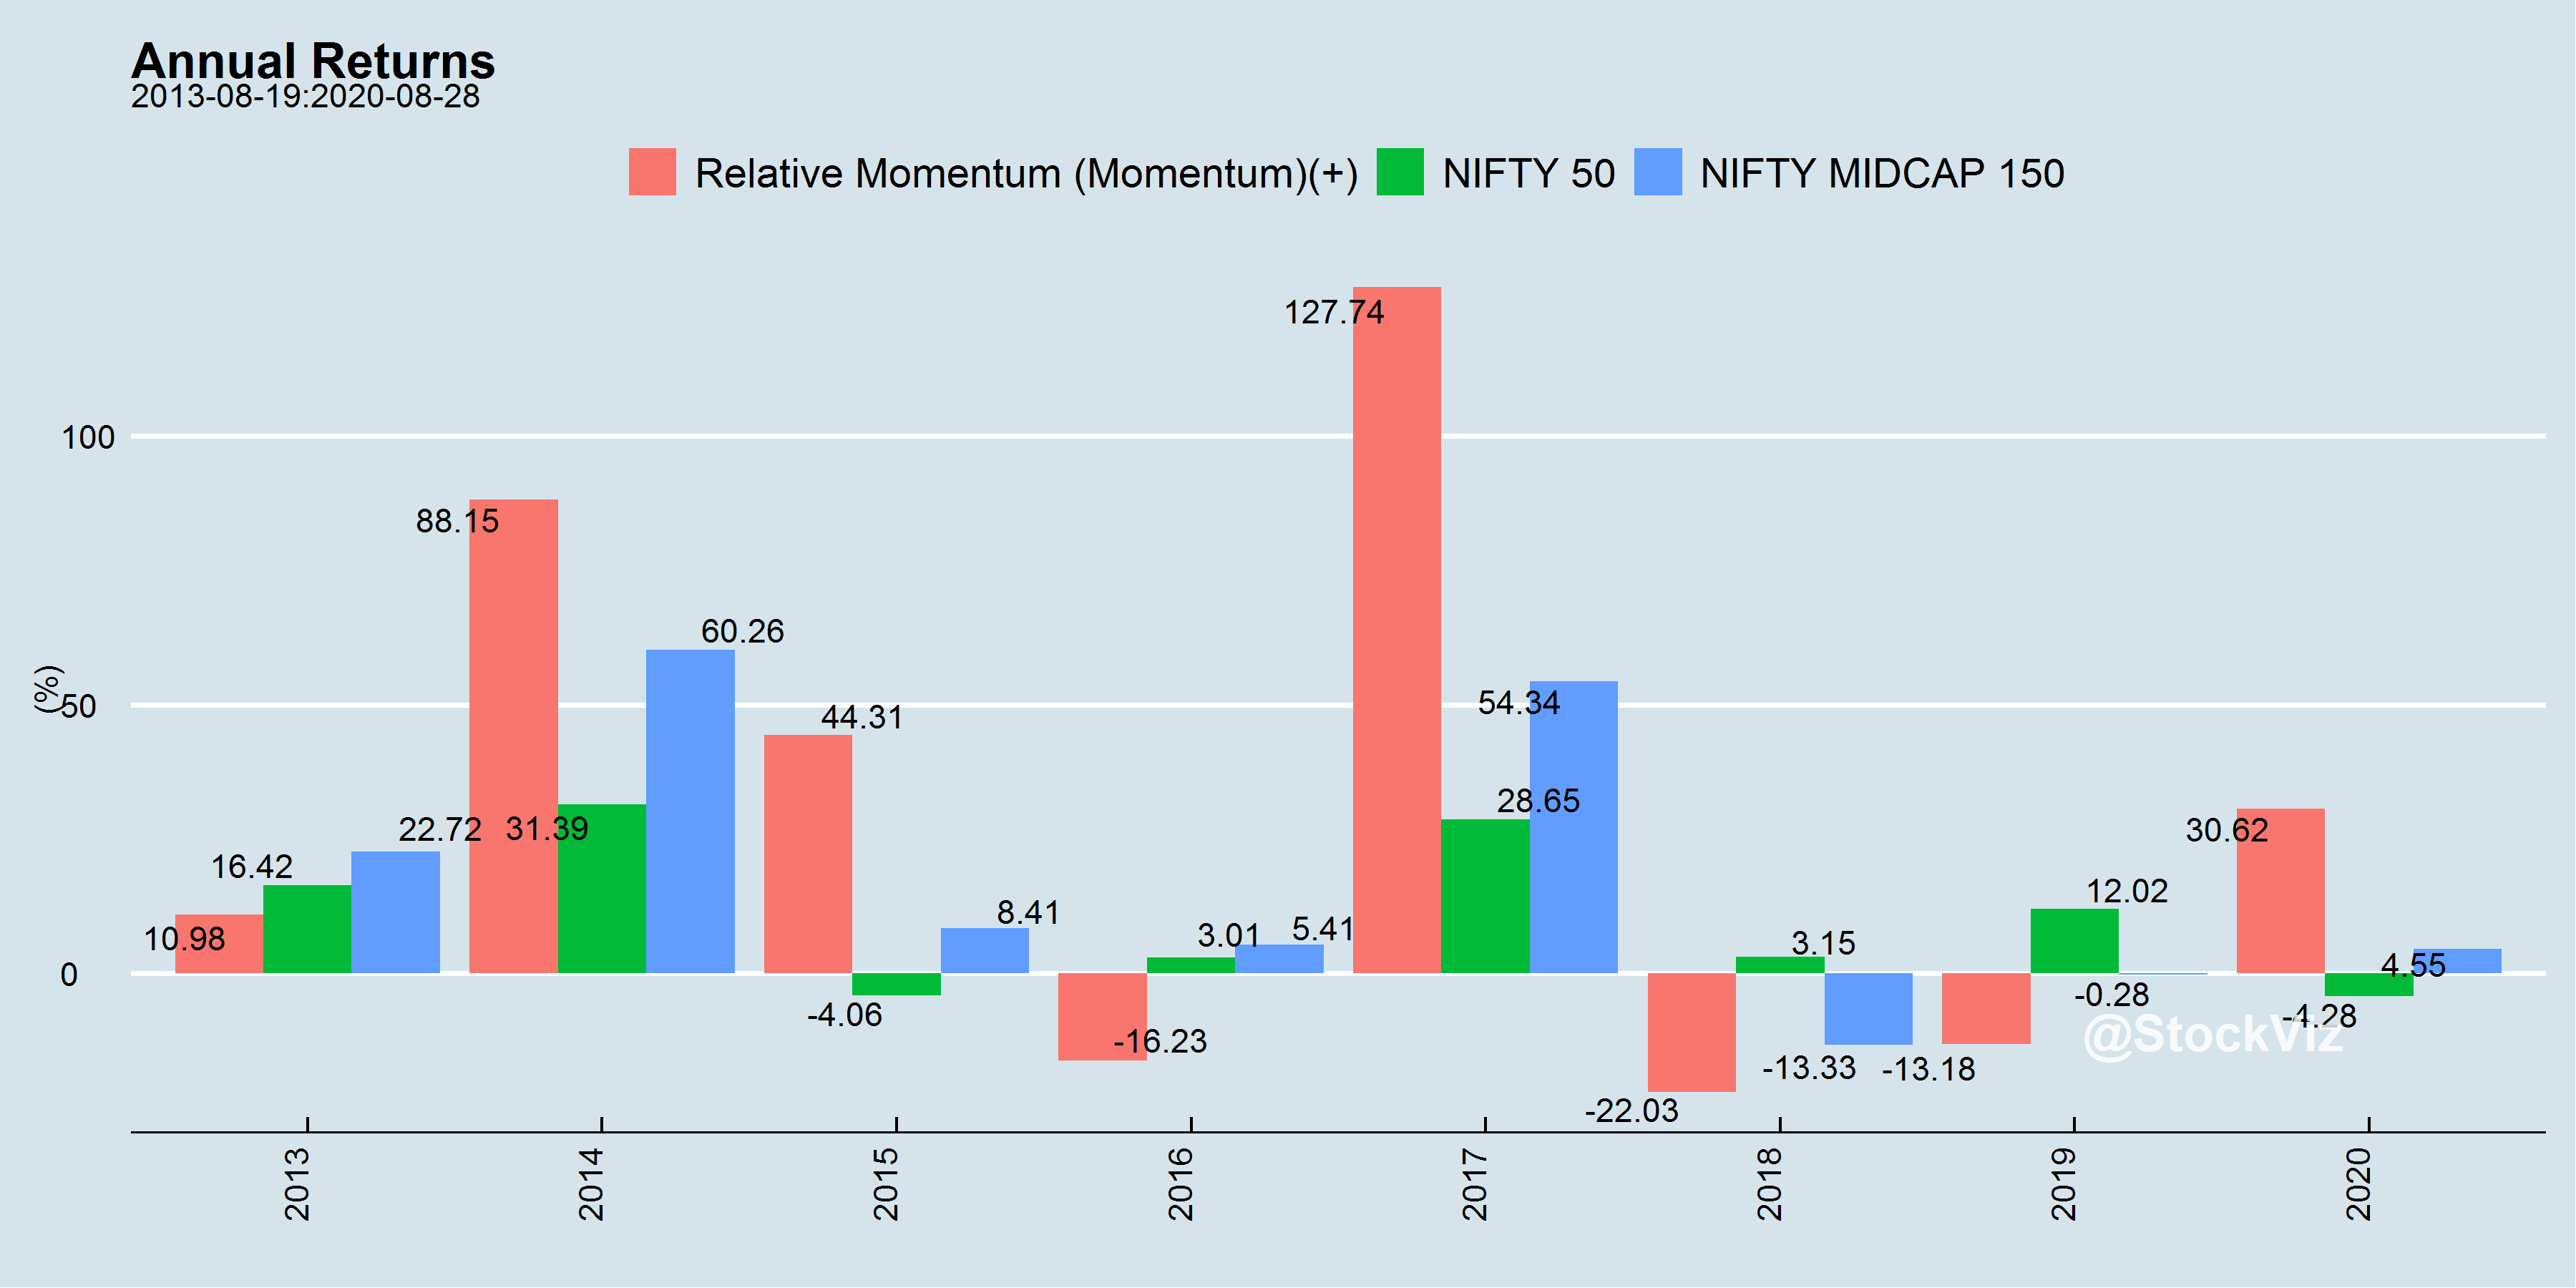
The Indian story is relatively new. A monthly-rebalance momentum strategy has delivered superior returns (although, with a massive dose of heartburn.)
Measures of Momentum
Once the J/T paper was out, academics got to work and systematically mapped out more than a dozen different ways to setup up momentum portfolios. The most common ones are:
12_2/12_1/12_0: These are the “original” momentum portfolios formed by only looking at absolute returns.
Relative: For each stock, create a distribution of relative returns over every other stock in the universe and use it to drive portfolio formation.
Acceleration: Rank stocks based on how well they have performed over the last 6-months vs. their preceding 6-month returns.
CAPM-α: Rank stocks based on their α over an index.
Sharpe ratio: Rank stocks based on their Sharpe ratios.
Idiosyncratic/Residual: Rank stocks based on what is left after fitting a Fama-French 5-factor model. i.e., whatever cannot be explained by the 5-factors.
52-week or All-time Highs: A portfolio of stocks who’s prices have hit either one-year of all-time highs.
These are further combined with some sort of risk management measure, like a stop-loss or a trend overlay. So, based on the universe of stocks, frequency of rebalancing, momentum measures and risk-management technique applied, there are hundreds of different “momentum” portfolios that can be created.
Conclusion
While momentum is now a well established investment strategy, it is not an easy one to be married to. Differences in portfolio construction: formation periods, skip months/weeks, stock universe, stop-losses, etc. have a big impact on overall performance.
While momentum definitively underlines the “no pain, no returns” maxim, in a twist of irony, academics discovered the “low-volatility” anomaly. What if, investors can take less pain for more returns? Stay tuned for our next Free Float!
Introducing the All Star Portfolio
Given the large number of choices in front of investors these days, we felt that there should be an on-ramp for those who want to just follow along a systematic strategy without committing their portfolios.
So, we built a momentum portfolio that is easy for first-time investors to follow along. We call this the All Star Portfolio and is based on stocks hitting their all-time-highs. Just subscribe to our substack and receive emails whenever there is a change in the portfolio.
What’s your opinion on nifty alpha low volatality index. An ETF is also launched recently based this index
It looks promising.
We have been tracking a live, un-capped, portfolio of it since end of Jan 2018 and is up +11.88% compared to NIFTY 50’s +4.65%, after costs.
It’s risk profile is the same as NIFTY 50’s.
Since it is trading only large cap names, capacity shouldn’t be a problem.
But I would be vary of ETF liquidity and would wait for an index fund/FoF offering of the same.
Dear Shyam, appreciate your feedback. Since I am long term investor, my I investment in this ETF formed the biggest allocation in my porfolio. My assumption is that liquidity in ETFs will improve over the next decade. 5 percent cap to single stock; with 92 % weight to mix of N50 and Nnext50 with 8 % to midcap, risk adjusted returns seems to be better than the top two indices. Since no ETF/ index fund is available for alpha 50 index, how to get the quarterly portfolio updates on this index?
All index data can be found at: https://www.niftyindices.com/
i am interested in all star portfolio. can i make payment using upi or netbanking as i dont have credit card. whom to contact for any query regarding portfolio. what other benefit will i get by subsribing all star portfolio
What happens during a downturn and/or sideways market? Do you recommend getting out of stocks during that phase?
No. Follow the strategy. Control risk through allocation, not market timing.
This pithy, but profound one liner is buried in some comment. You should move this to your Twitter Bio, or at least to the Zerodha article on asset allocation.