Outline
We consider long-only momentum returns to be composed of market returns plus excess returns.
If excess returns over a specified period, n-days, (say, 5- or 10-days) either trends or mean-reverts, then that can be used to trade the momentum portfolio.
One way to check if a time-series is trending is to calculate the Hurst exponent (H) over a rolling window (say, 5-years) of n-day excess returns . If H < 0.5, then the time-series is mean-reverting; if H > 0.5, then it is trending, else it is random.
A simple strategy would be, for H < 0.5 (mean-reverting), if excess returns is greater than its median, then exit or if excess returns is less than its median, then enter.
The problem boils down to specifying the excess-return calculation periods (n-days) and the Hurst exponent rolling windows so that it makes sense (avoid data-mining.)
Setup
We use the Barclays Euro-zone, UK, Japan and US momentum index data-sets to run our experiment. Since they provide both an excess-return index and a total-return index, we can use the former to time entries and exits in the latter.
We ran for two n-day configurations: 5 and 10. We set the Hurst (and median) rolling window at 5-years.
We expected to find H to be either consistently above or below 0.5. My personal expectation was that H would be above 0.5 (trend.)
Results
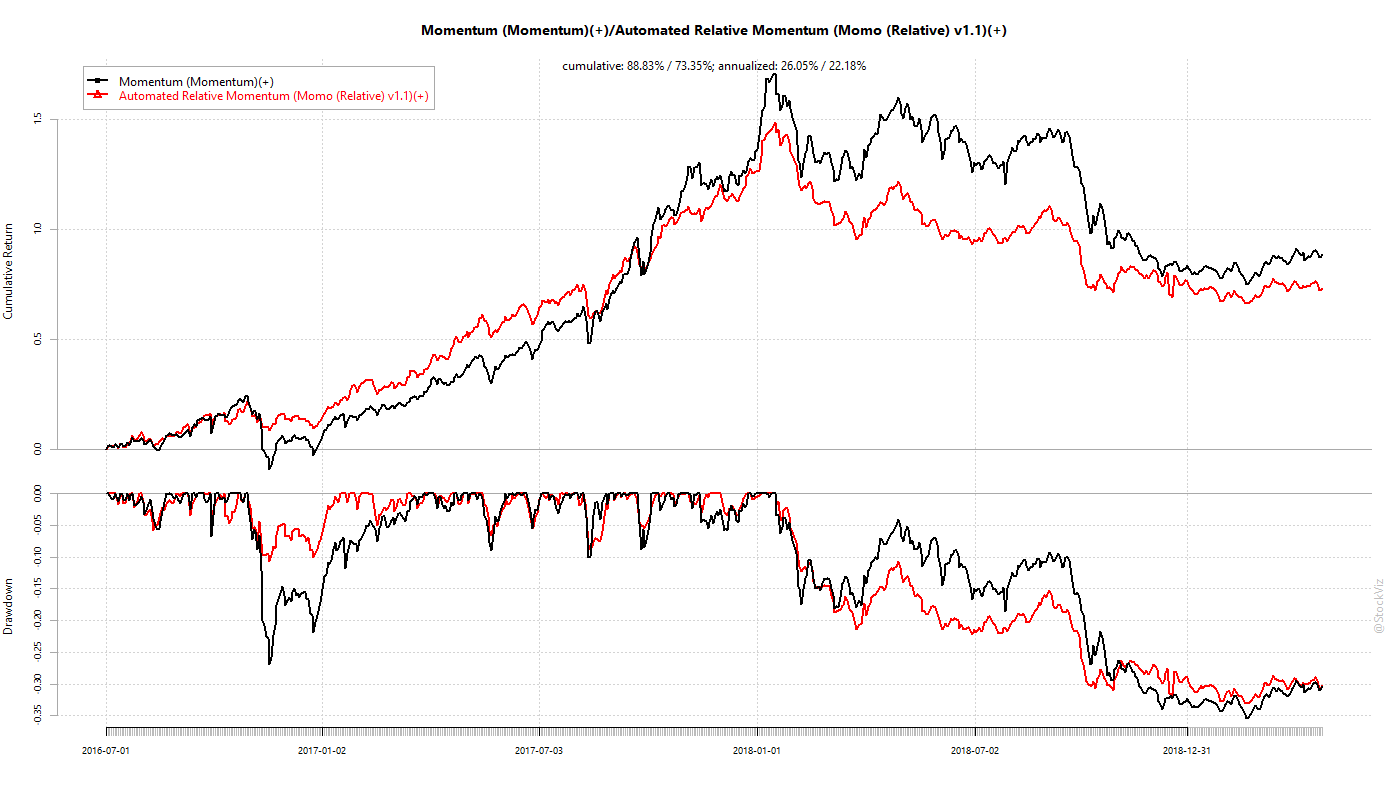
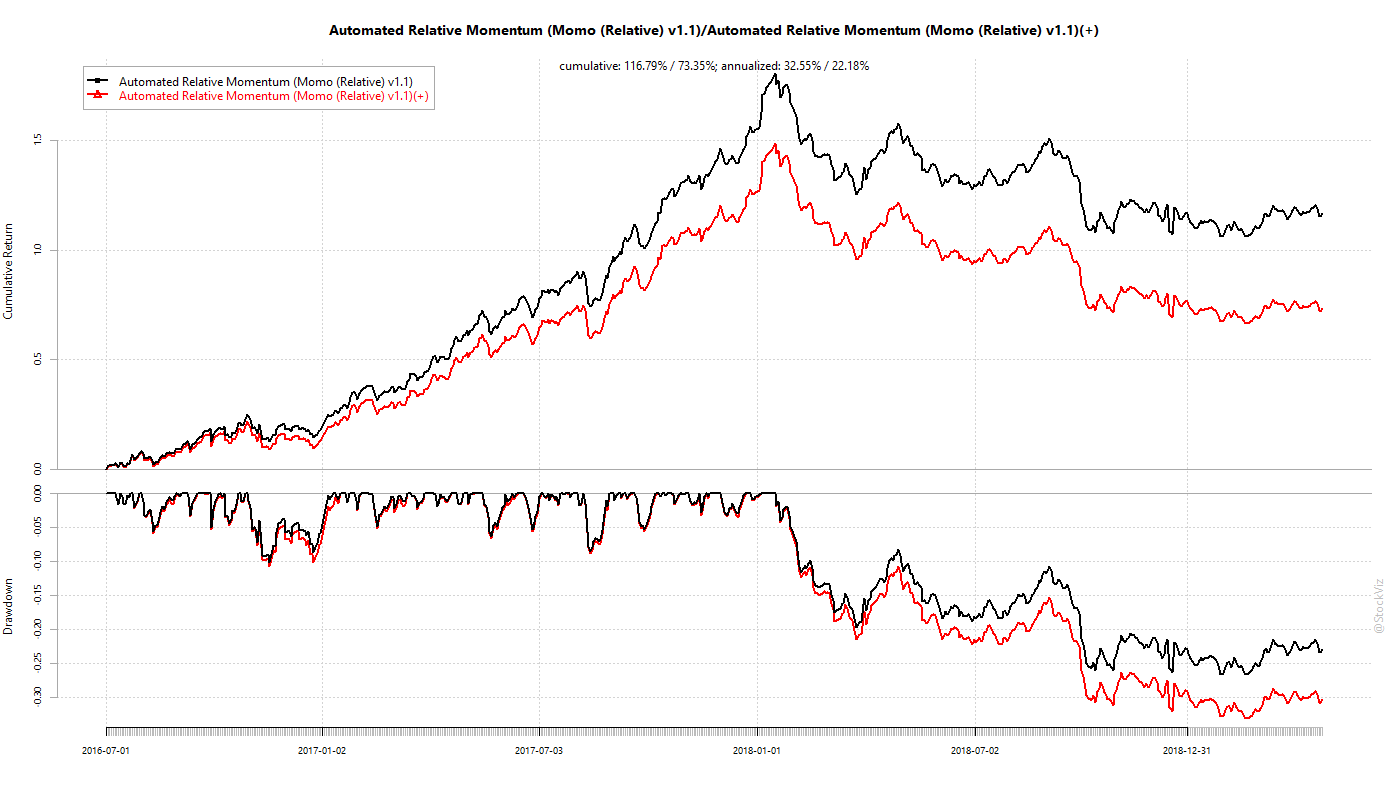
Using the Hurst exponent did not improve momentum returns. In both 5-day and 10-day configurations, a strategy that went long if n-day returns were less than their median out-performed those that incorporated H.
The back-test using 5-day returns mostly worked on Euro-zone and US momentum indices. So we are skeptical that this approach can be generalized and it will likely fall prey to data-mining.
The back-test using 10-day returns saw buy-and-hold emerge a consistent winner.
The 5-day H toggled between trending and mean-reverting but spent most of its time trending. The 10-day H was consistently trending. For the specifications that we tested, momentum excess returns trends.
Code and Charts
The R code is here: 5-day and 10-day config. You can login to pluto and play around with the lookback and statWindow variables to see how H, median and back-test results change.
Questions? Ask them over at our slack workspace.
-USA.cumulative.1994-06-30.2019-02-20.png)
-USA.annual.1994-06-30.2019-02-20.png)


