Sometimes, a research paper comes along that gives academic rigor to an obvious thing that trend-followers were doing for decades and makes you sit up and take notice. Moving Average Distance as a Predictor of Equity Returns, Avramov, Kaplanski and Subrahmanyam (SSRN) does just that.
Turns out, a simple moving average crossover signal proves robust to momentum, 52-week highs, profitability, and other prominent anomalies.
A later paper extends it to international stocks and finds similar results (SSRN).
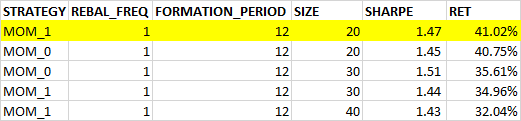
A quick backtest shows that it works for Indian stocks as well.
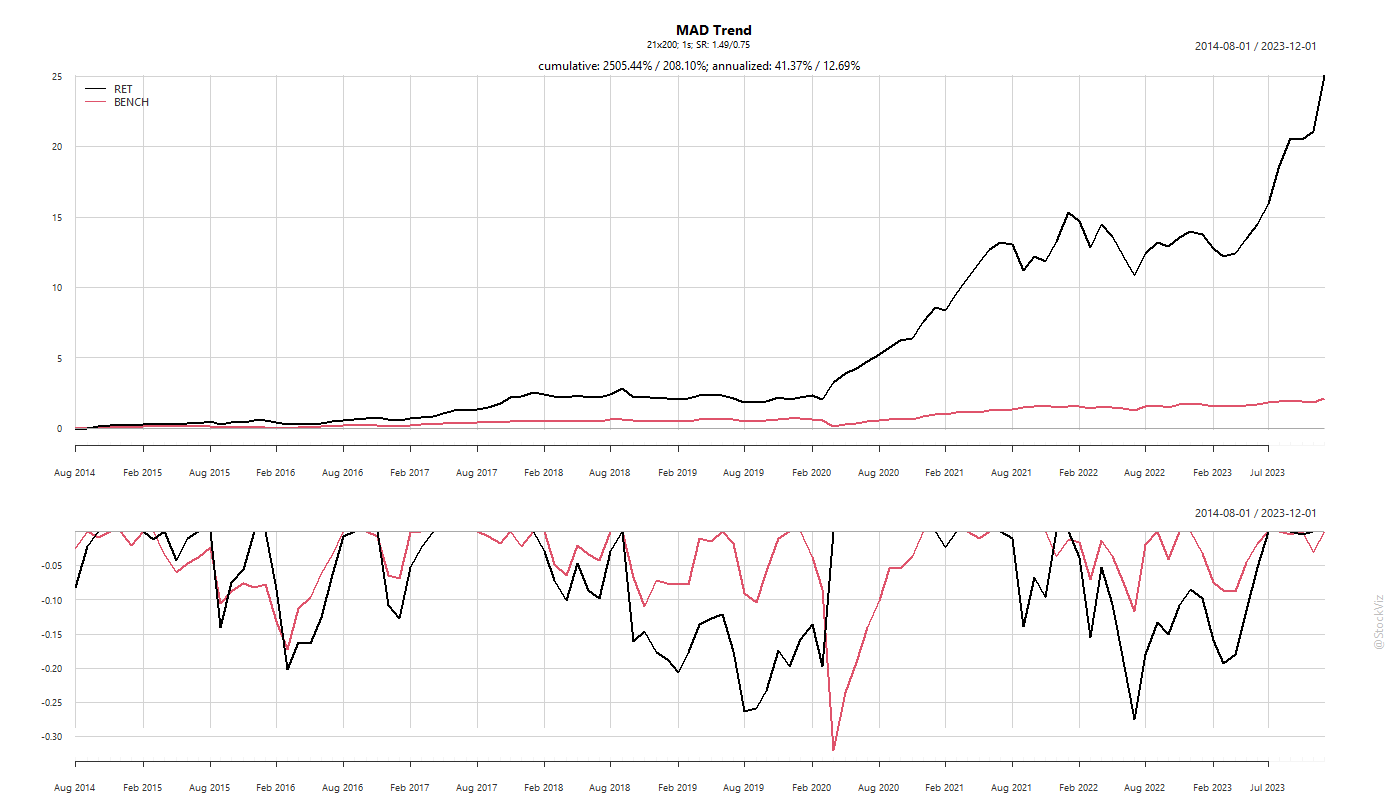
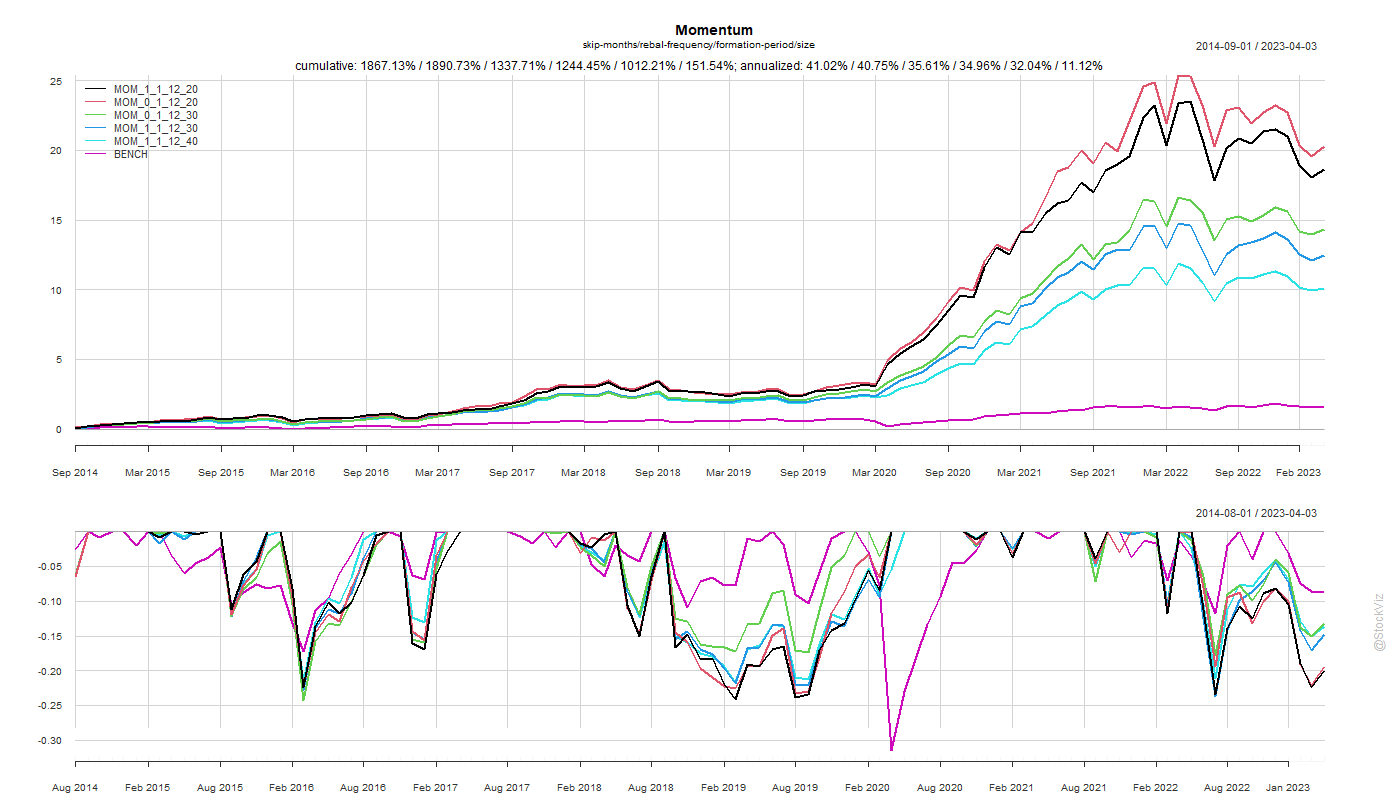
It looks like COVID turbo-charged this strategy. The pre-COVID equity curve is saner.

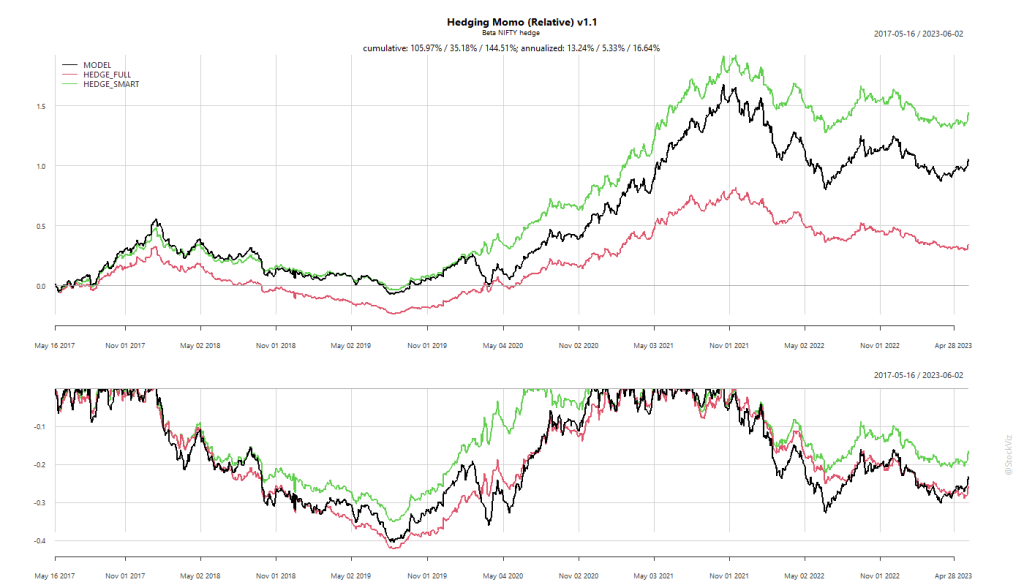
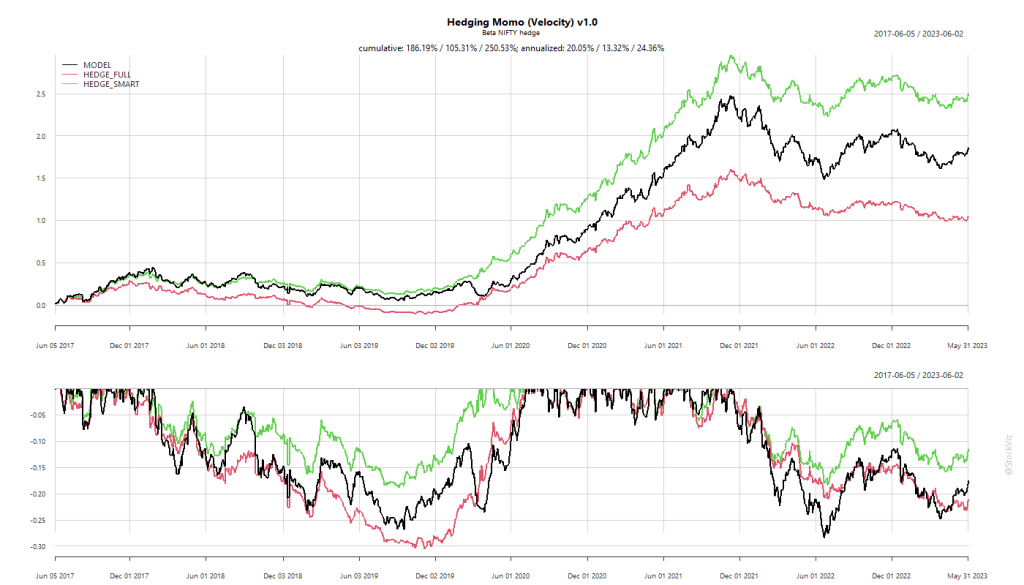
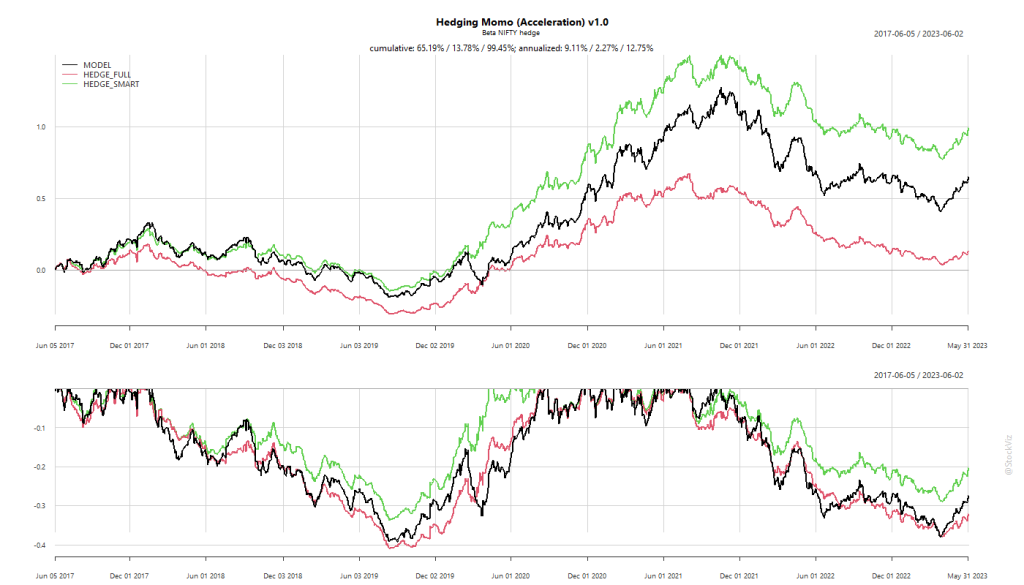
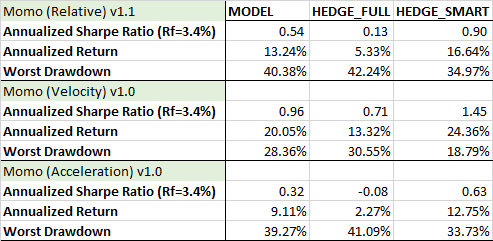
The returns are good but it comes with some nasty drawdowns. Not sure if most investors can stomach a 25% drawdown that lasts over a year. Can it be made better by applying a volatility filter?

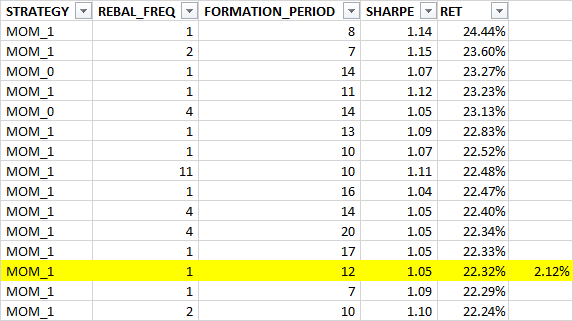
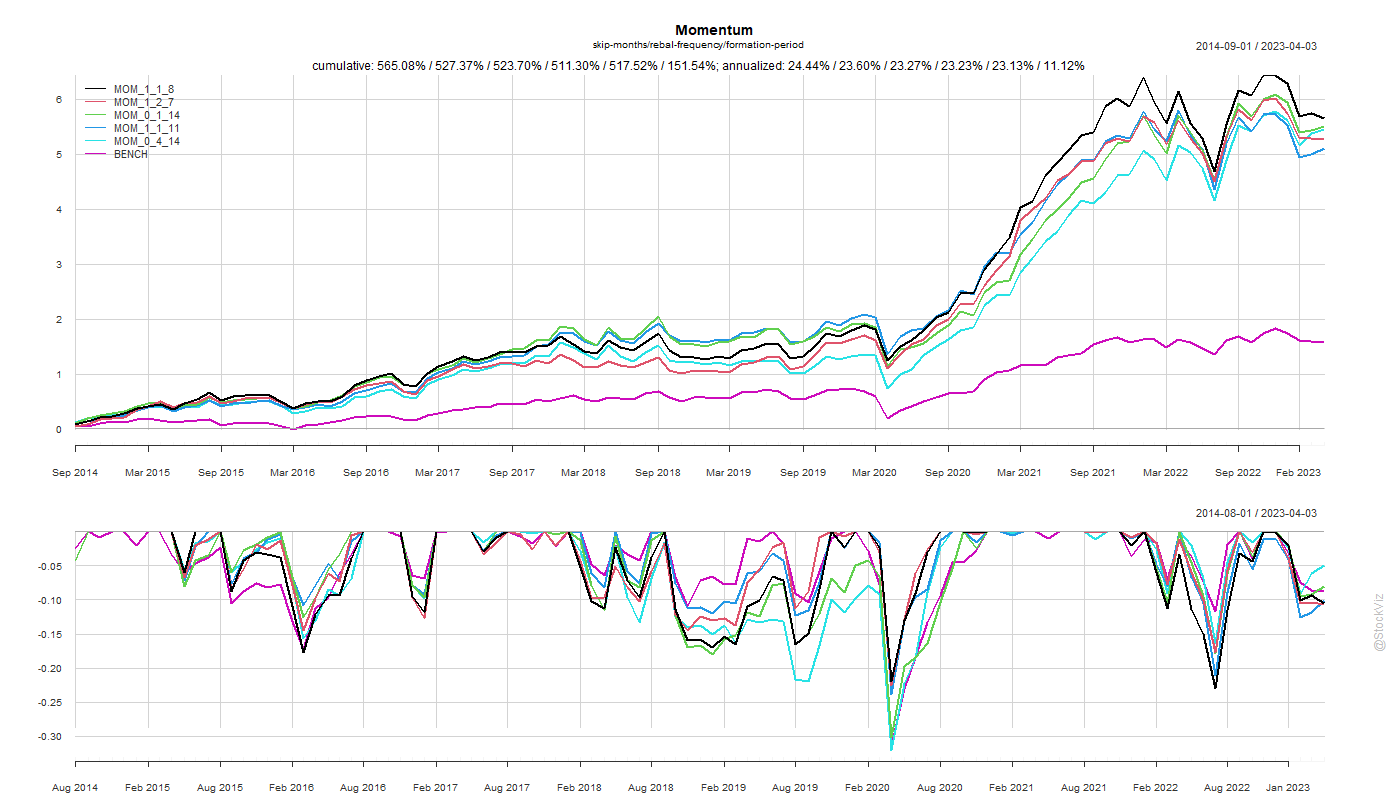
By sacrificing 2 points of returns, you can get to a sub 20% drawdown. Also, the filter worked during the most recent 2021-23 drawdown as well.

You can follow along the live version of this strategy here: MAD 21/200
Code and charts on github.