High octane strategies for your portfolio
The biggest advantage that retail investors have is that they don’t have to worry about managing a huge portfolio with different types of investors with differing time-horizons and expectations. And of course, there’s the straightjacket of mandates that bind professional investors.
The problem with bucketing yourself as a “value investor,” “contrarian,” “growth,” or “momentum guy” is that you lose the biggest advantage that you have: flexibility and the ability to adapt to the market. Mandates, or lack thereof
Broadly, at a meta-level, investment strategies can either be Ferraris or busses but not both. They are built with different uses in mind. A Ferrari is not going to be able to seat 40 people or tug a 40 ton rig. And you don’t build a bus to go 0 to 60 mph in 3 seconds.
As a retail investor, your life becomes a lot simpler if you decide upfront if you want to drive a Ferrari or take the bus. But once you get on one, be at peace with your decision. Most investors would be better off taking the bus: DCA/SIP into a mutual fund, don’t chase performance, focus on asset allocation and increase your income and savings over time.
However, just because taking the bus is “right” according to conventional wisdom, doesn’t mean that everybody should be forced to get on one. Just like how you have Ferraris, buses and everything else in-between on the road, there are a wide range of investment strategies outside of the mainstream “at-scale” investment vehicles like mutual funds, PMS, managed accounts, etc.
Momo: The Ferrari Of Investment Strategies
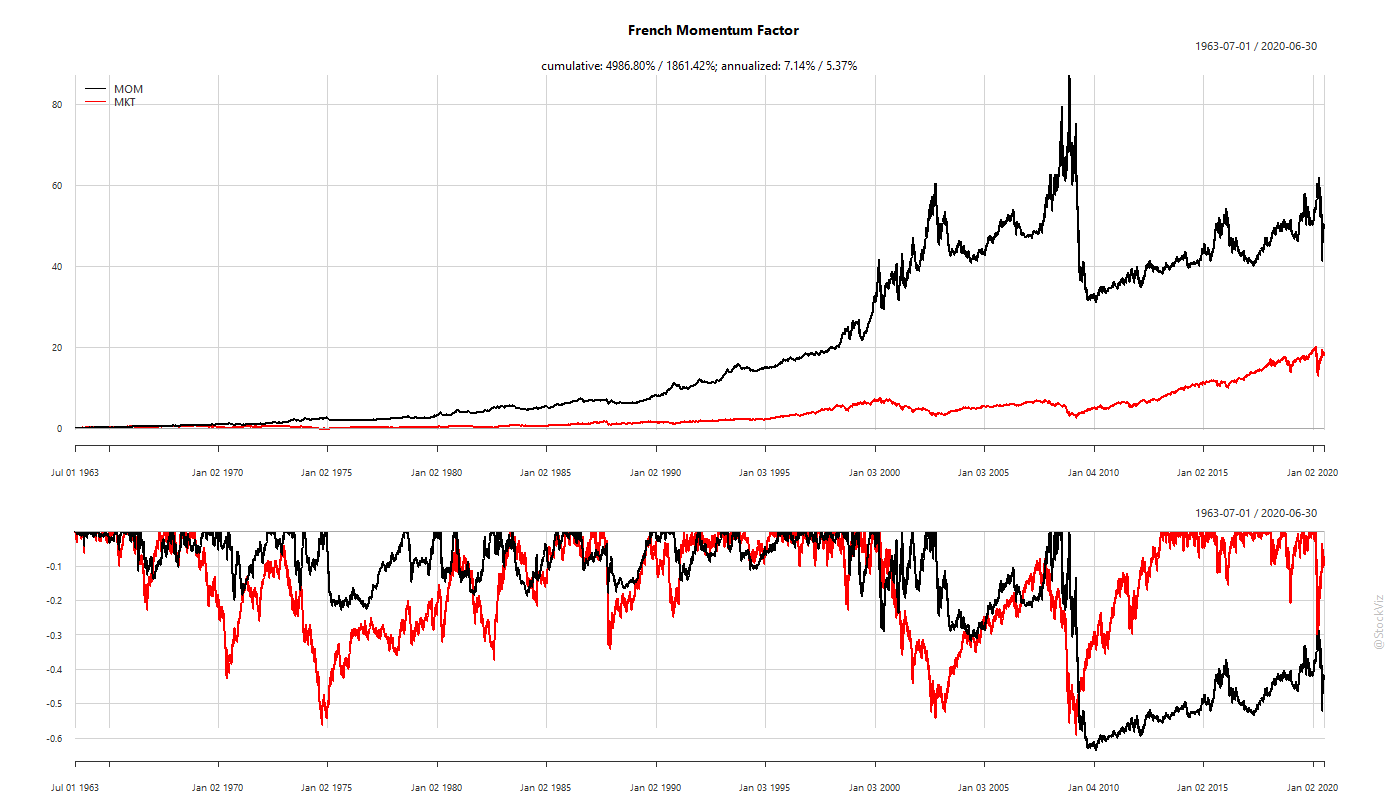
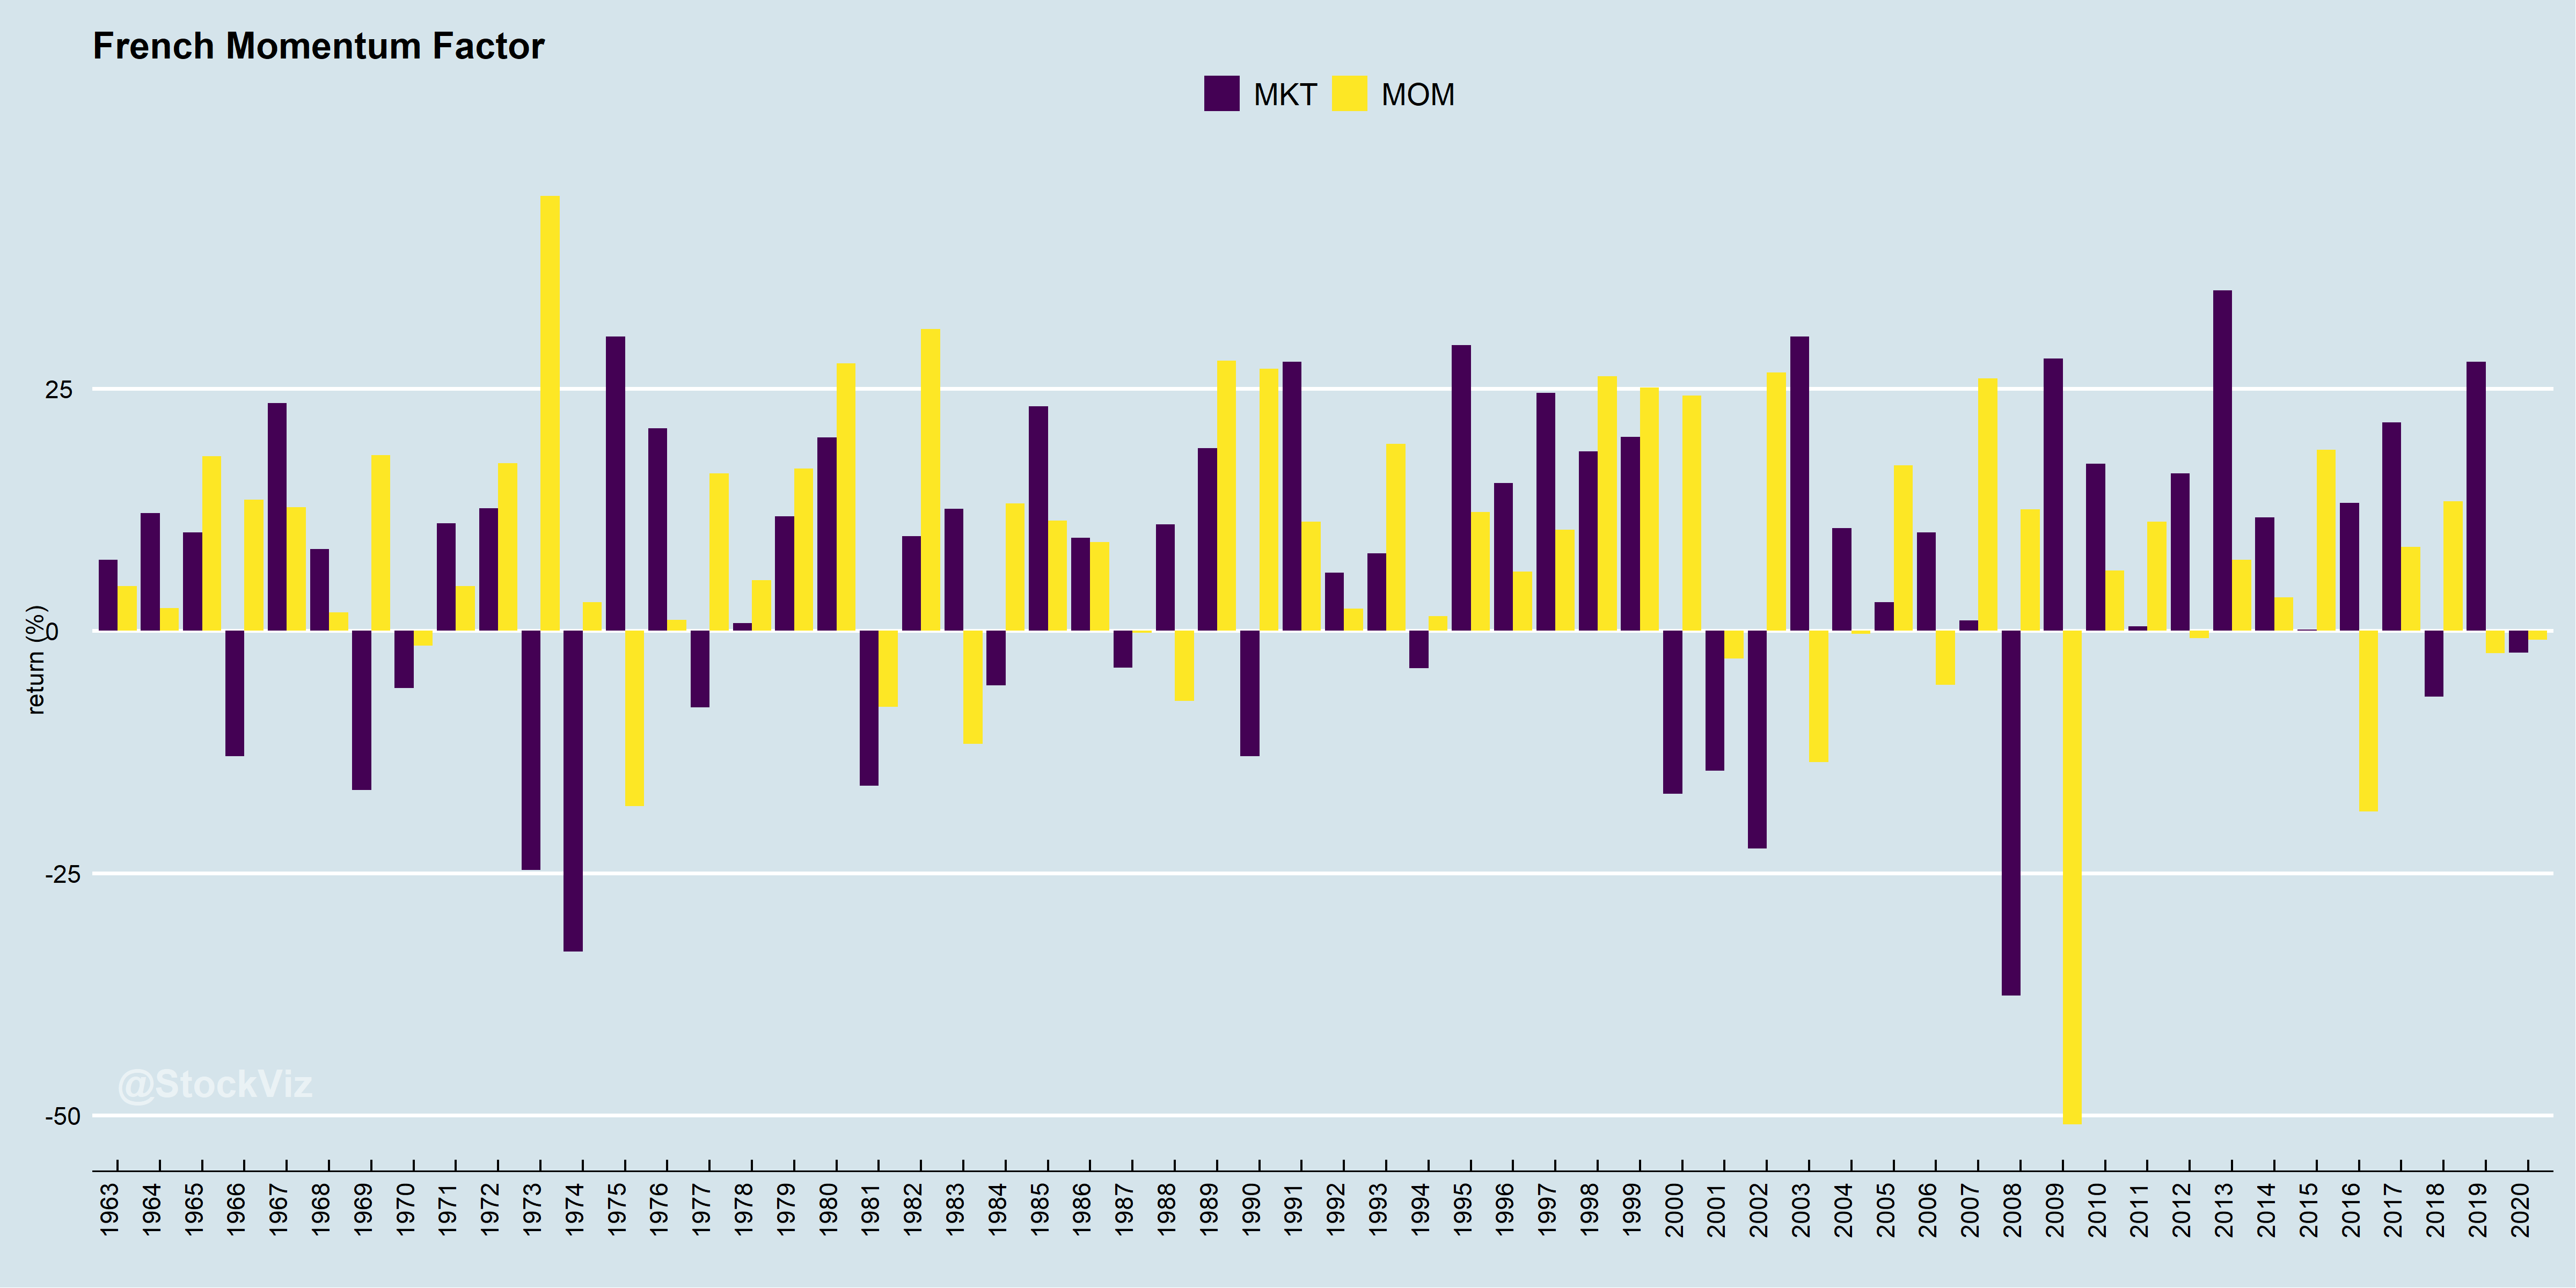
Momentum is a well known Fama-French factor. The problem with momentum portfolios have always been the massive left-tail: when markets are volatile, the drawdowns have been heart-breaking. It doesn’t matter if the portfolio is long-only or long/short, there is no escaping the momentum whiplash.
Then there is the question of rebalancing frequency. To scale a momentum fund, managers need to trade-off transaction and impact costs with being responsive to the market. And that means leaving a fair bit of alpha on the table.
This is the constraint of driving a bus. It can be a fast bus. But it is still a bus.
However, what is true for professional investors and funds is not necessarily true for you, the retail investor.
Do It Often, Do It Better
Most of the early factors were researched at a time when compute power and data were hard to come by. Researchers took the short-cut of using monthly returns to run their analysis because it made the problem more tractable. That set a precedent that is being followed to this day: the monthly rebalance schedule.
The problem with a monthly or a quarterly rebalance schedule is that the market has got a lot faster since the days the papers were written. We live in a world where data is abundant and compute power is a fraction of what it used to be. And trading costs have crashed to a small fraction of what it was 30 years ago.
The world changed.
There is no reason why the market shouldn’t be sampled more frequently.
Some Left-Tails Can Be Docked
A higher frequency approach lends itself to better risk management. It allows for a more responsive position sizing system based on market volatility and the ability to employ “stop-loss” exits on individual positions.
While drawdowns are not entirely avoidable given the nature of the markets, it is quite possible to protect the portfolio against the extremely deep ones. And the deep ones seem to occur at least once every three years, or so.
Avoiding the worst of the drawdowns allows for faster compounding of the portfolio.
Momos are risk-managed, frequently sampled momentum strategies.
Our Experience With Momos
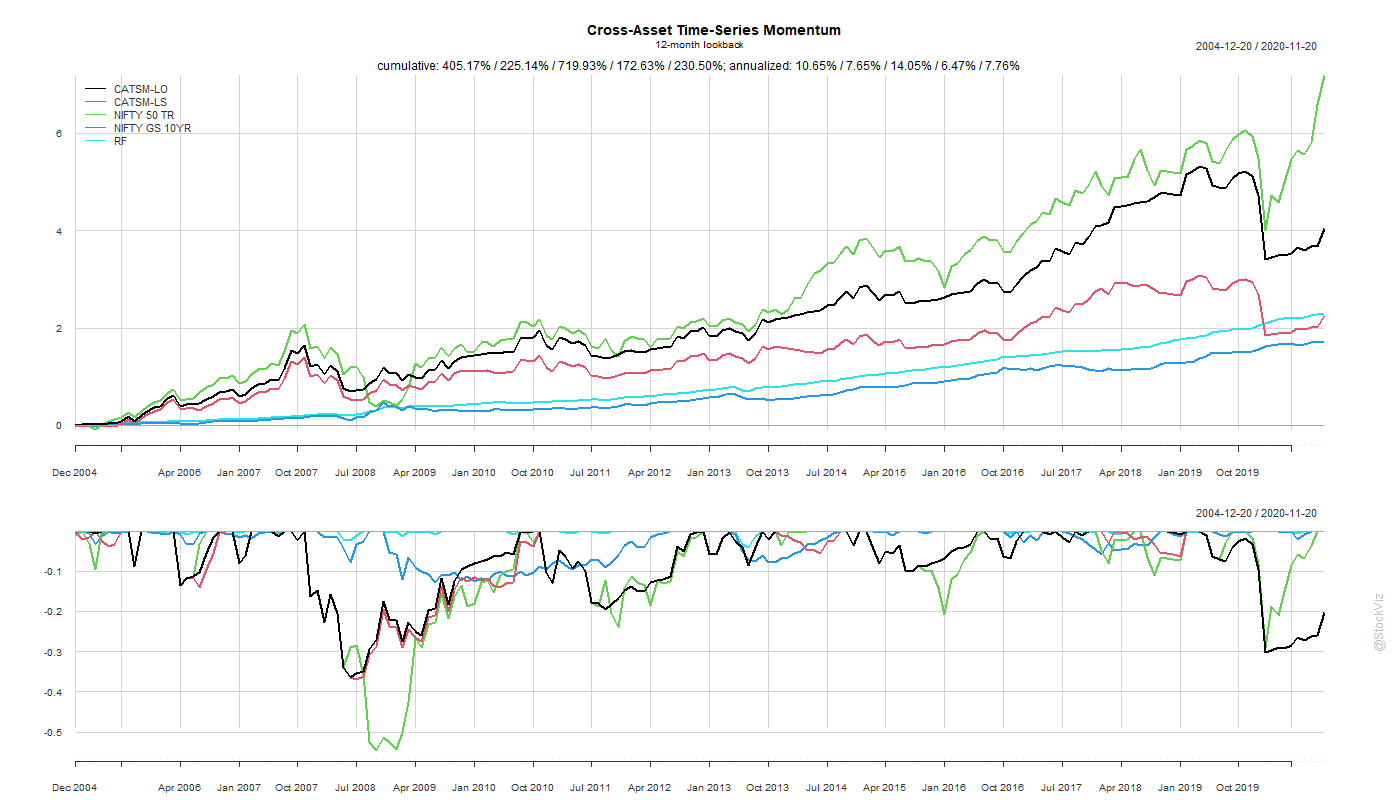
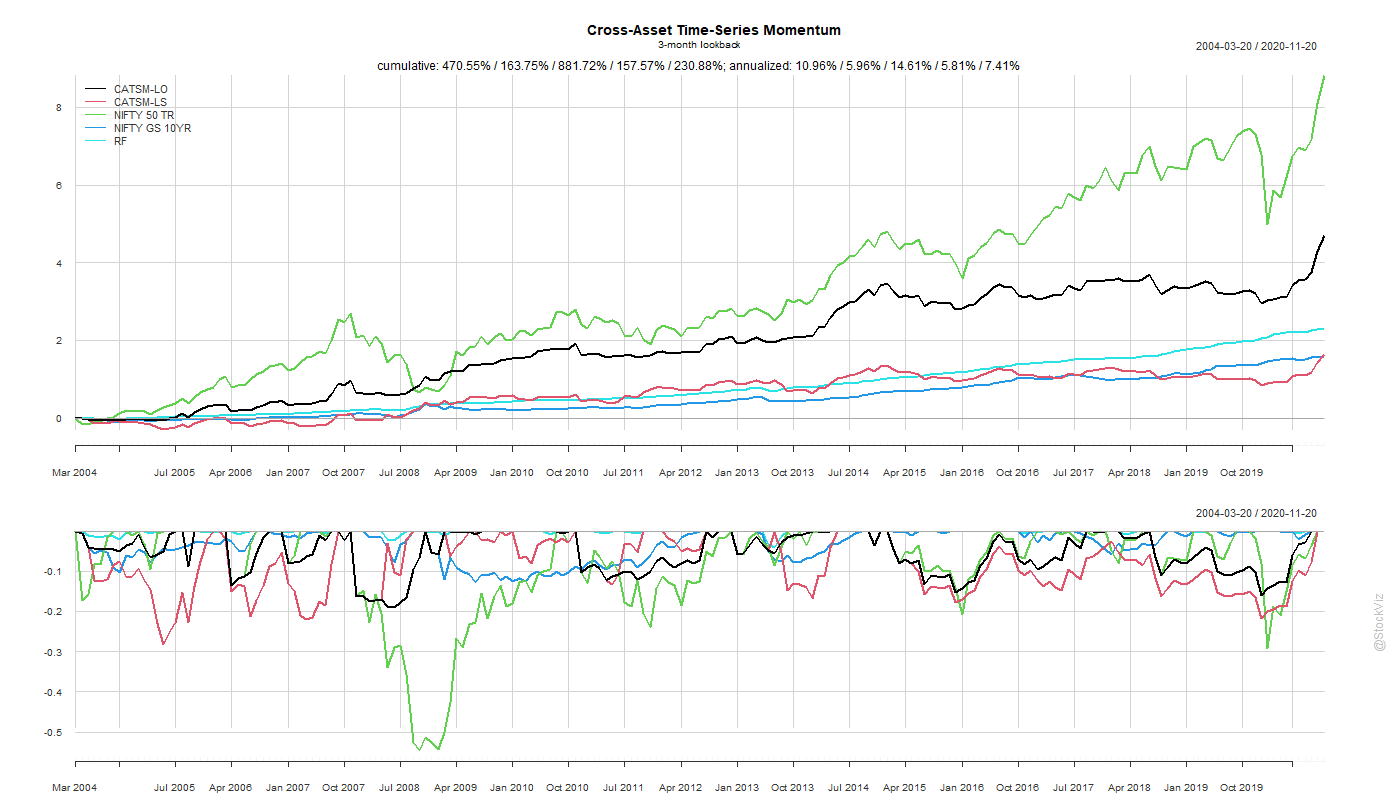
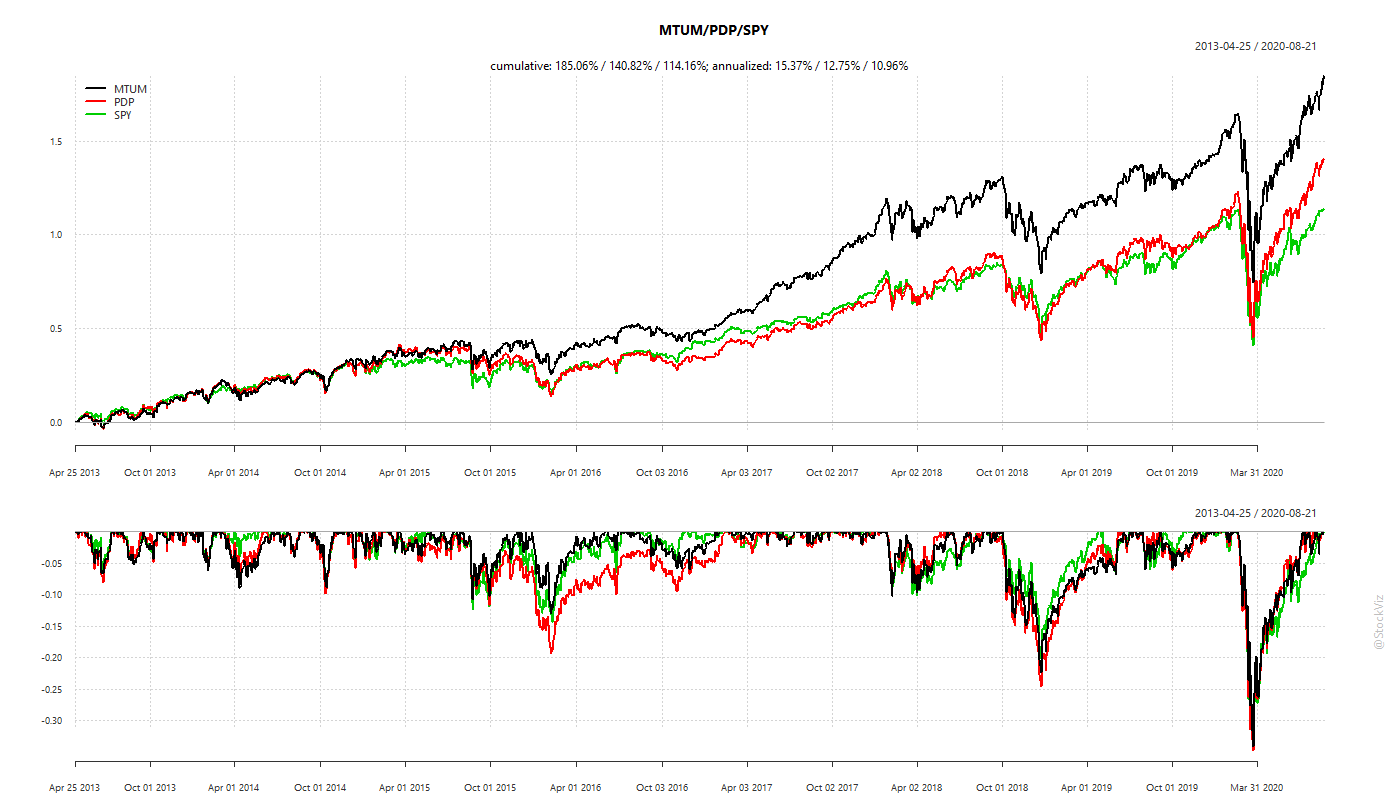
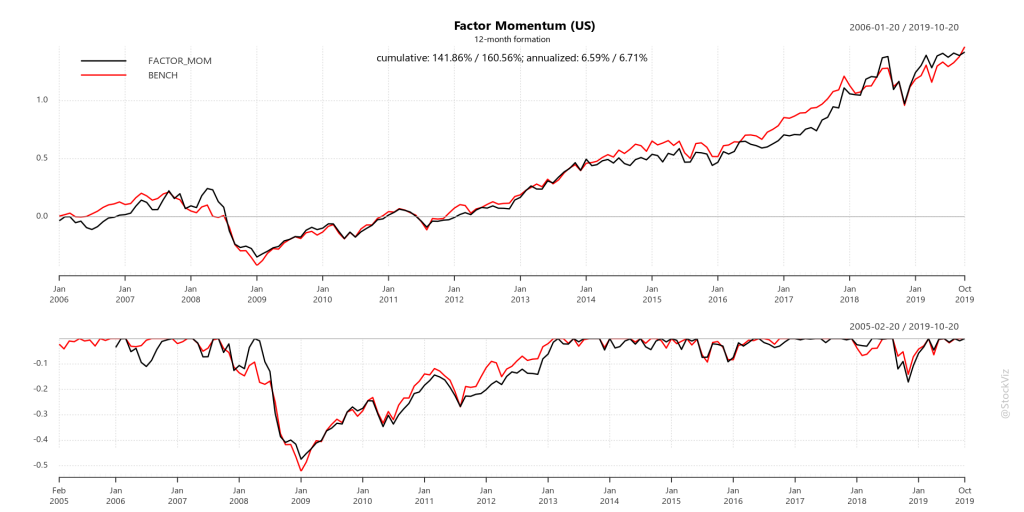
We have been running Momo portfolios for both Indian and US markets for a while and we do it for all three flavors of momentum: Relative, Velocity and Acceleration. We’ll get into the differences between these in later posts but irrespective of the flavor, the “container” within which they run are identical.
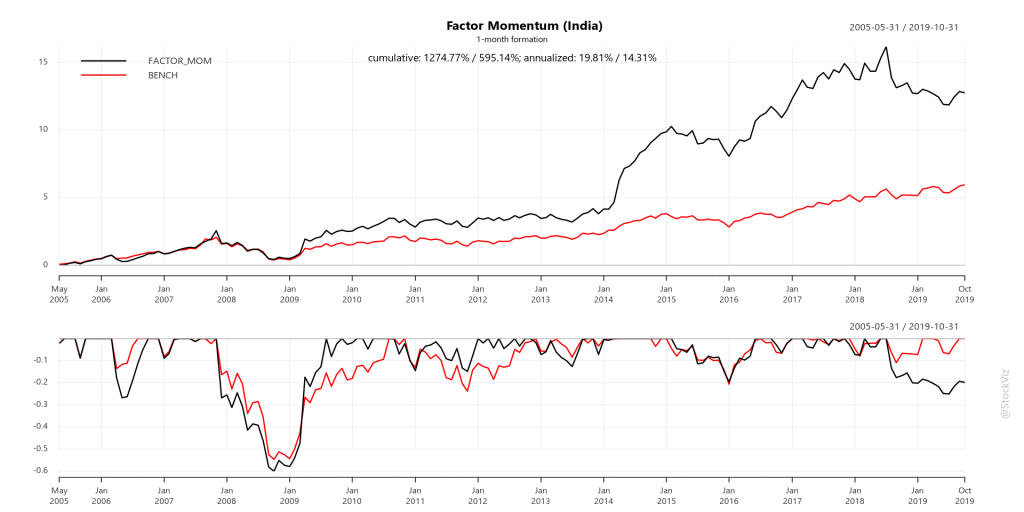
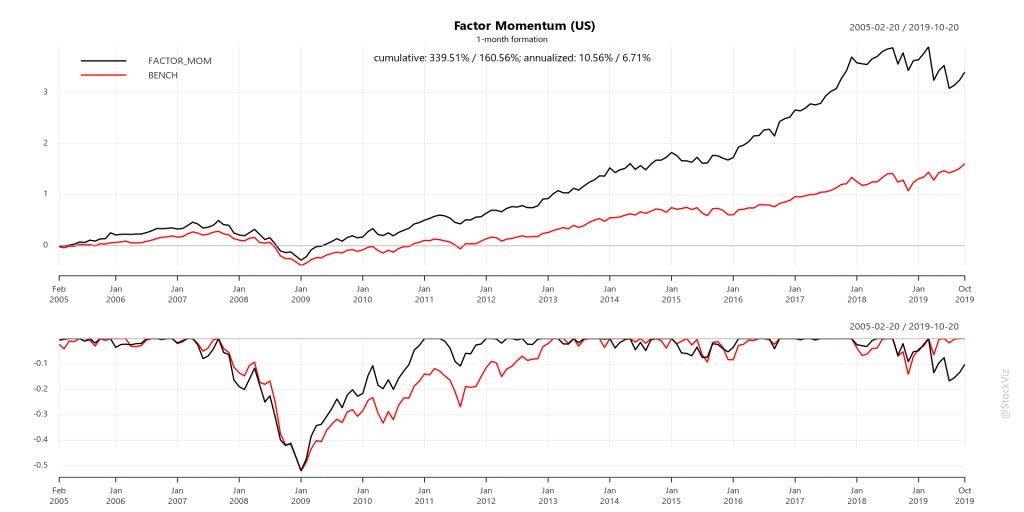
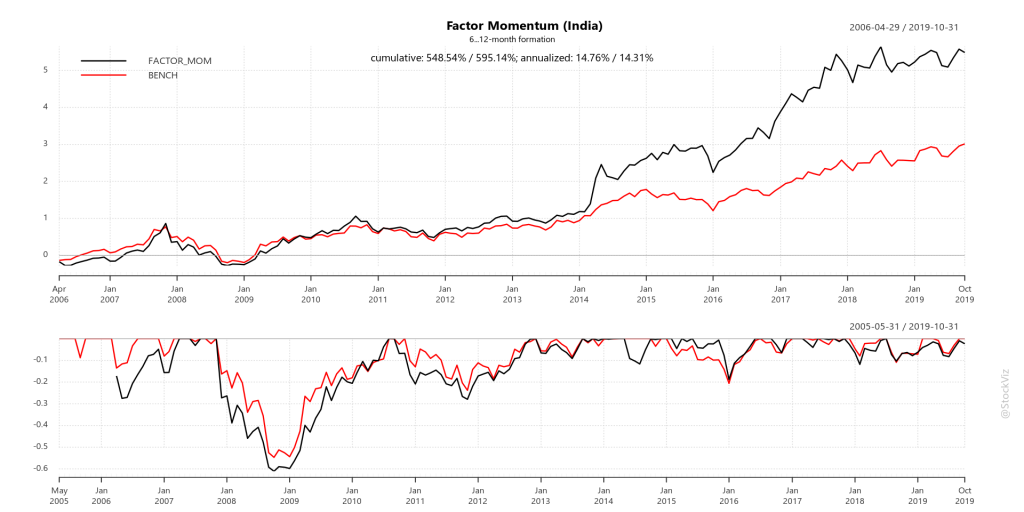
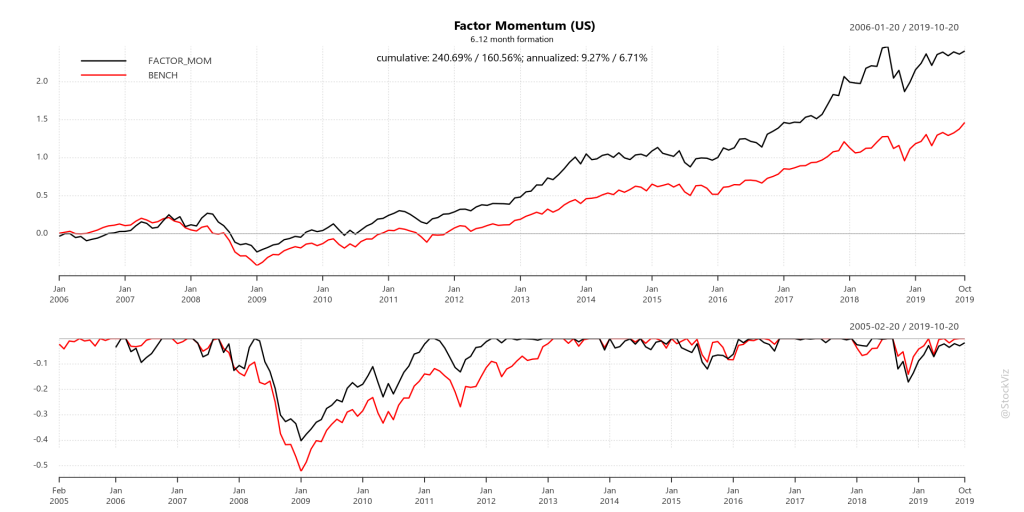
The flavors wax and wane depending on the market – there is really no way to quantifiably claim that one is better than the other. In terms of personal preference, I would rank Relative Momentum first, Velocity and then Acceleration. To keep things concise, we show Relative “Momo” Momentum performance below.
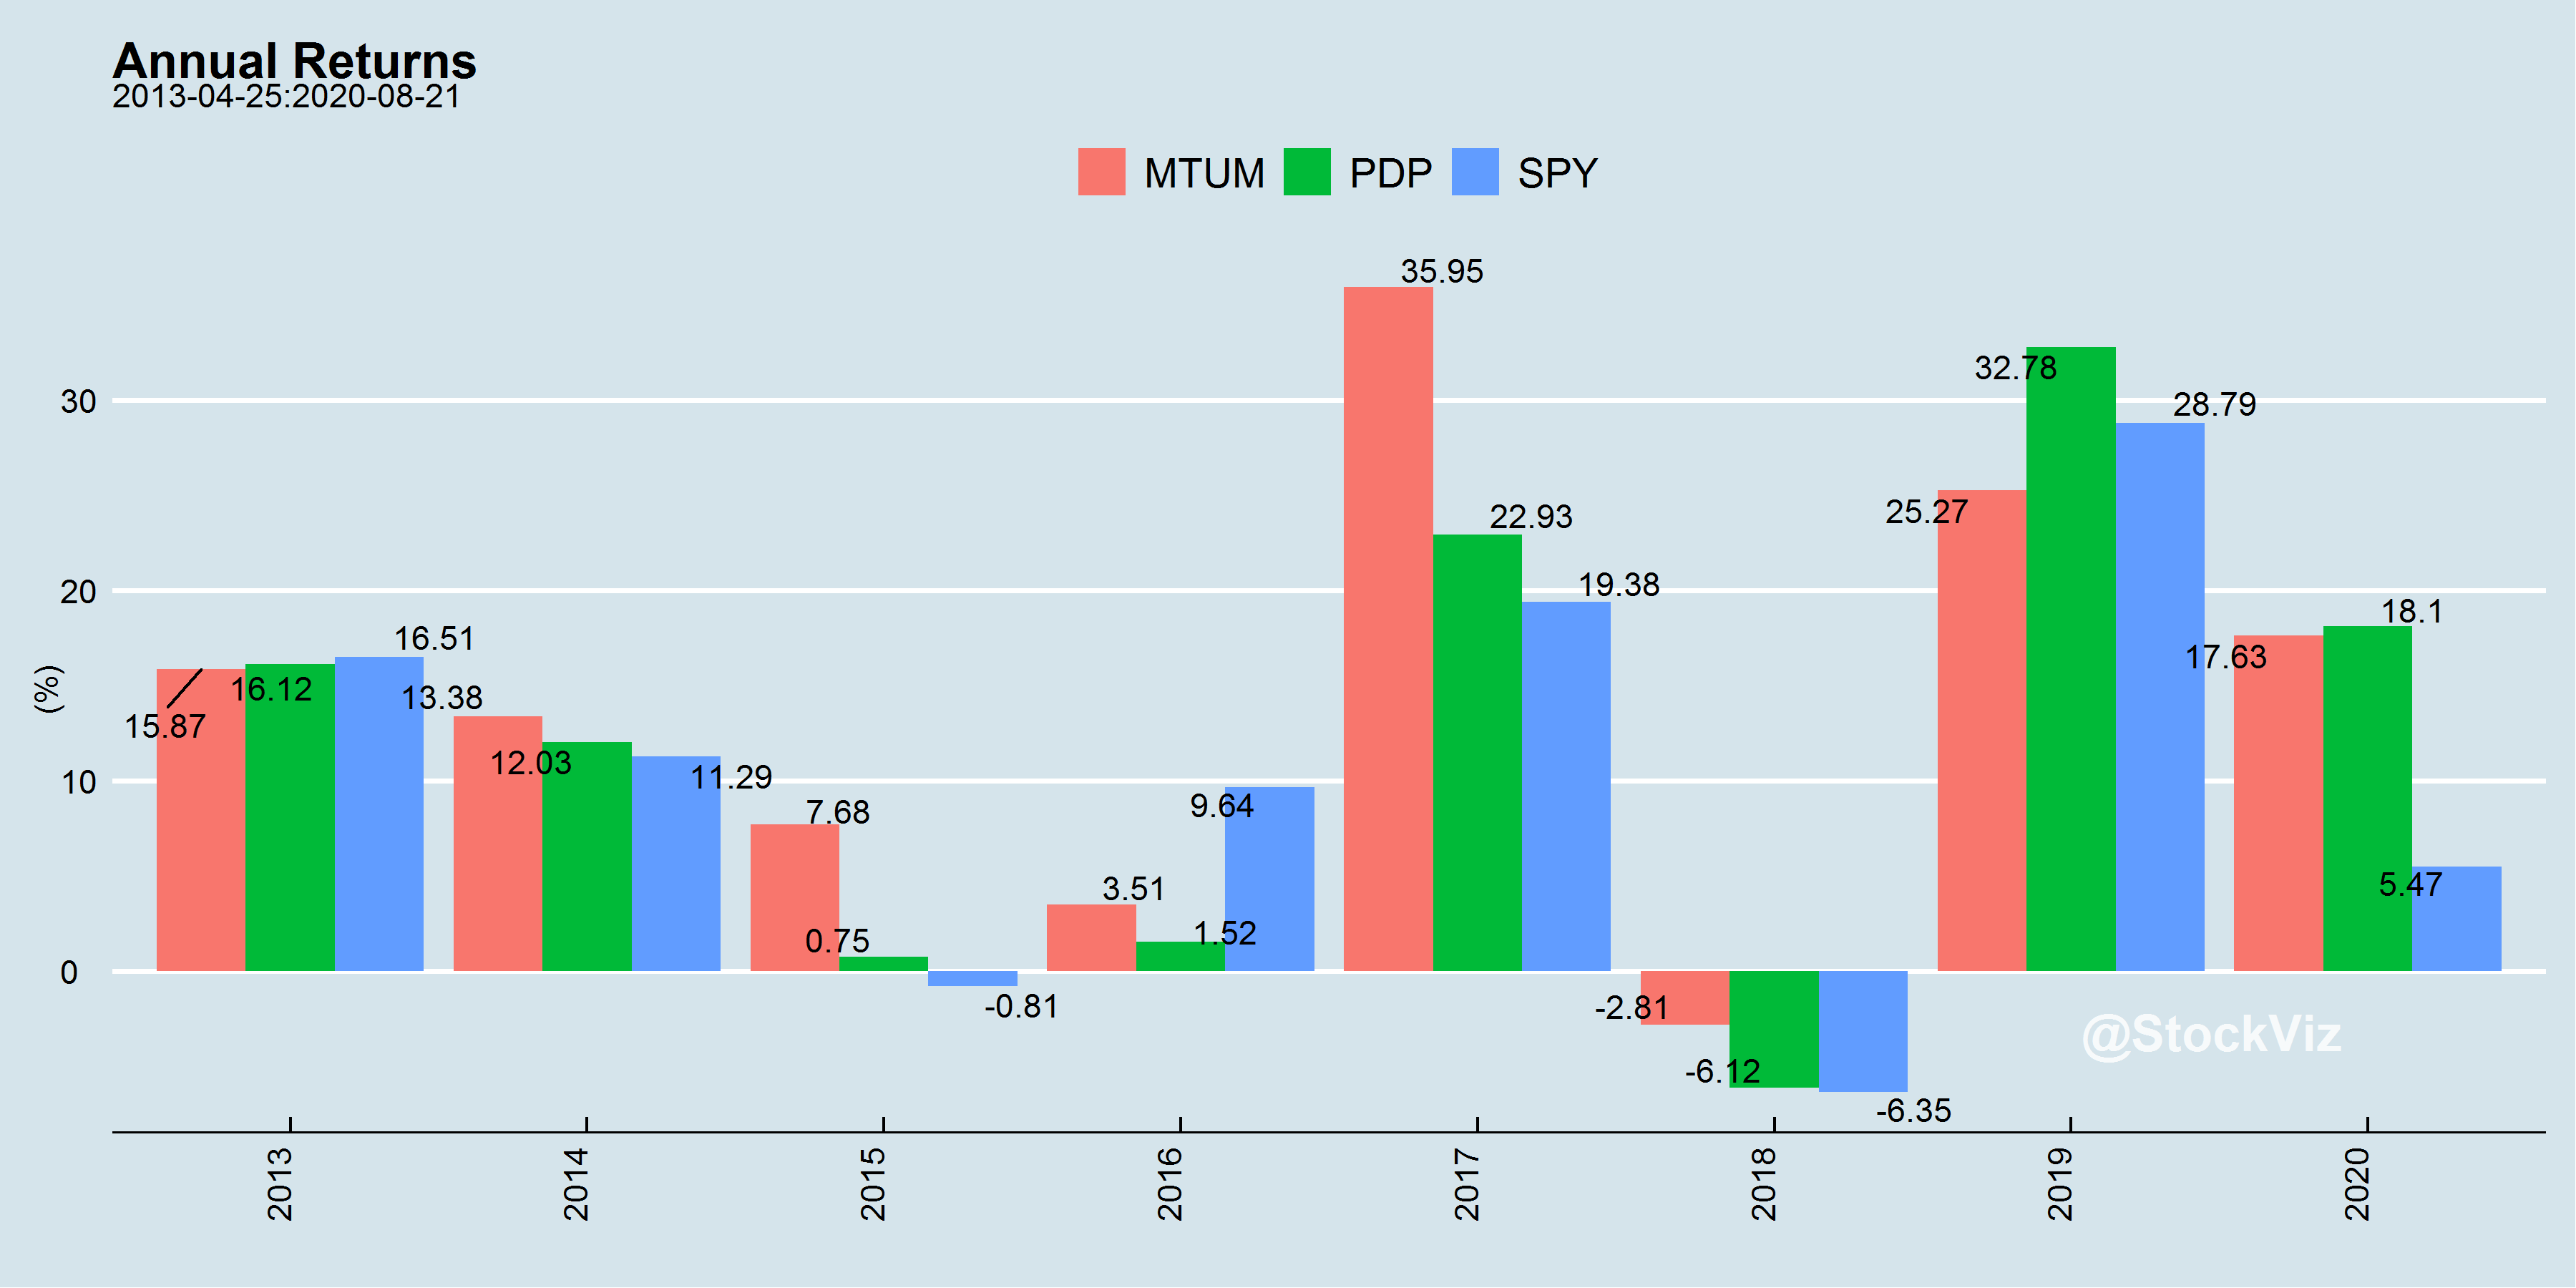
US Equities


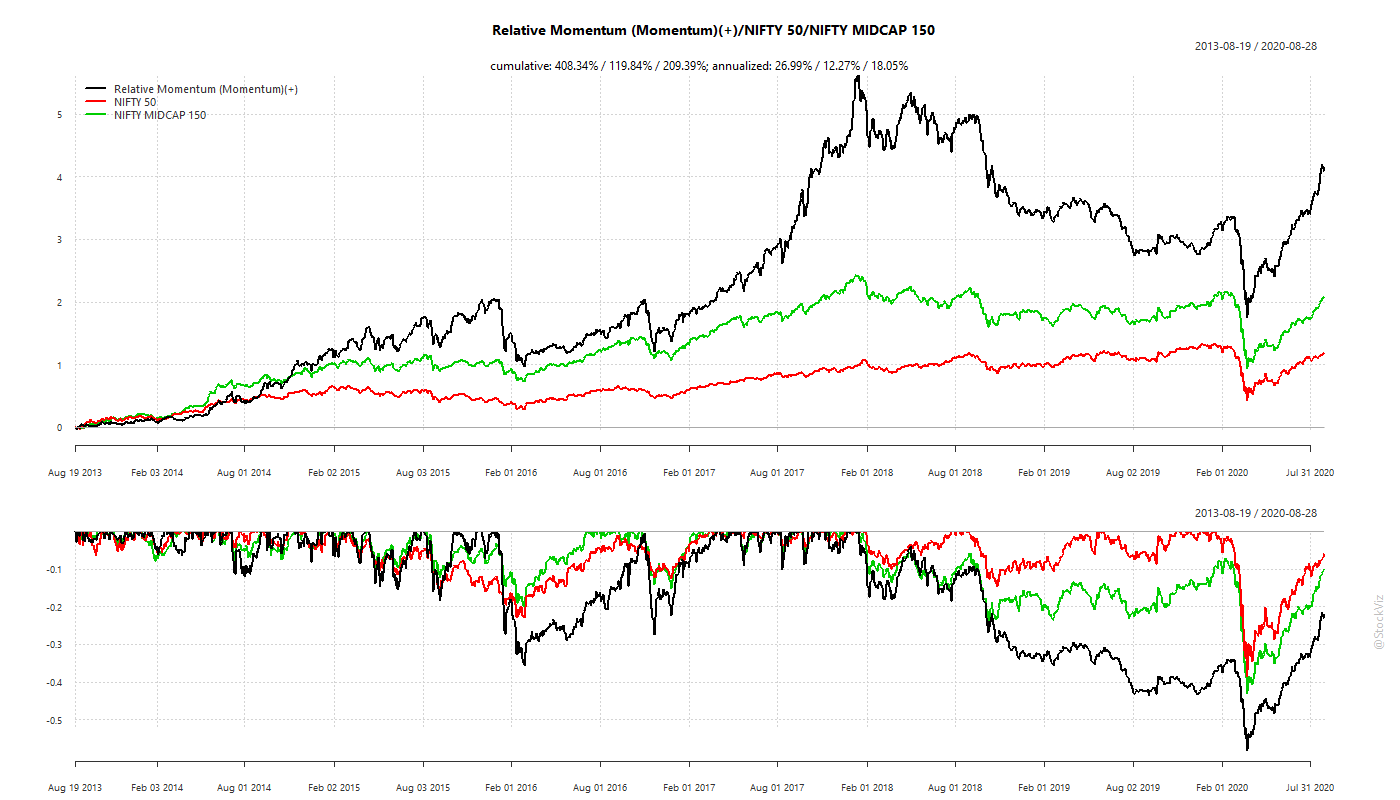
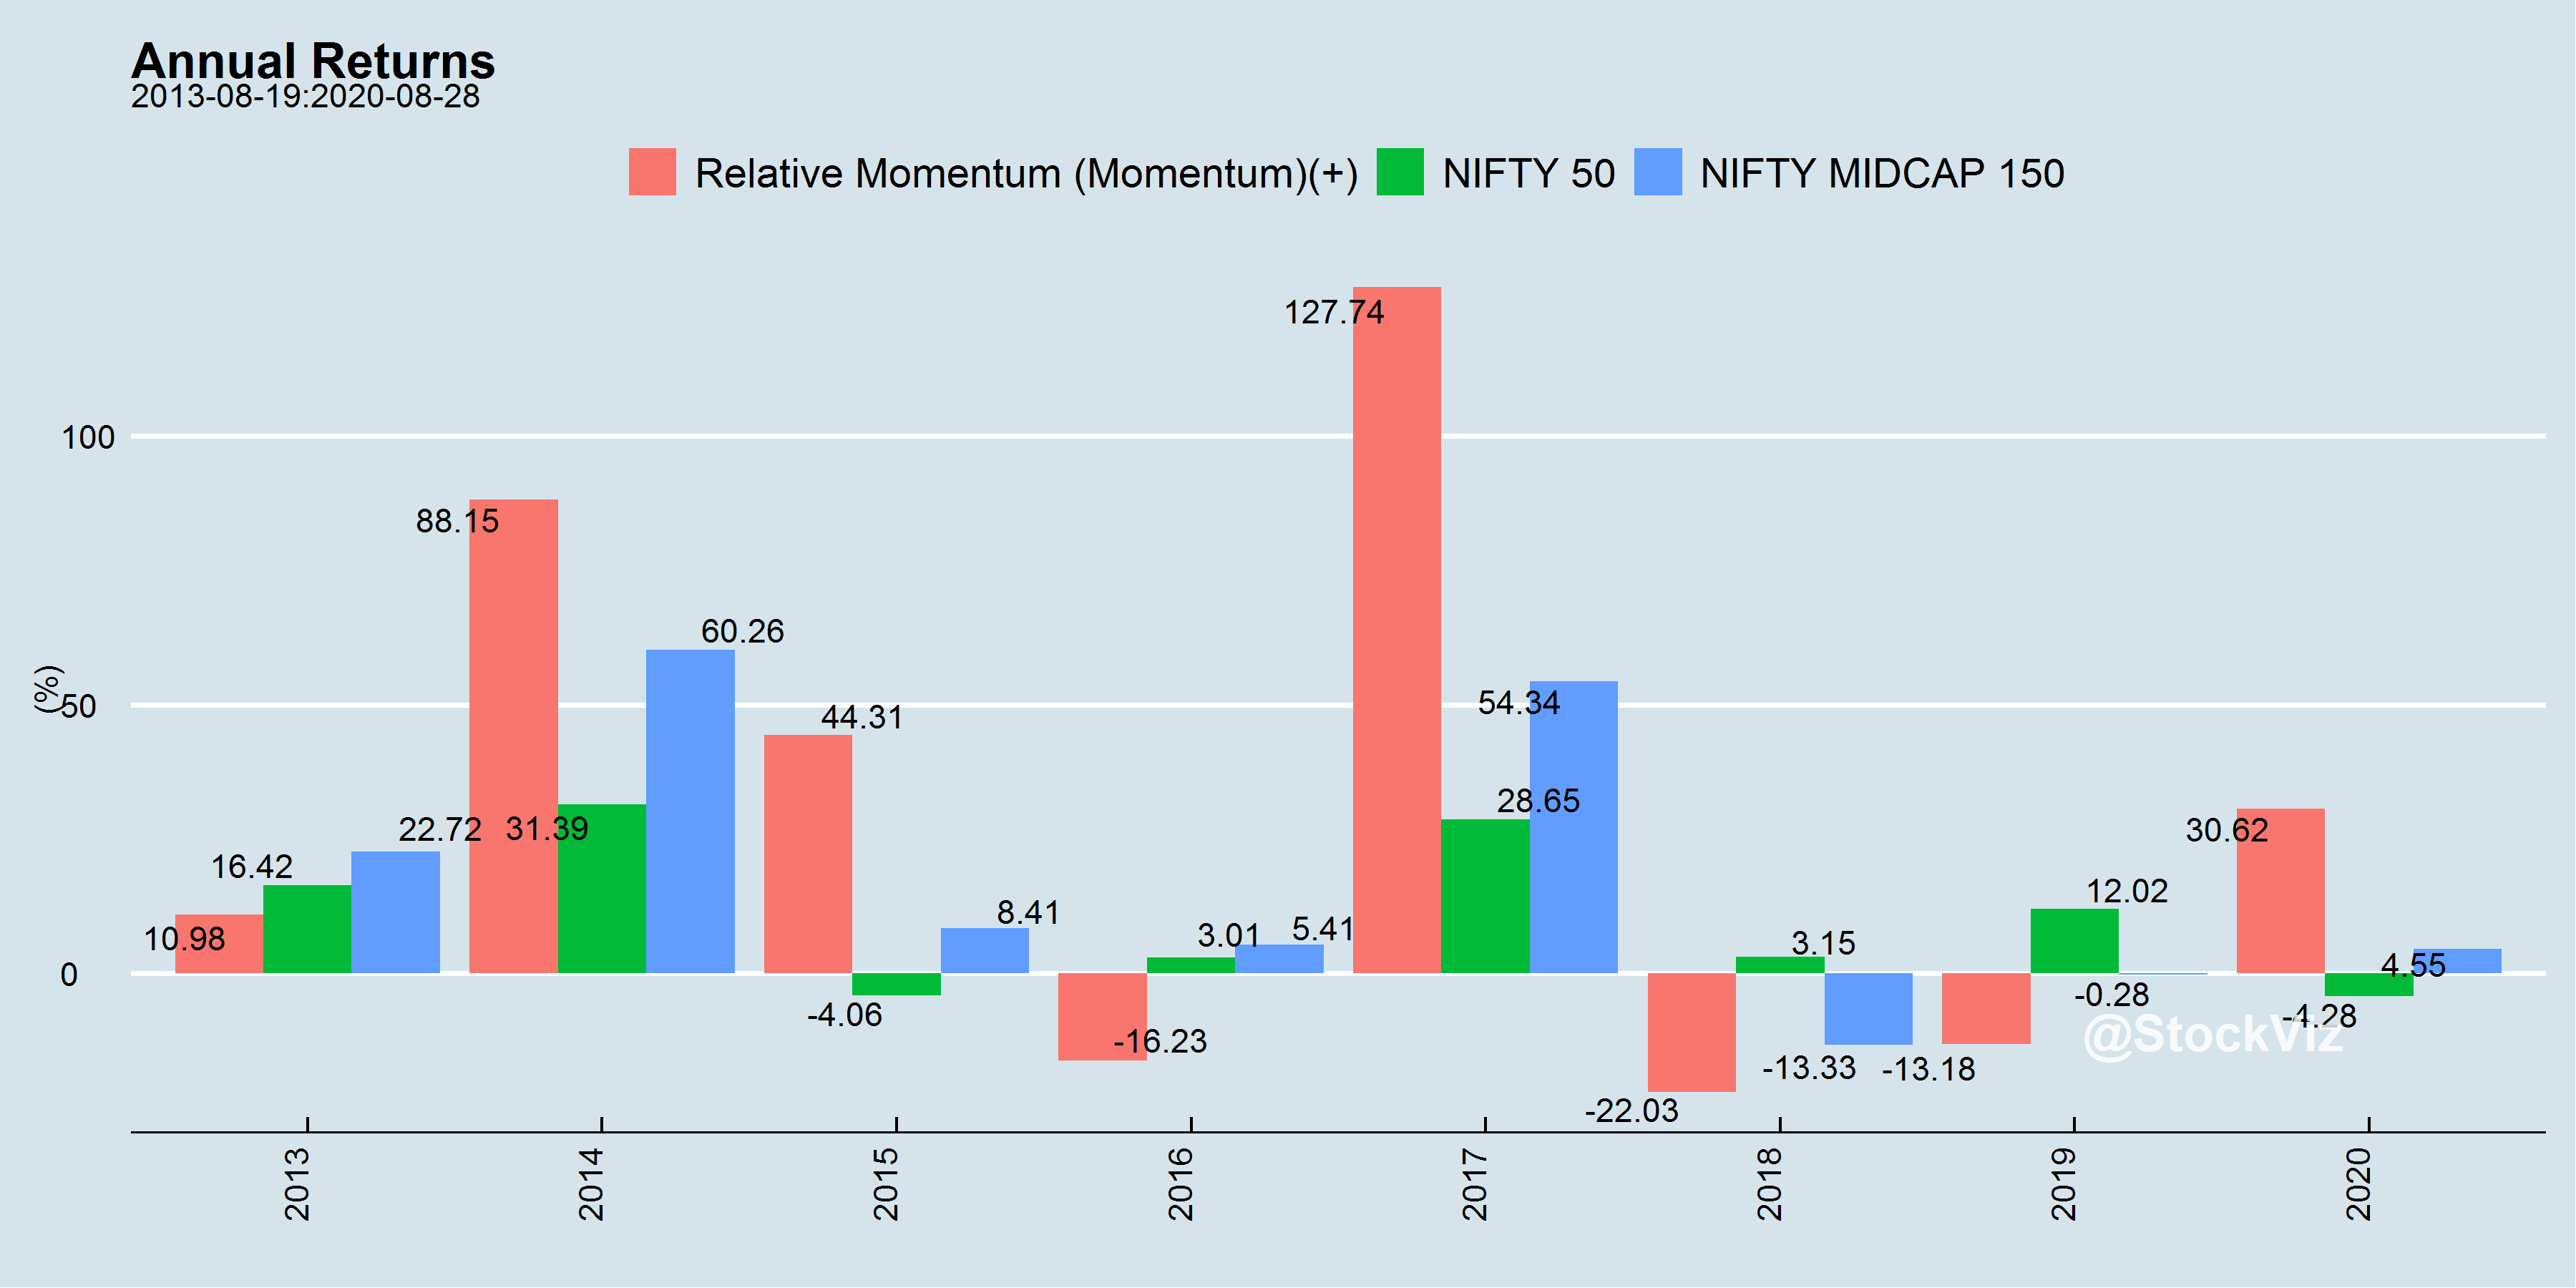
Indian Equities


Does It Scale?
When we discuss these strategies with professional fund managers, the most common question that comes up is “does it scale?”
And the answer is: No.
It doesn’t scale to professional break-even levels. For eg: for an Indian PMS to break-even, it at least needs Rs. 100 cr in AUM. There is no way the Indian Momos scale up to that level.
But it really doesn’t matter to you, the retail investor. Remember: professional investors are driving a bus, you need not.
Trade-Offs
The market abhors a free lunch. So the next questions is: “What are the trade-offs?”
Risk management is not free. There are always trading costs/taxes that affect the final outcome. But the known-knowns are factored into the performance metrics shown above.
Execution lags. There is always a delay between when the trades are triggered and when the execution takes place. This can be narrowed down by automation to a de minimis.
Compliance. There could be employer, broker or regulator imposed limits on how frequently positions can be churned in certain accounts. Momos would be a poor fit in these circumstances given that any deviation from the model triggered trades can lead to substantial deviation in performance.
Next Steps
If you decide that taking the bus is not for you, then we can help. Have a look at the Momo strategies linked below and let us know if you are interested. We are here to help.
US Momos
Indian Momos
Check out our completely automated strategies: stockviz.biz/themes
Investing in the US? We got you covered on us.stockviz.biz/themes