Tag: momentum

MAD – Moving Average Distance

Sometimes, a research paper comes along that gives academic rigor to an obvious thing that trend-followers were doing for decades and makes you sit up and take notice. Moving Average Distance as a Predictor of Equity Returns, Avramov, Kaplanski and Subrahmanyam (SSRN) does just that.

Turns out, a simple moving average crossover signal proves robust to momentum, 52-week highs, profitability, and other prominent anomalies.

A later paper extends it to international stocks and finds similar results (SSRN).

A quick backtest shows that it works for Indian stocks as well.
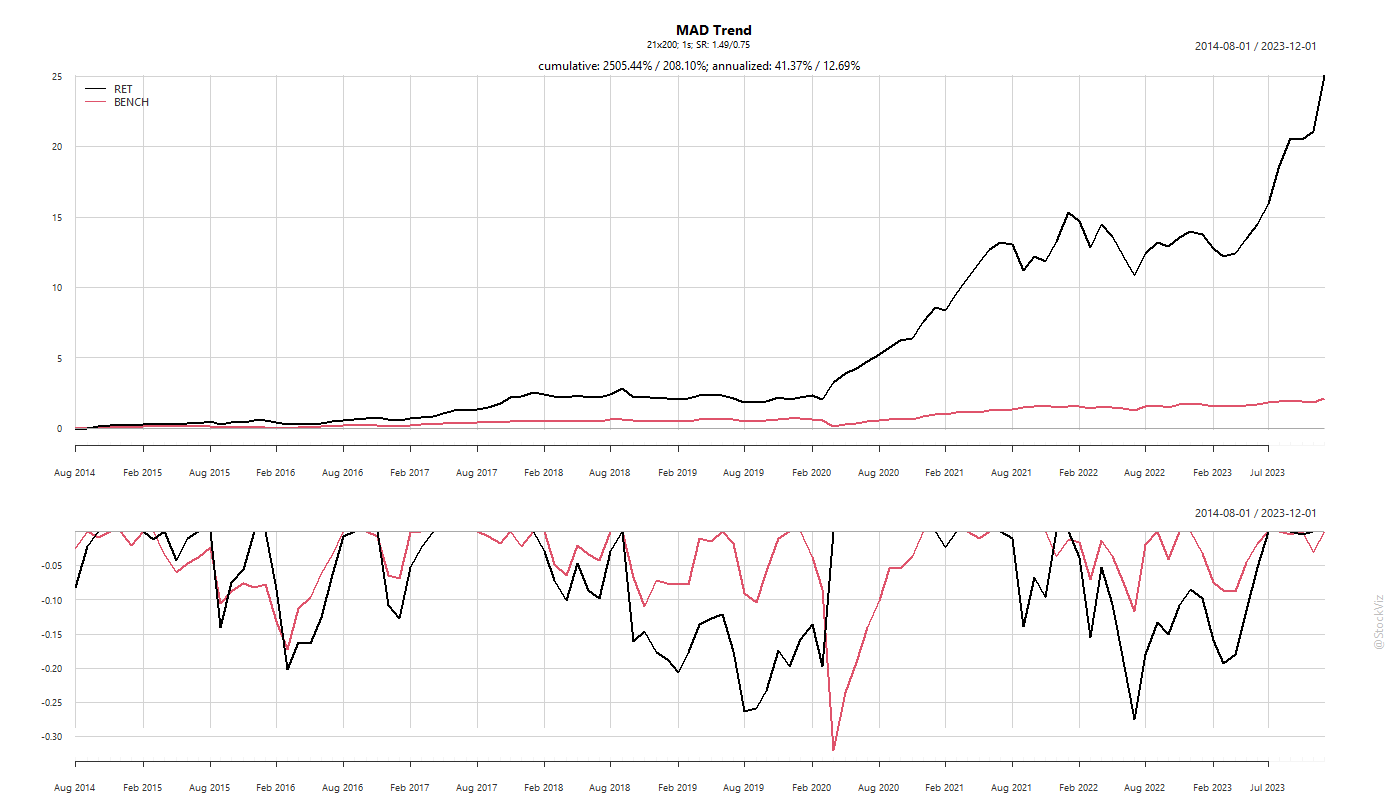
It looks like COVID turbo-charged this strategy. The pre-COVID equity curve is saner.

The returns are good but it comes with some nasty drawdowns. Not sure if most investors can stomach a 25% drawdown that lasts over a year. Can it be made better by applying a volatility filter?

By sacrificing 2 points of returns, you can get to a sub 20% drawdown. Also, the filter worked during the most recent 2021-23 drawdown as well.

You can follow along the live version of this strategy here: MAD 21/200

Code and charts on github.

Daily Momentum

Daily Momentum and New Investors in an Emerging Stock Market (SSRN) describes the trading behavior of Chinese retail investors.

Our study finds that daily returns, instead of monthly returns, display price momentum and attributes it to the trading behaviors of new investors using account-level transaction data.

Apparently, most new entrants to the market in China take a very short-term punt on whatever worked on the day. They go on to study a bunch of DM and EM markets and its worth a read.

The interesting bit is that Indian investors don’t chase daily momentum. In fact, for an equal-weighted “buy the best performing quintile and hold till tomorrow’s close” strategy, after transaction costs and taxes, there’s nothing left, on average.

The median average next-day return of the 5th quintile (highest return) is 0.30%, before slippage.

Also, buying the worst performers did no better either.

Hedging Momos

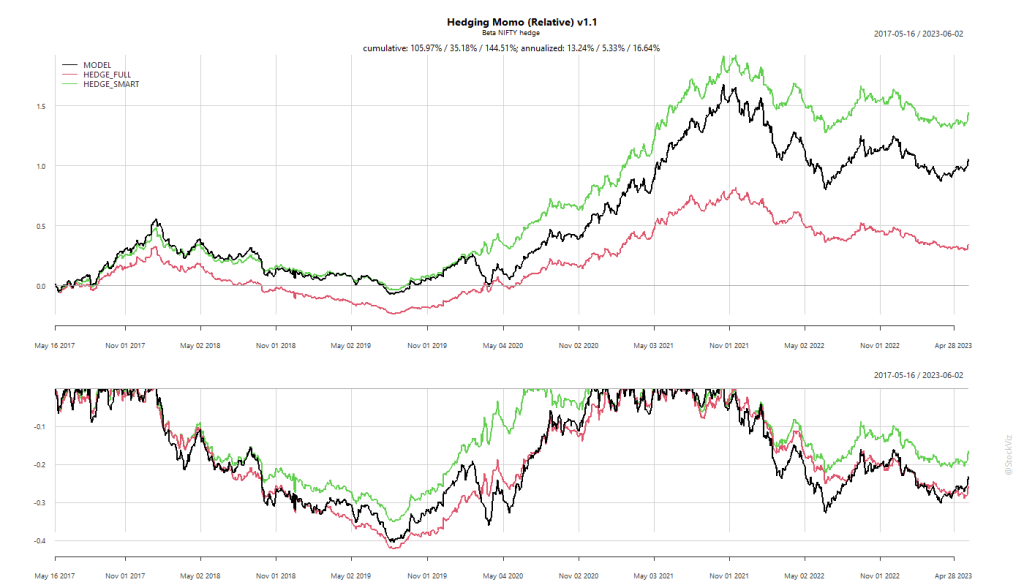
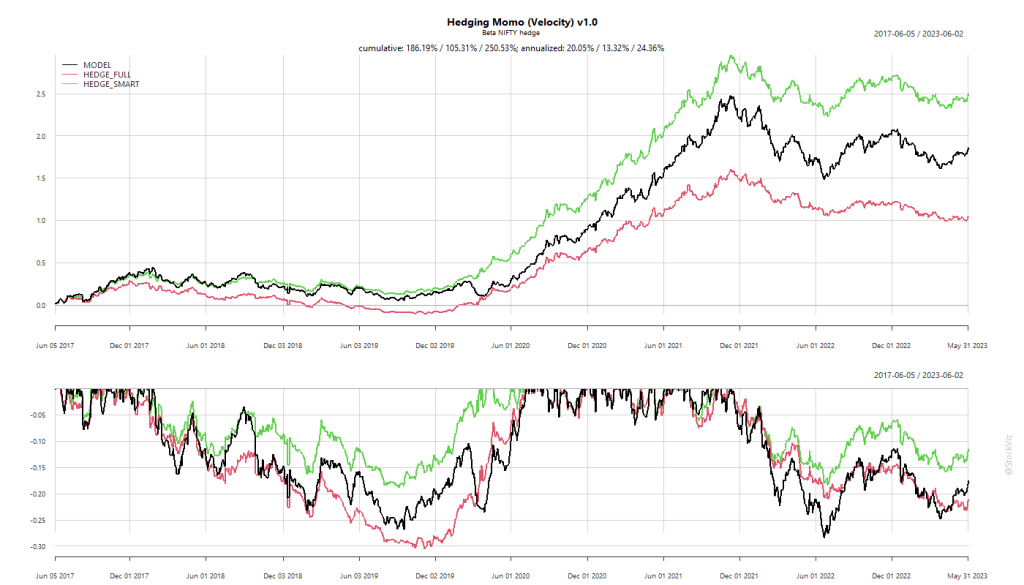
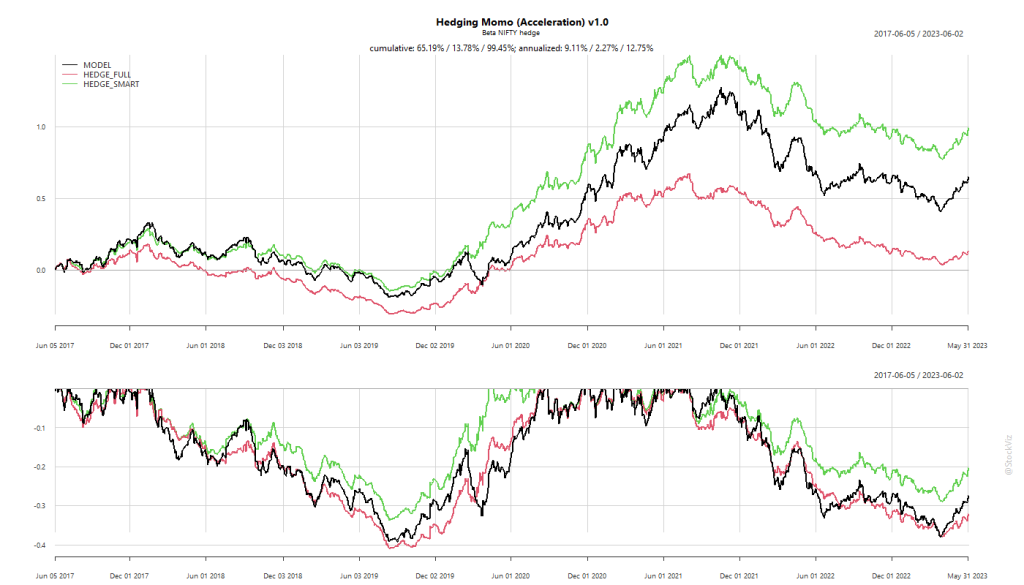
Previously, we discussed how momentum itself trends and how that can be used to manage risk. Using simple moving averages showed promise when it came to some versions of our slow momentum models (see Trending Momentum Models). However, given the faster turnover of our Momos, it wasn’t a suitable approach (see Trending Momo Models).

What if we shorted the NIFTY to hedge against market-risk instead?

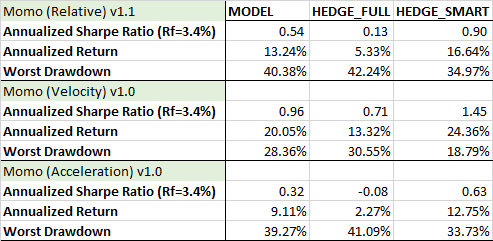
The naïve approach, tagged “HEDGE_FULL” above, shorts the NIFTY in proportion to the rolling beta of the strategy. Turns out, this is a very sub-optimal way to go about it. Hence “HEDGE_SMART”, that tries to minimize the basis risk inherent in this approach, adds about 3-4% to the strategy’s returns (likely eaten away by transaction costs & taxes) and reduces the max-drawdown by a significant amount.

The question is whether the benefit of lower drawdowns is worth the added cost and complexity? In the case of Velocity, it could be.

Related:

Momentum Portfolio Size

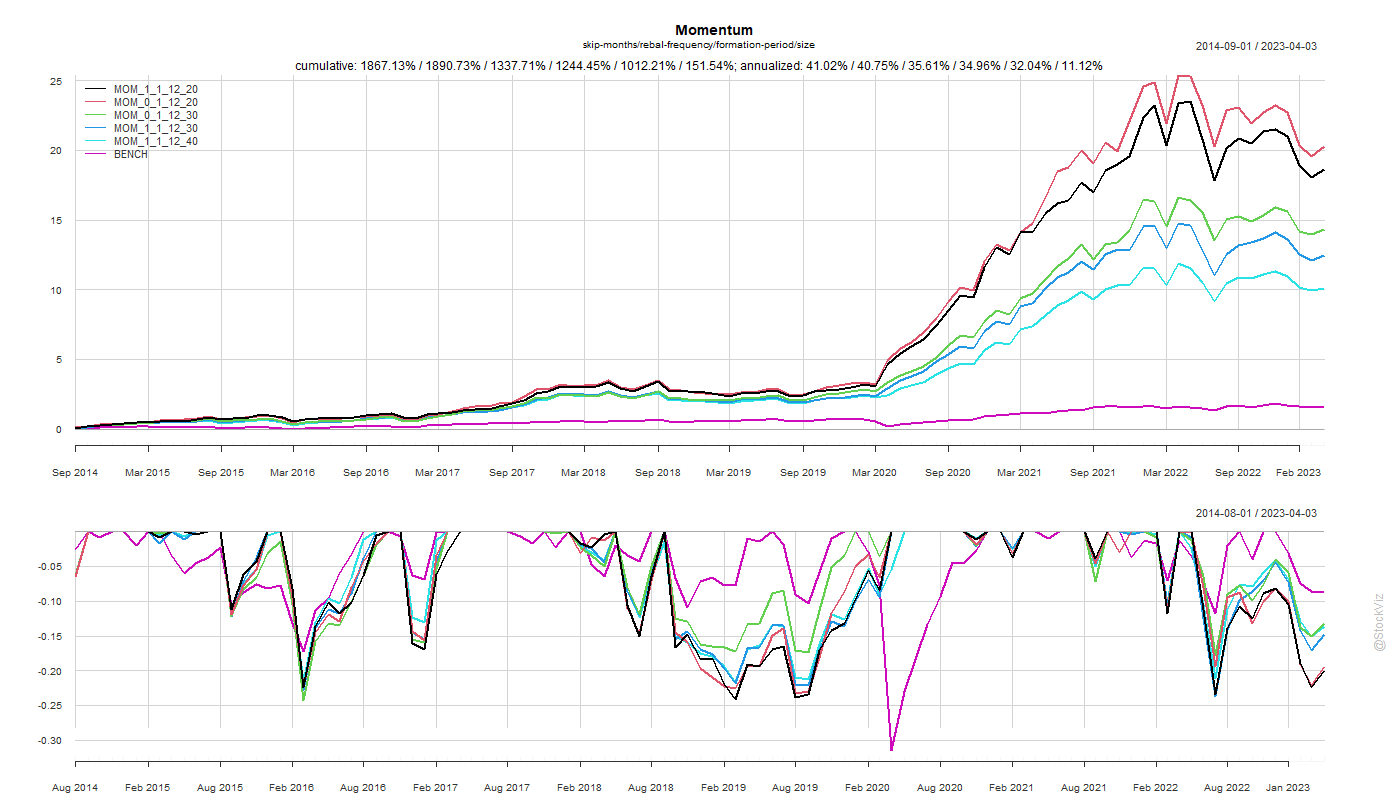
Previously, we looked at skip-months, rebalance frequencies and formation periods for momentum portfolios. A 1-month skip & monthly rebalance turned out to be ideal. However, the most popular 12-month formation period is “magic” – not a terrible choice but not super scientific either. The only thing left to toggle is the portfolio size.

A 20-stock momentum portfolio seems to be the ideal config.

This is pretty much the standard direct-equity momentum portfolio: 12-month formation, 1-month skip, 20-stocks with a monthly rebalance.

Code and chart on github.

Momentum Formation Period

Previously, we looked at skip-months and rebalance frequencies for momentum portfolios. A 1-month skip & monthly rebalance turned out to be ideal. However, we did these analyses keeping the formation period the same at 12-months. What if we changed that as well?

Turns out, there is no single “ideal” formation period where all stats converge. However, if set the rebalance frequency to 1-month, the average of the formation periods of the top performing portfolios works out to 12-months.

If the momentum fund is large enough, then it could probably be sliced into multiple sub-portfolios, each with different configs to avoid this magic 12-month formation.

Also, since the underlying process creating these portfolios is the same, the equity curves come out all bunched together. There maybe differences in month-over-month performances but they are all highly correlated.

Code, charts and statistics on github.