The standard deviation over 200-days and future 20-day returns from 2010 through 2015 of NIFTY MIDCAP150 MOMENTUM 50 TR and NIFTY200 MOMENTUM 30 TR looks like this:
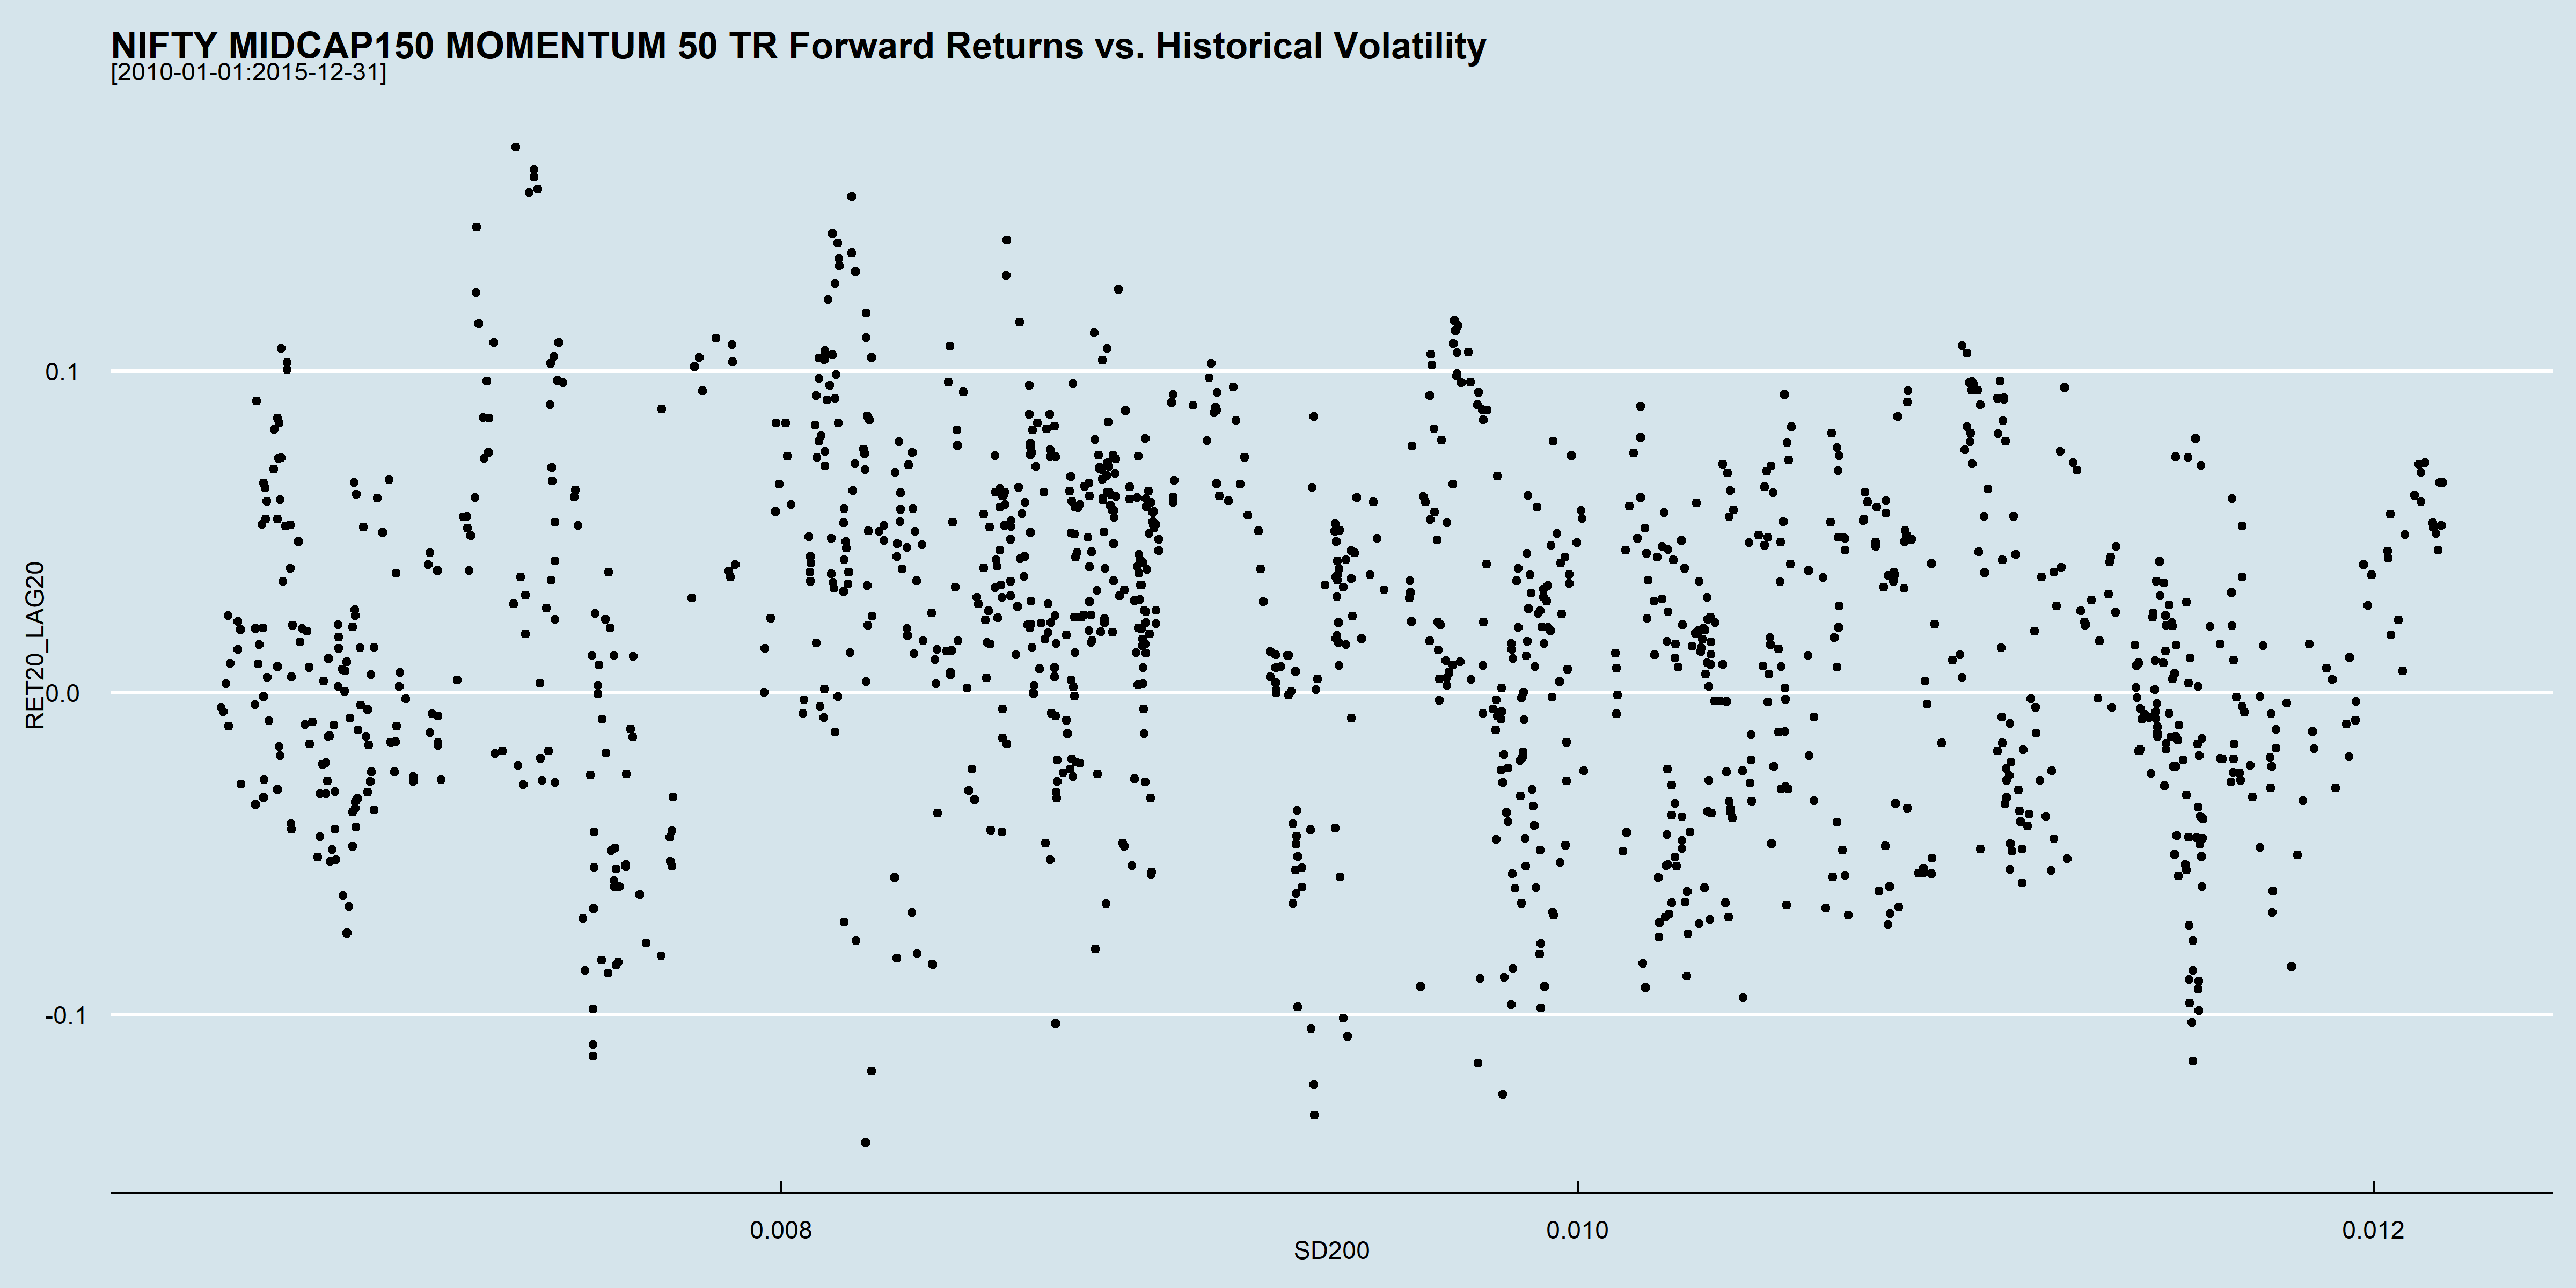
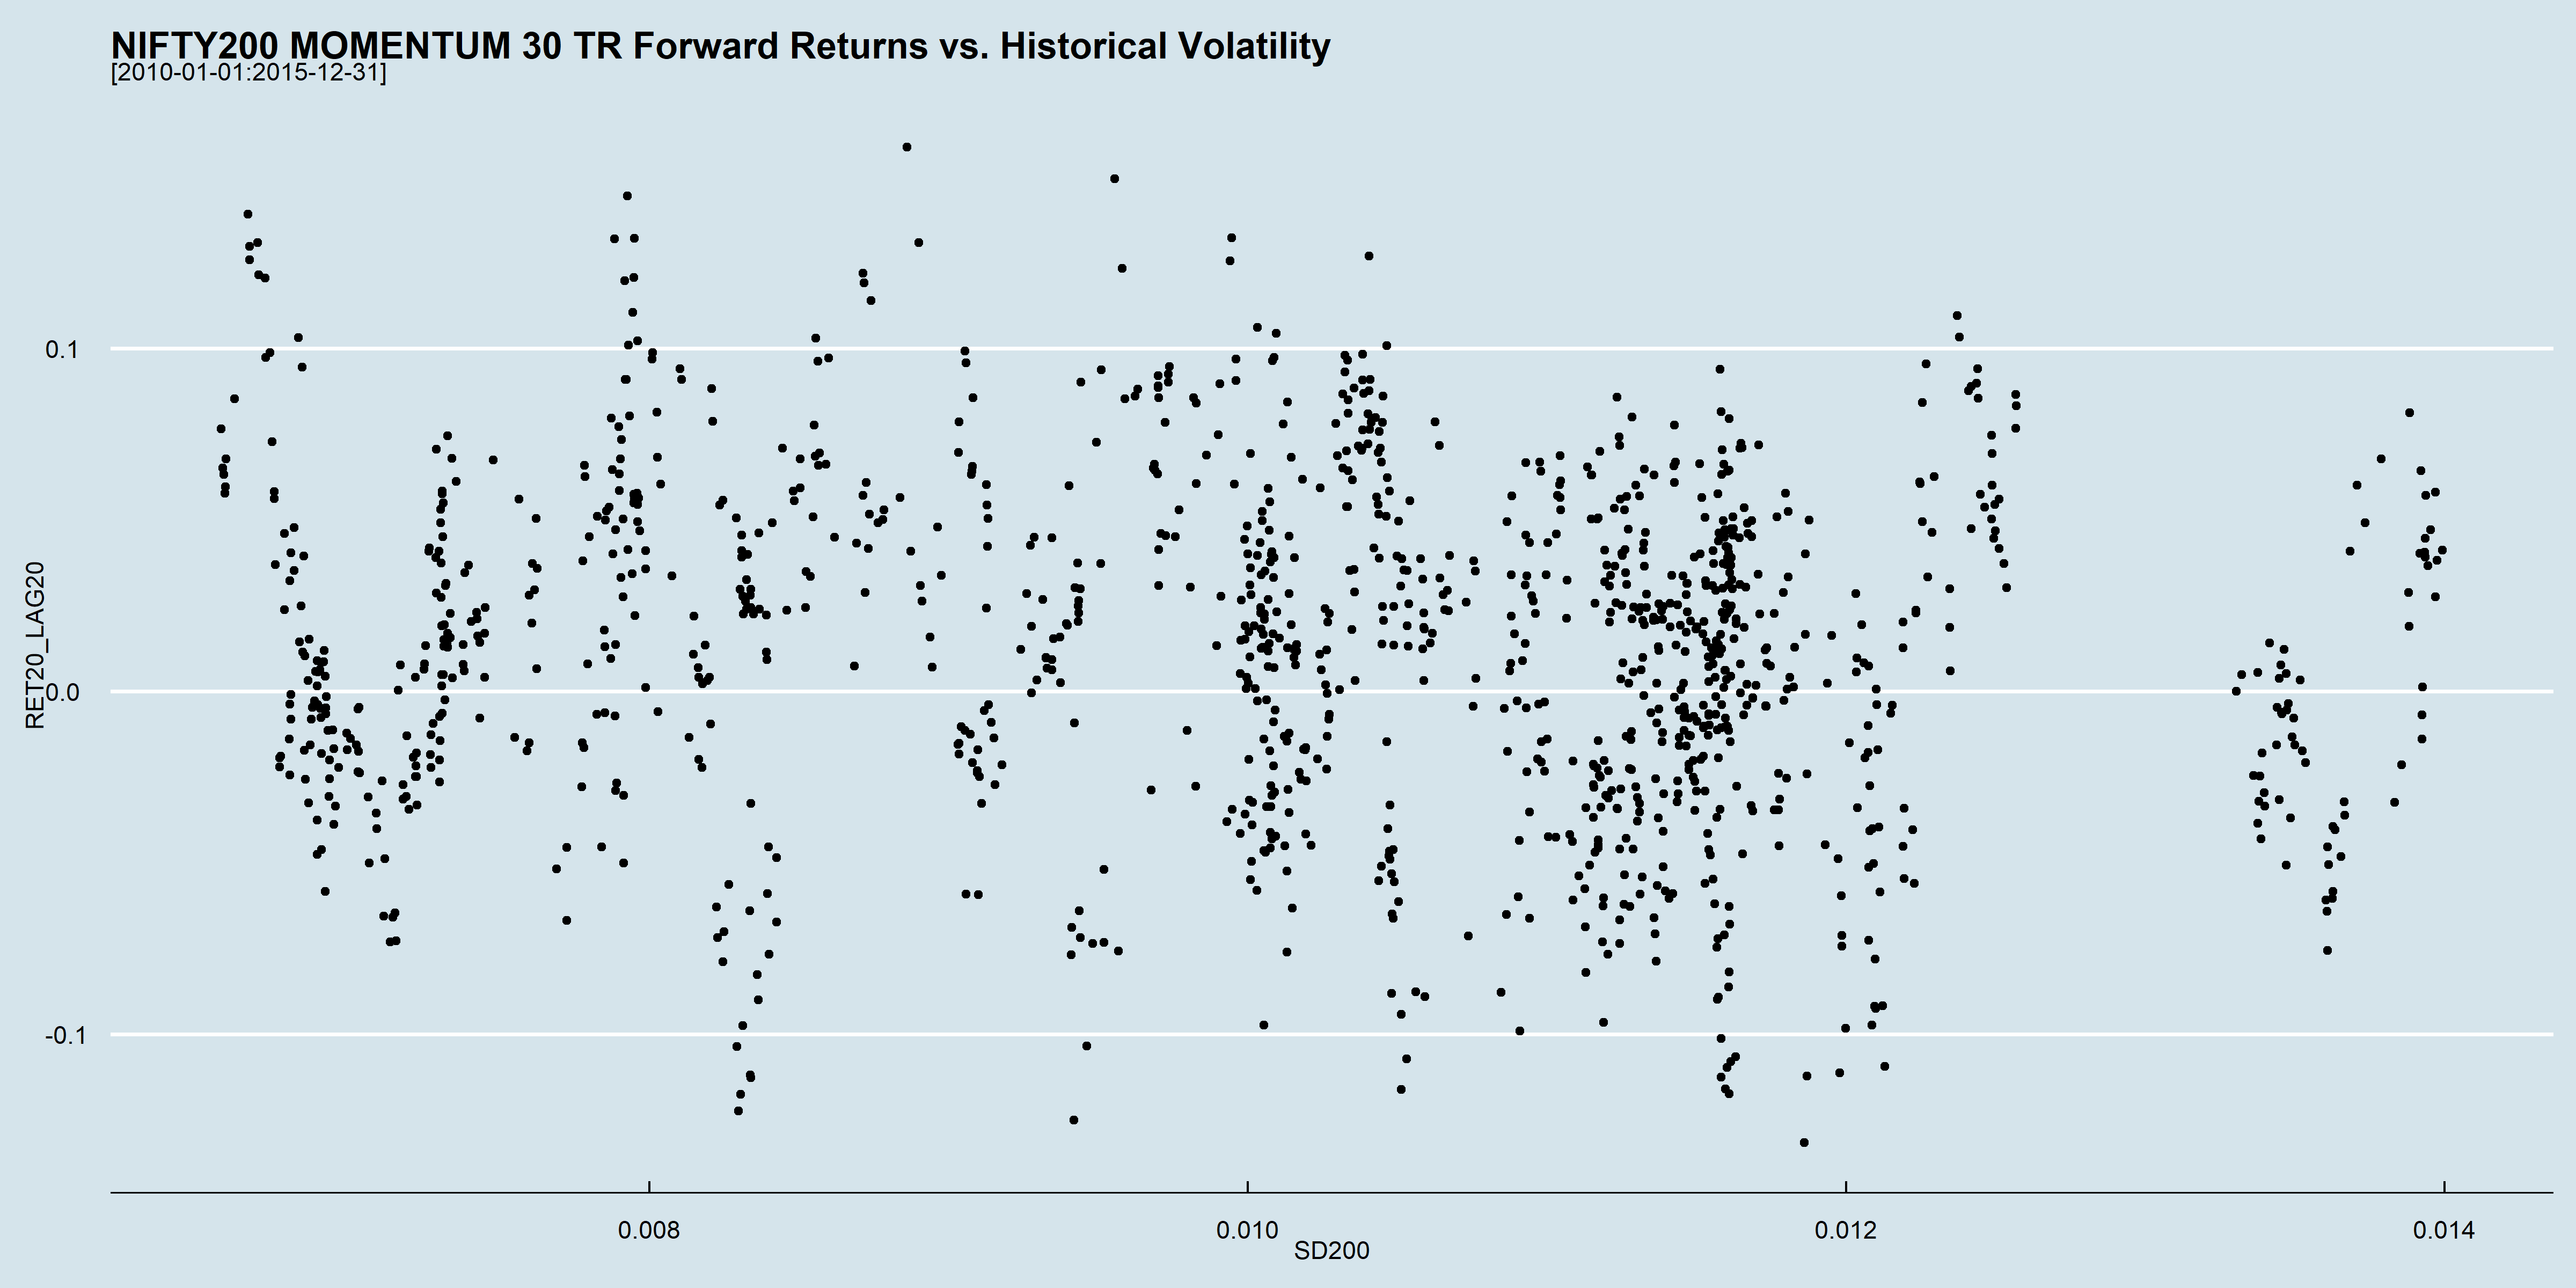
Can historical volatility, as measured by standard deviation, be used to enter and exit momentum strategies?
On a rolling basis, there doesn’t seem to be a strong correlation between historical volatility and future returns. Back-tests over this period might give you a config that might look like it works but it is probably a fluke.
Given that liquid ETFs for these indices are not available and we are stuck with index funds for the foreseeable future, we setup a back-test to calculate the 200-day std. dev. at the end of each month to decide whether to hold it for the next month. Needless to say, the results were pretty lackluster.
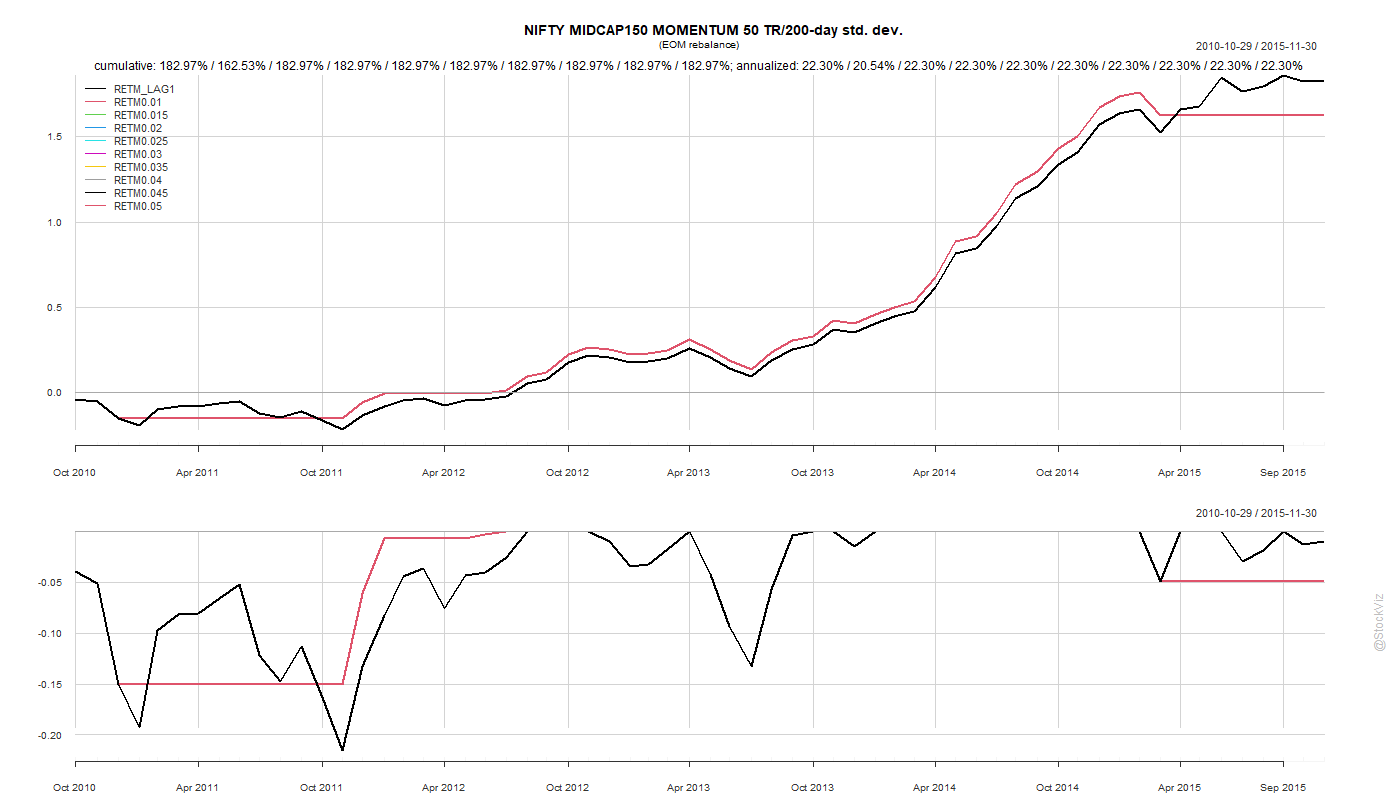
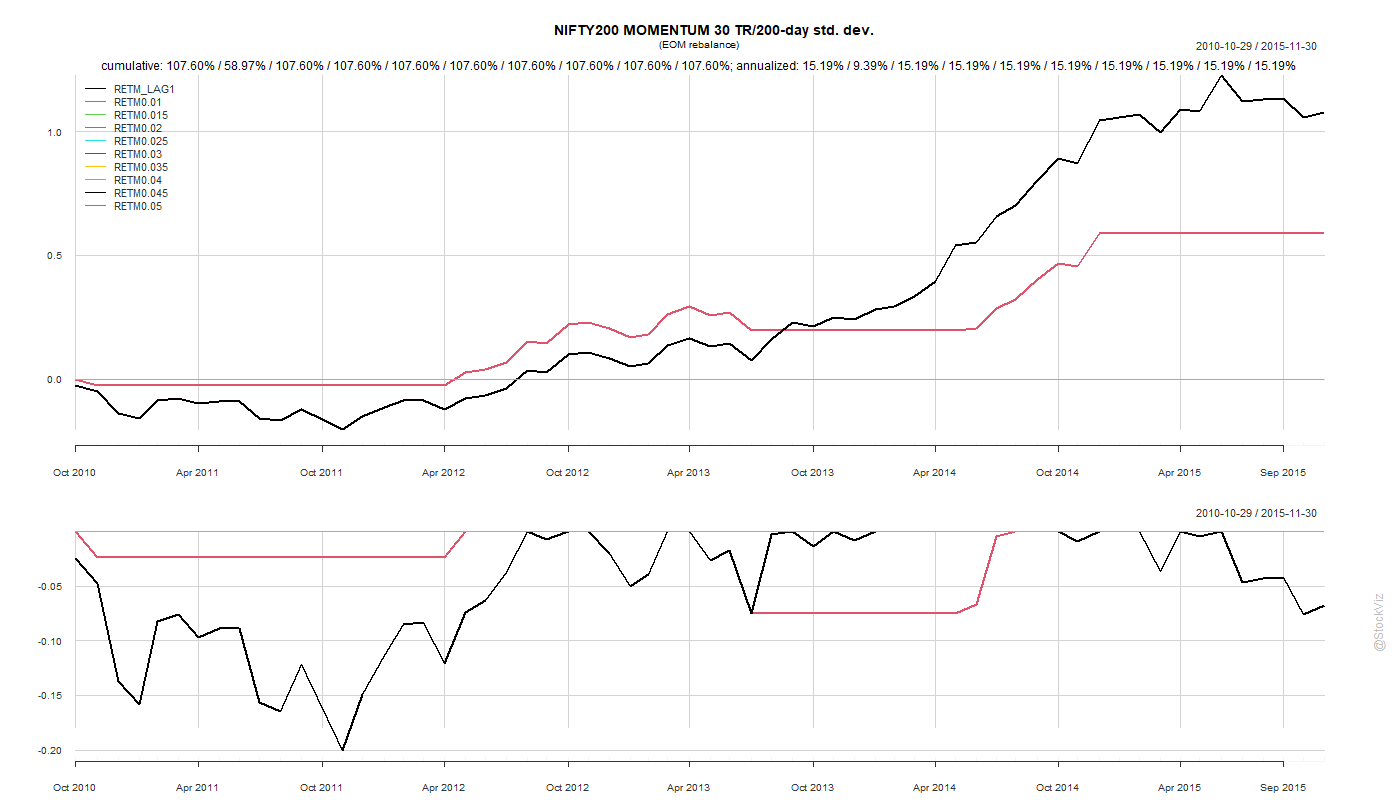
We chose the 2010-2015 period because it avoids the 2008 crash and the subsequent recovery. The back-tests look phenomenal when you include that data but we wanted to see how such a strategy would perform in “normal” markets before stress-testing it. We don’t want to be the generals always fighting the last war.
Code & charts: github
Related:
- Reducing Crash Risk in the Nifty Alpha Indices
- Low Volatility: Stock vs. Portfolio
- VIX and Equity Index Returns Part I, Part II