Tag: momentum

Index Update 17.10.2015

MOMENTUM

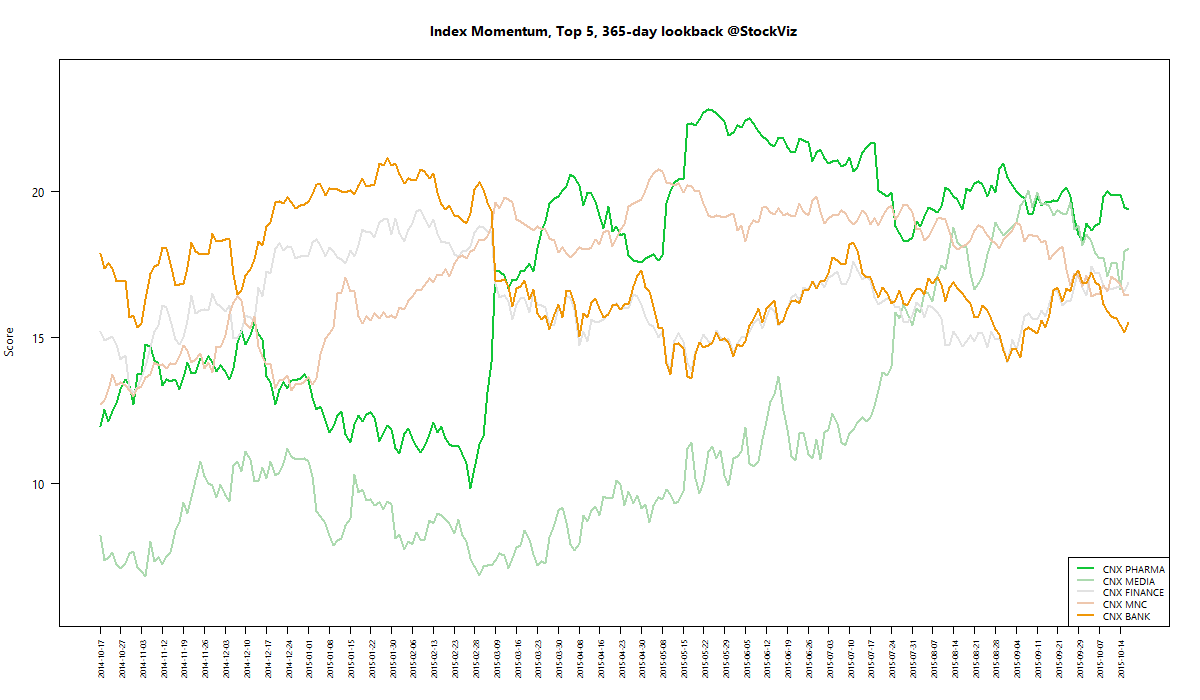
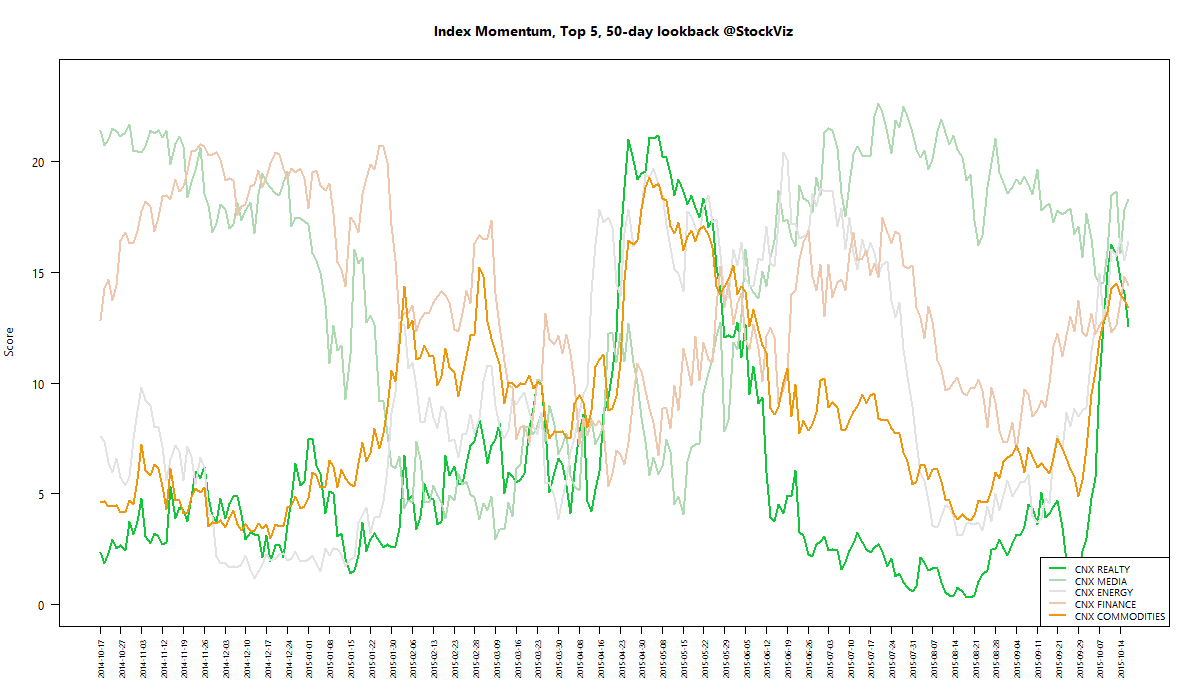
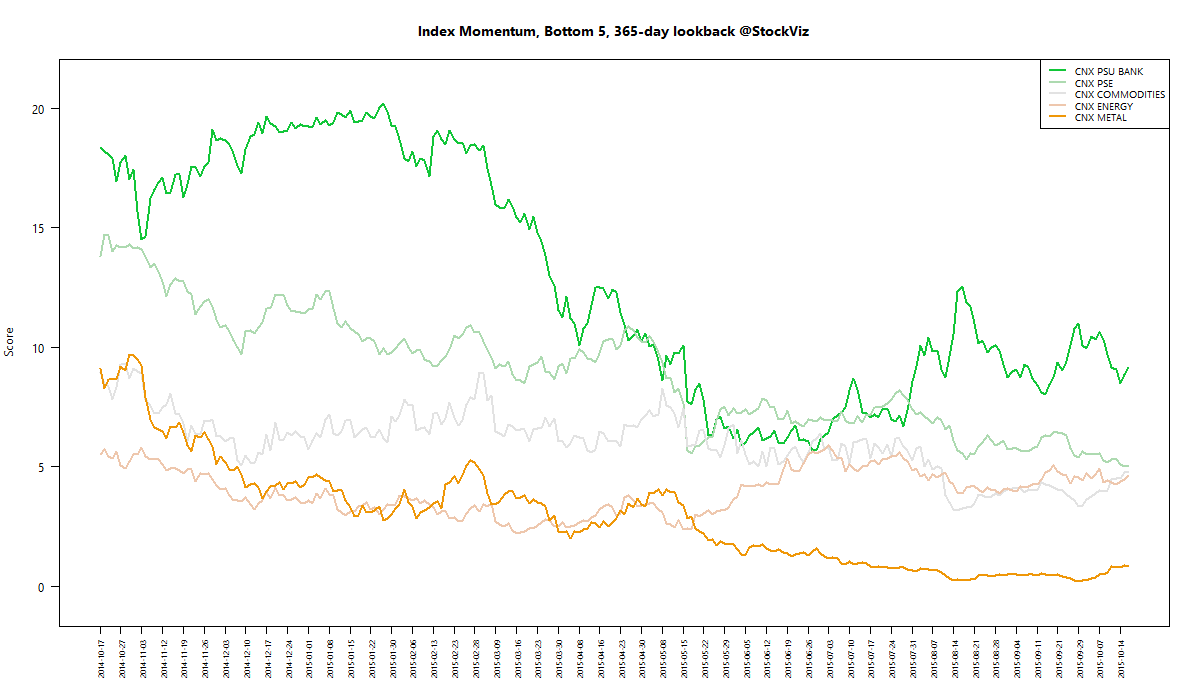
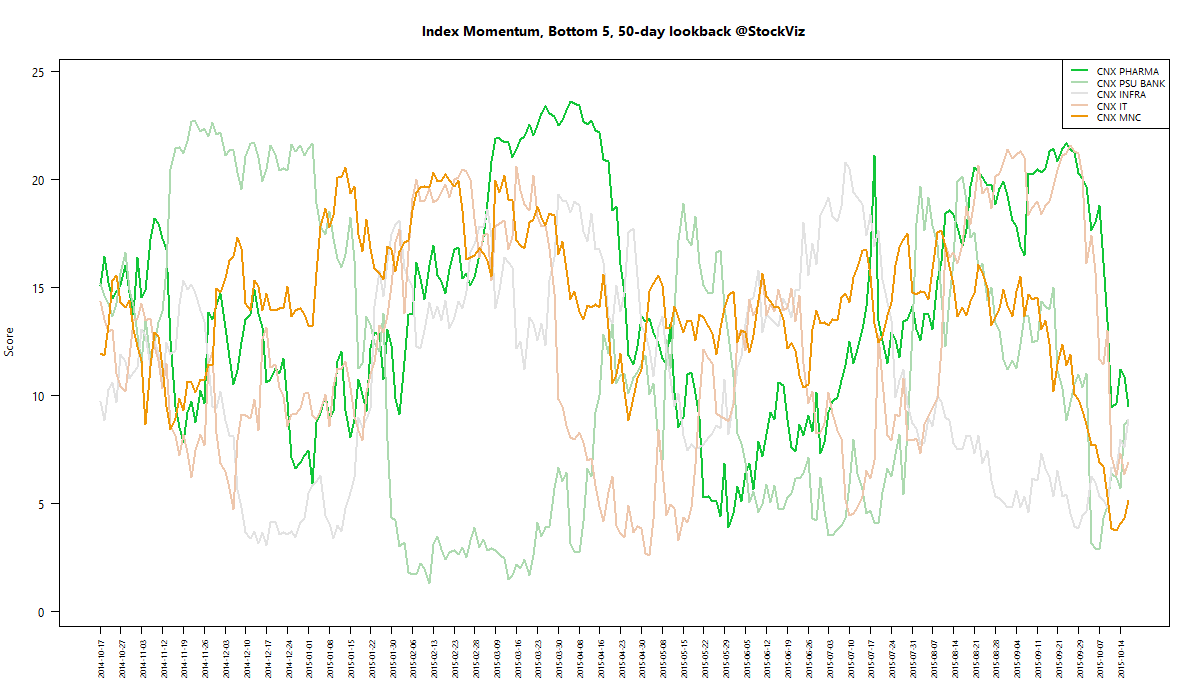
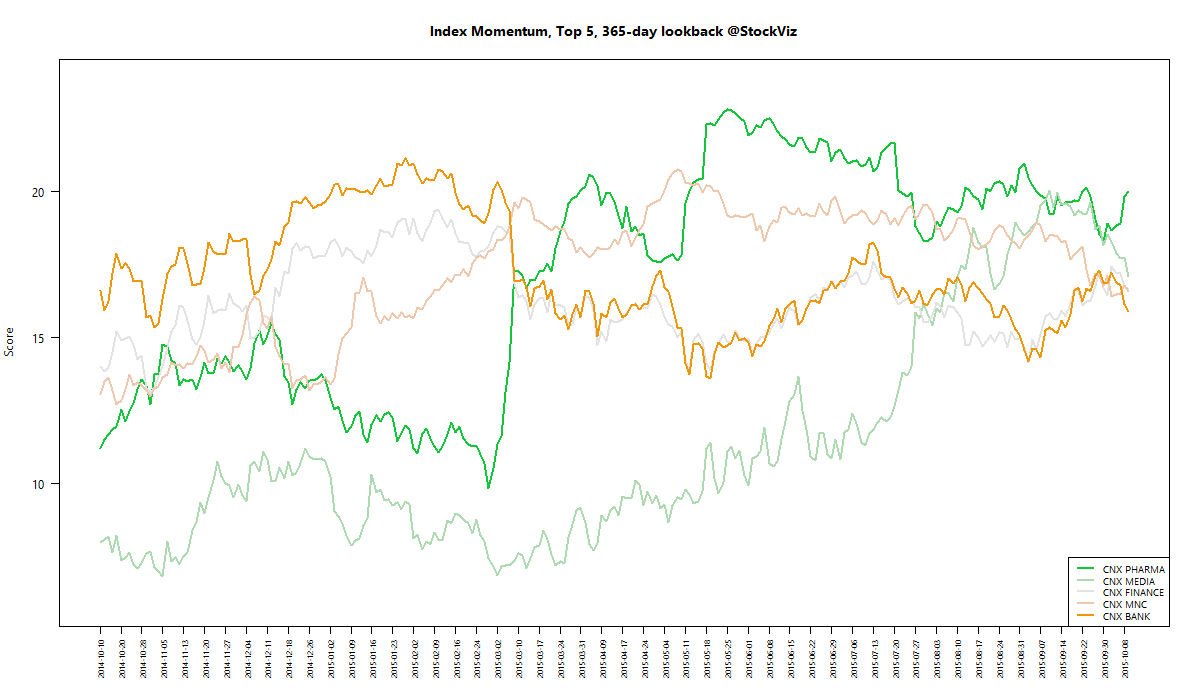
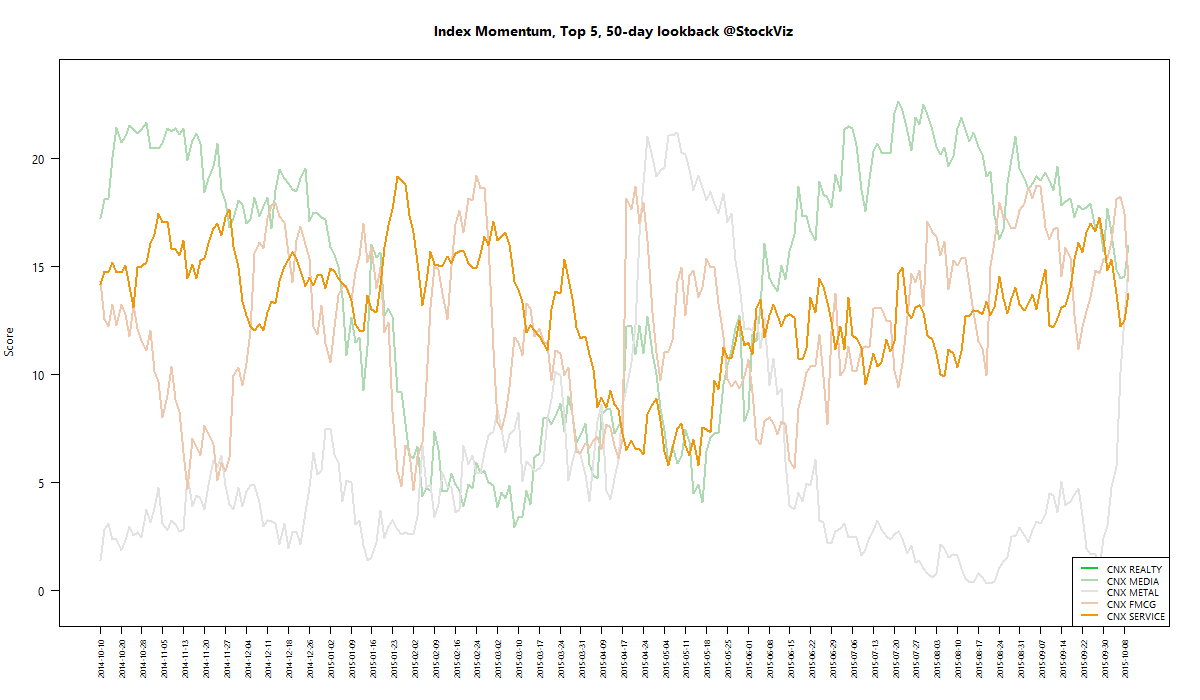
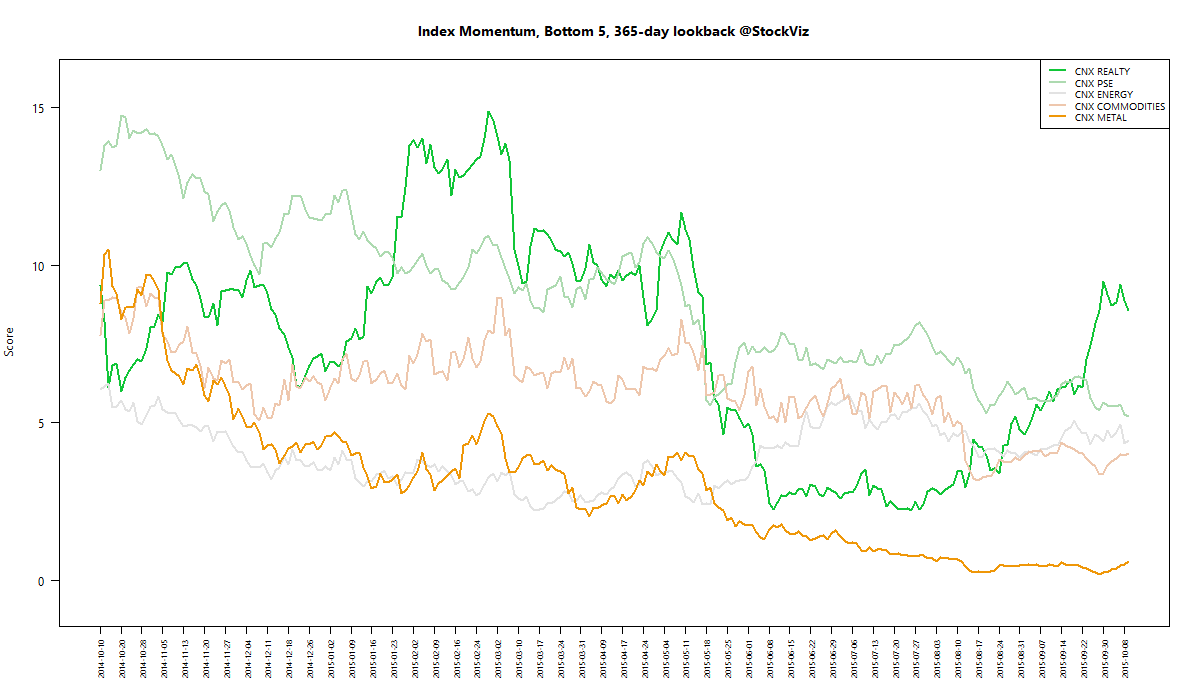
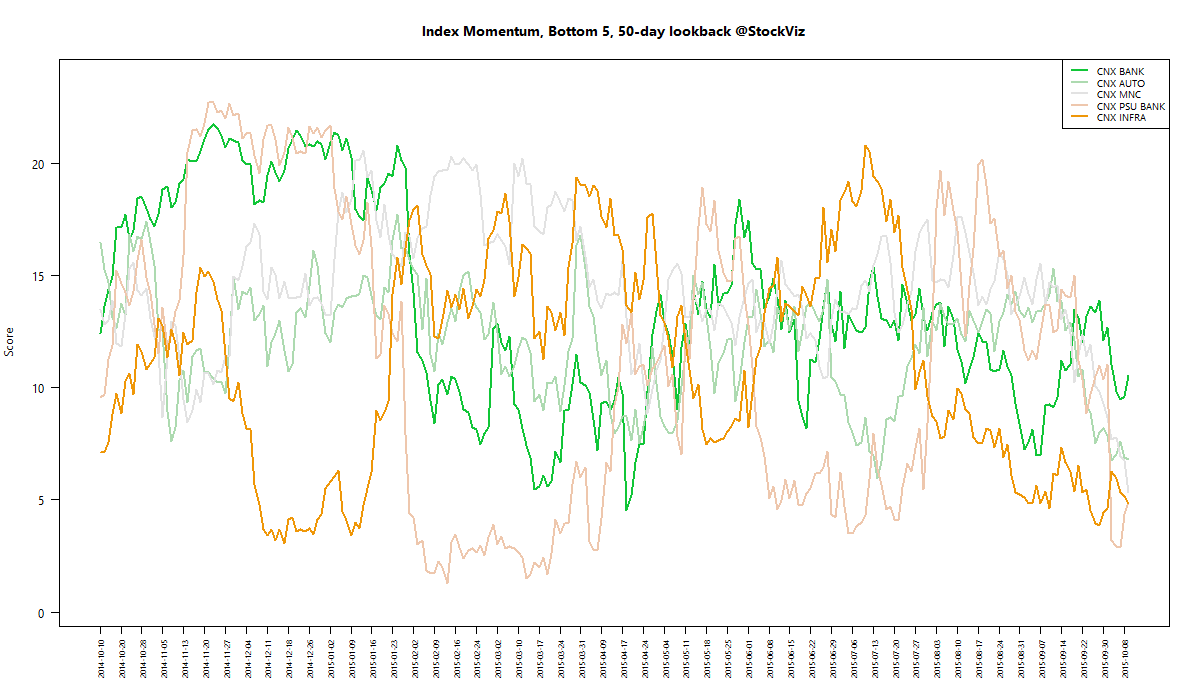
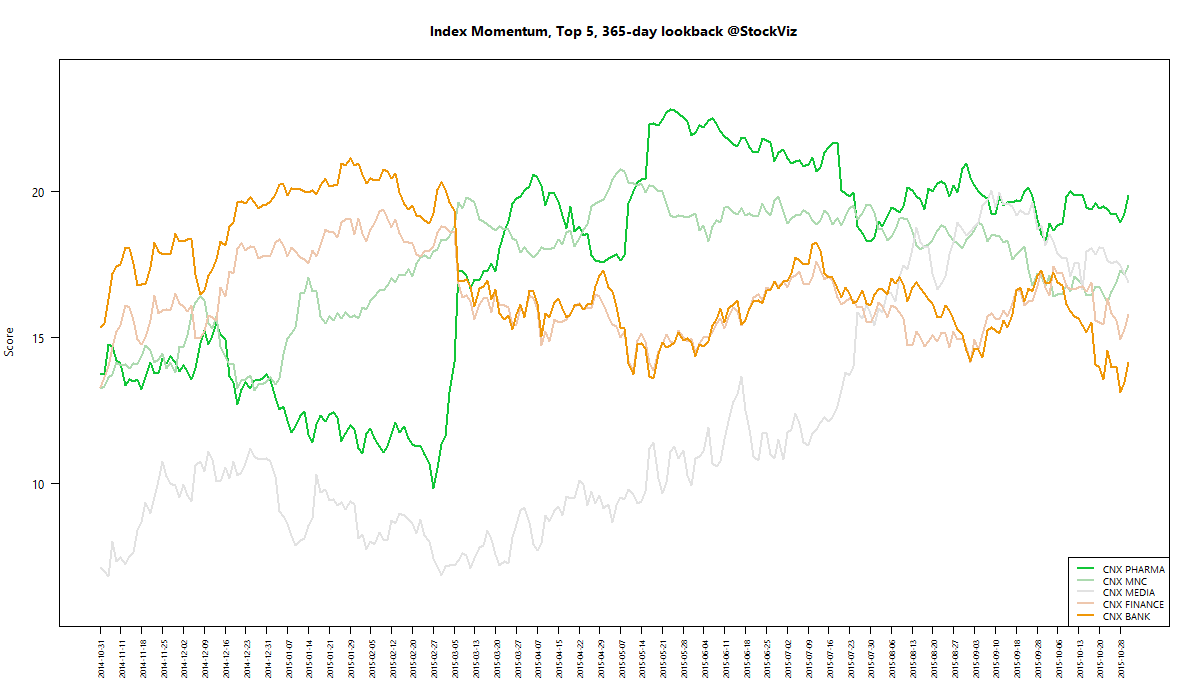
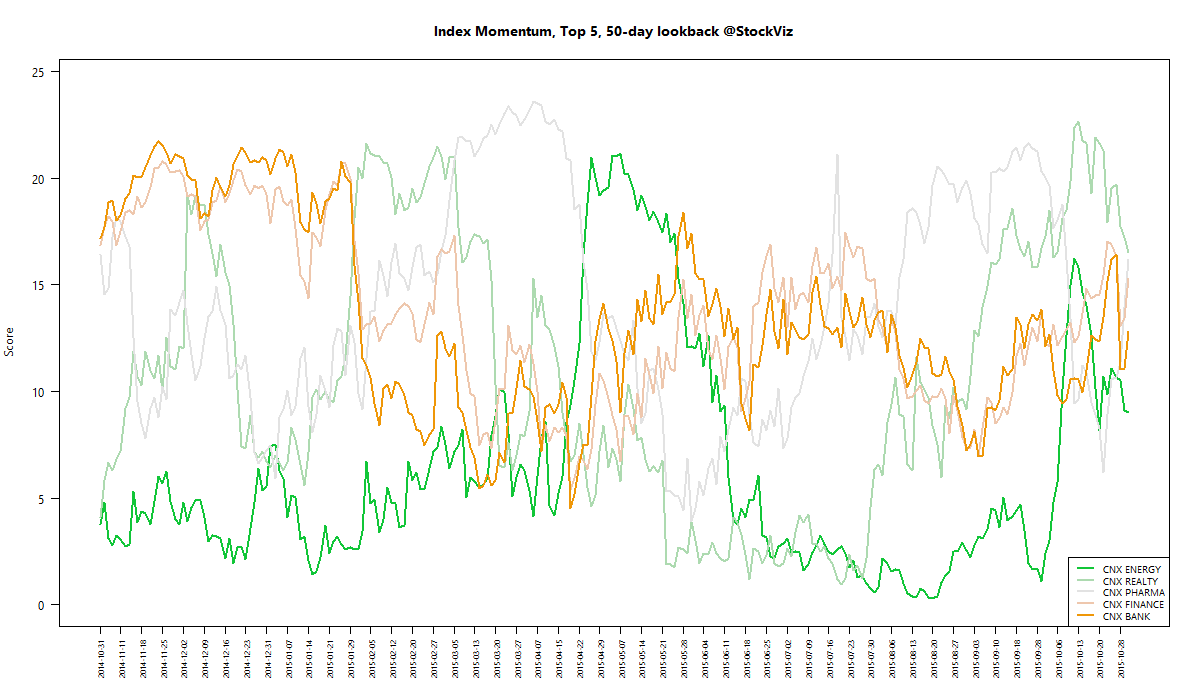
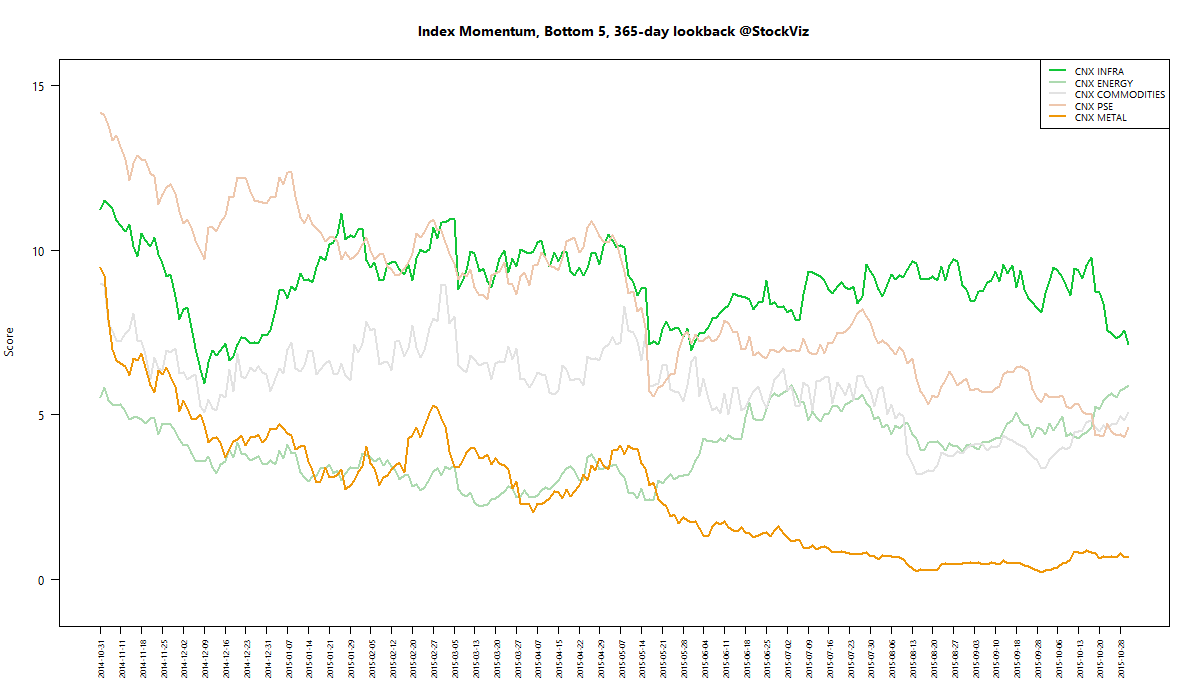
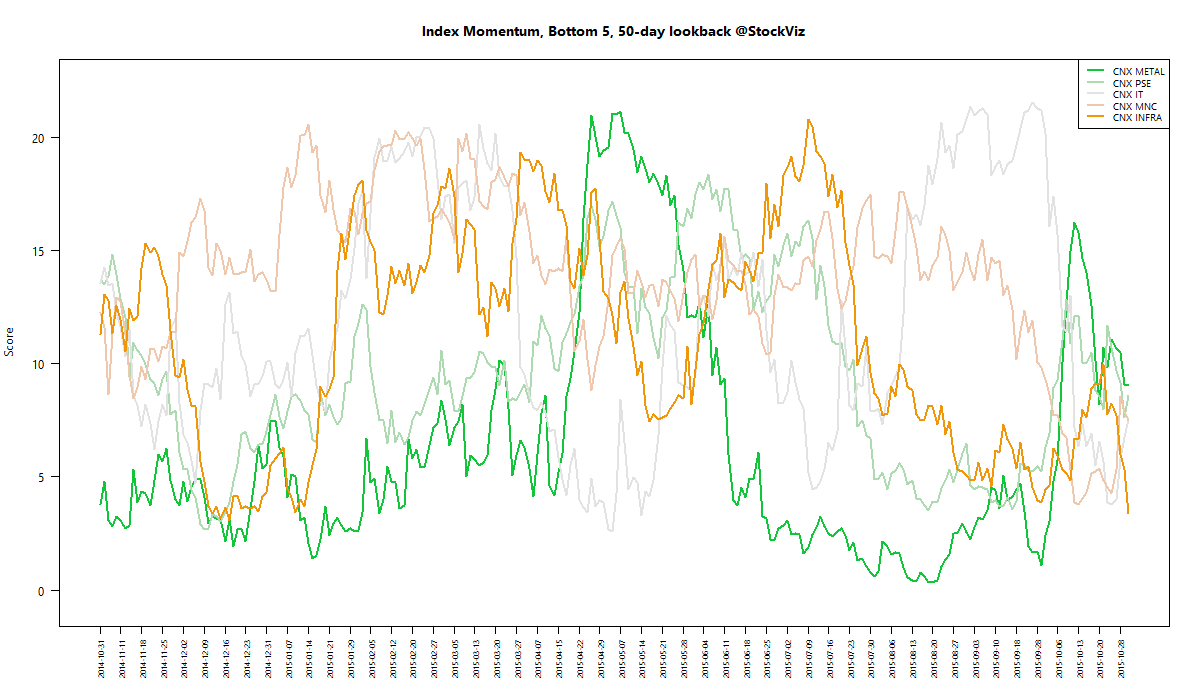
We run our proprietary momentum scoring algorithm on indices just like we do on stocks. You can use the momentum scores of sub-indices to get a sense for which sectors have the wind on their backs and those that are facing headwinds.

Traders can pick their longs in sectors with high short-term momentum and their shorts in sectors with low momentum. Investors can use the longer lookback scores to position themselves using our re-factored index Themes.

You can see how the momentum algorithm has performed on individual stocks here.

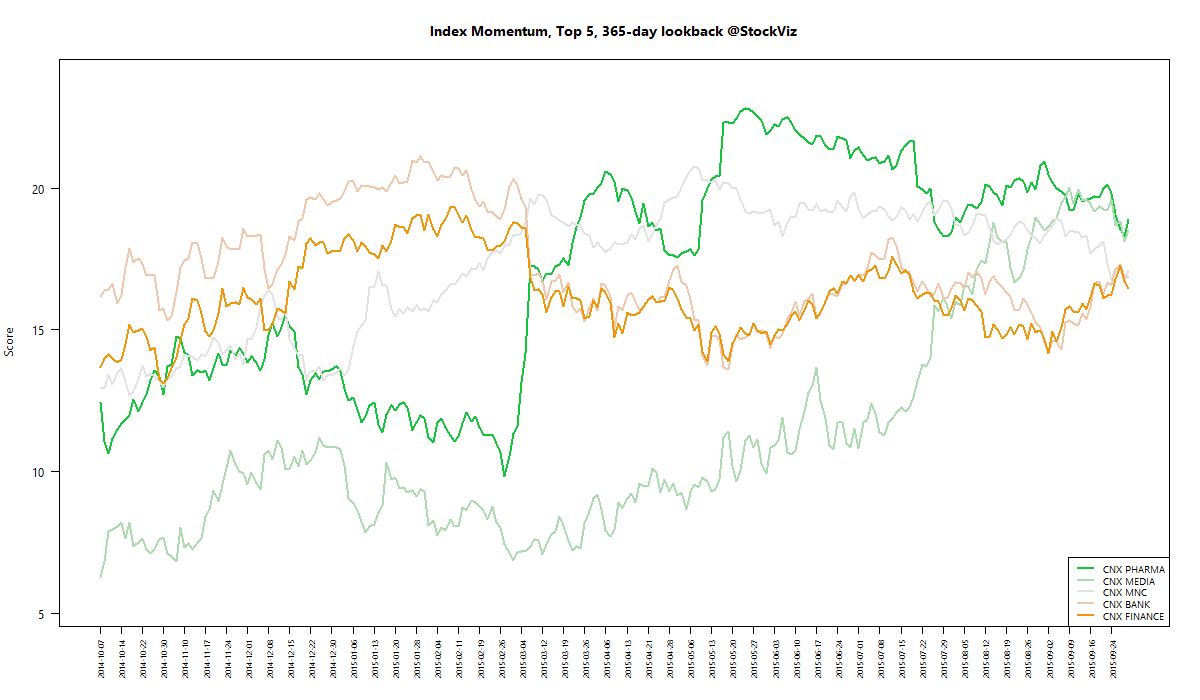
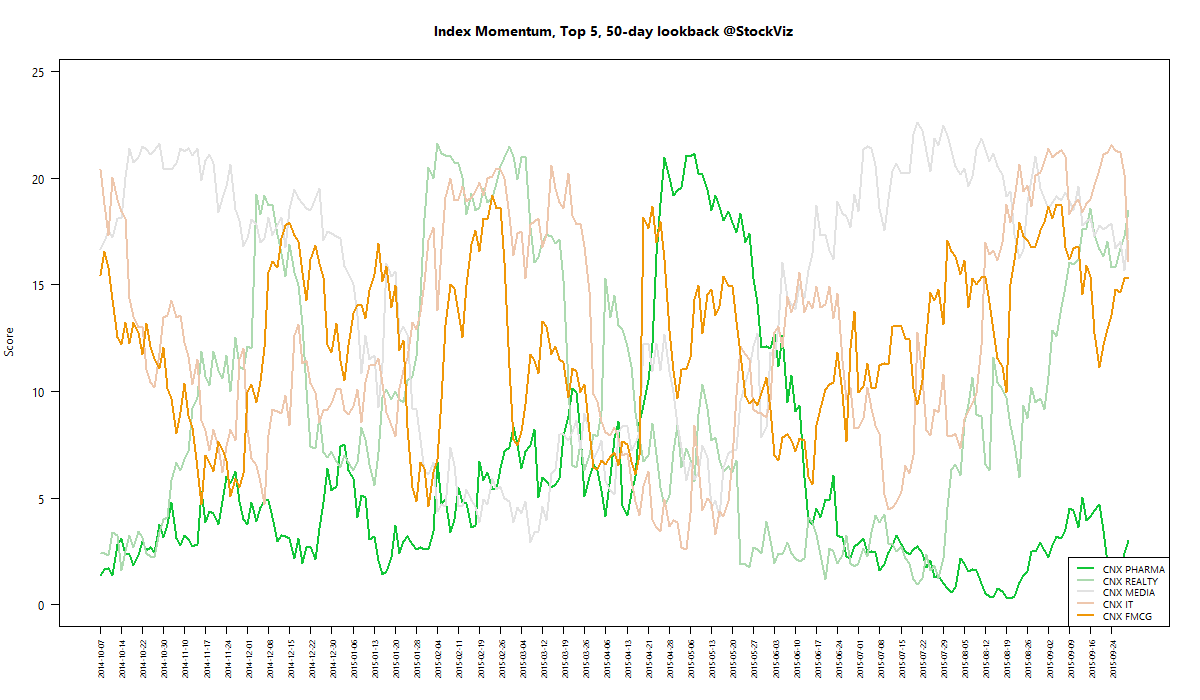
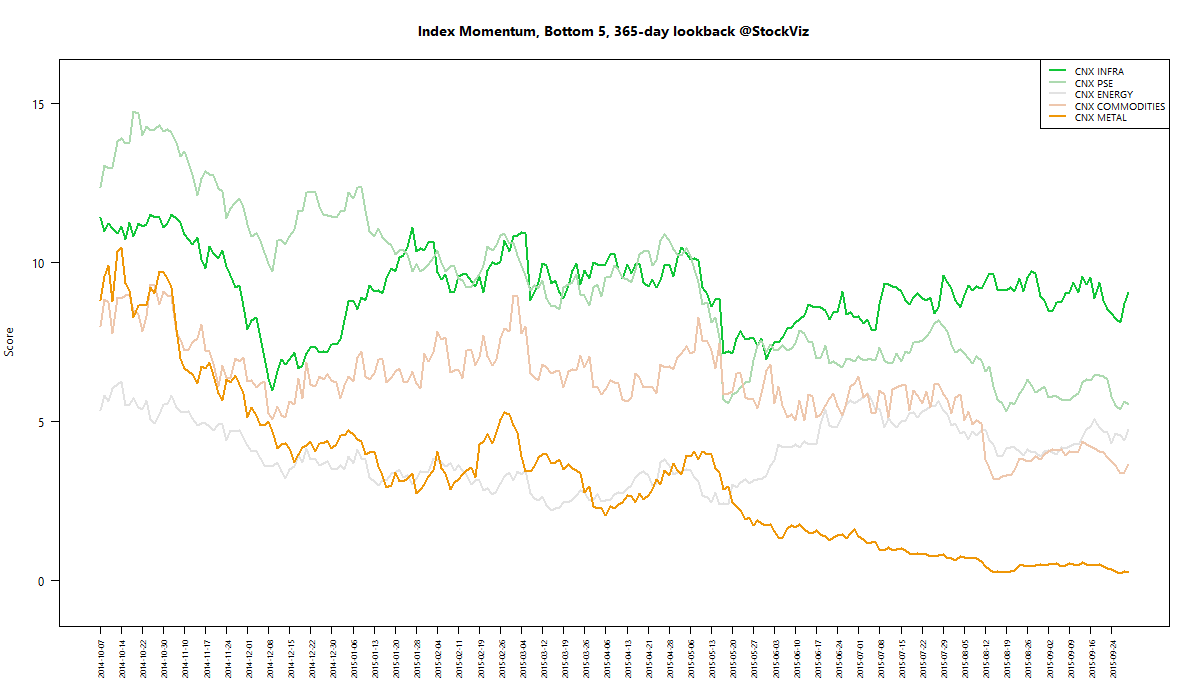
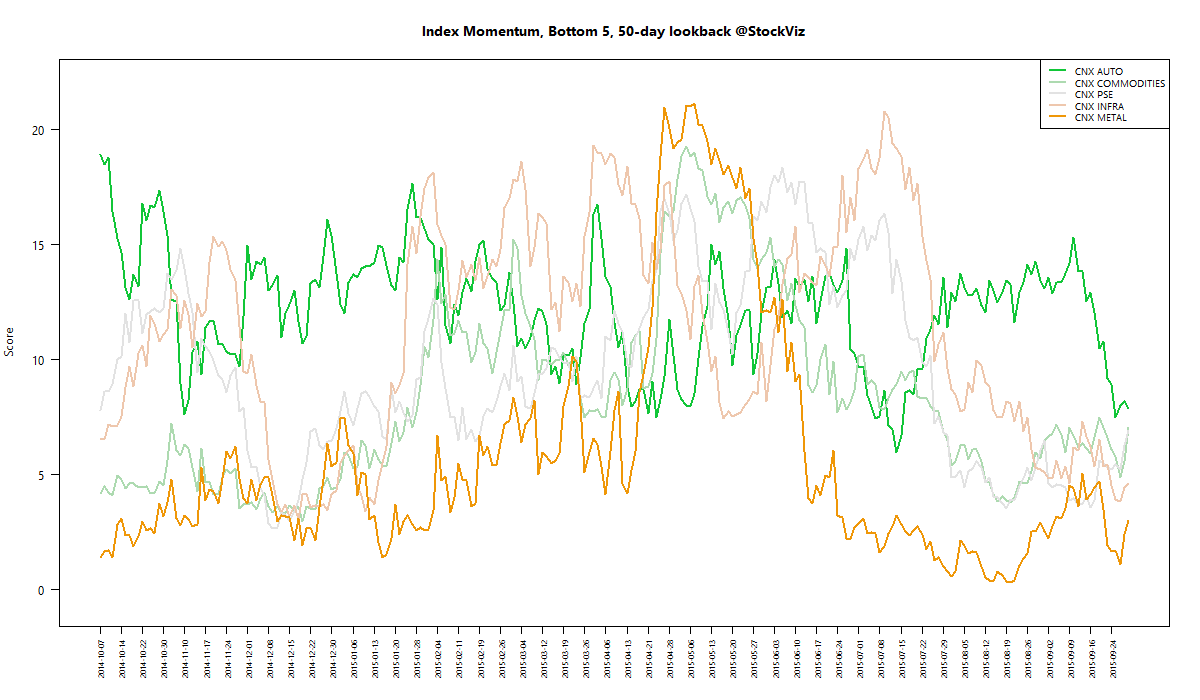
Here are the best and the worst sub-indices:
index momentum best 365 2015-10-16 png

index momentum best 50 2015-10-16 png

index momentum worst 365 2015-10-16 png

index momentum worst 50 2015-10-16 png

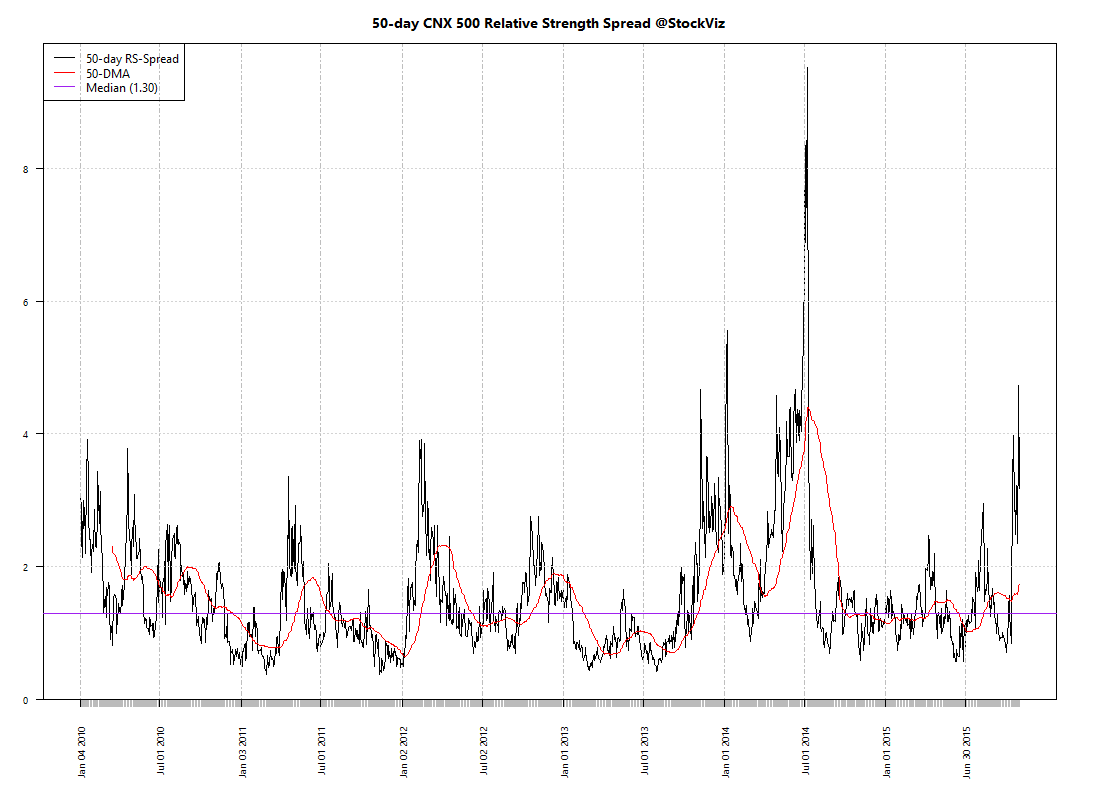
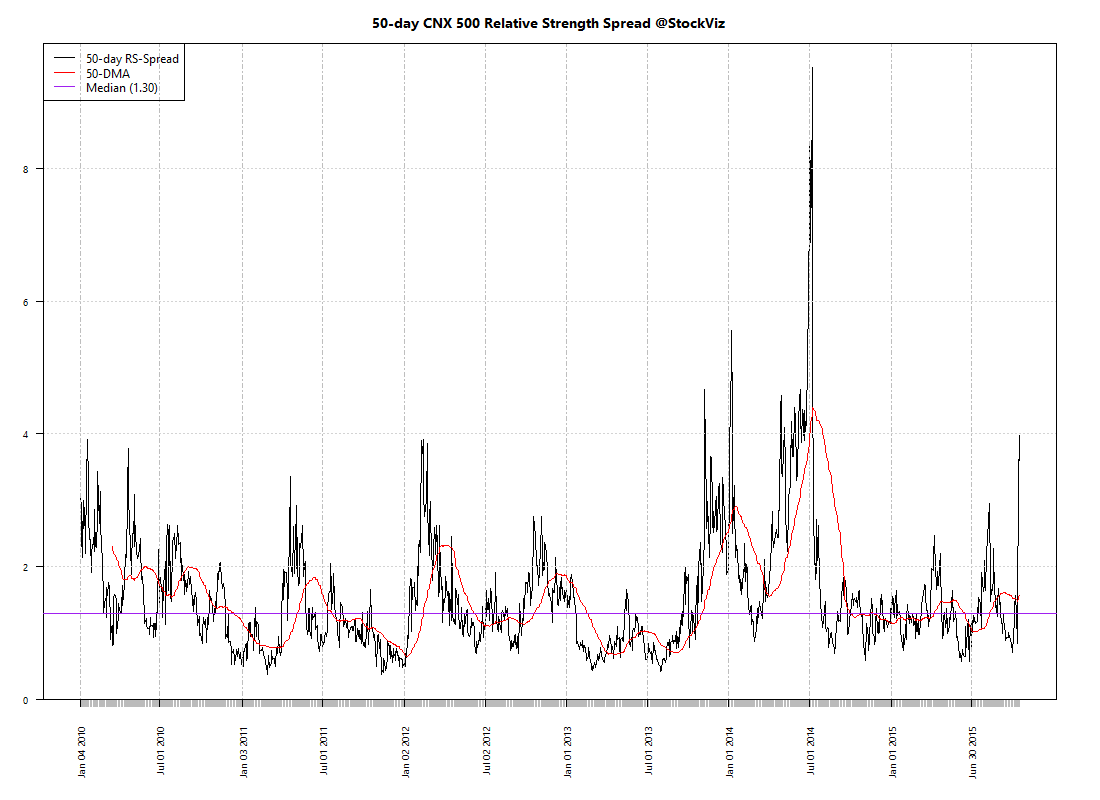
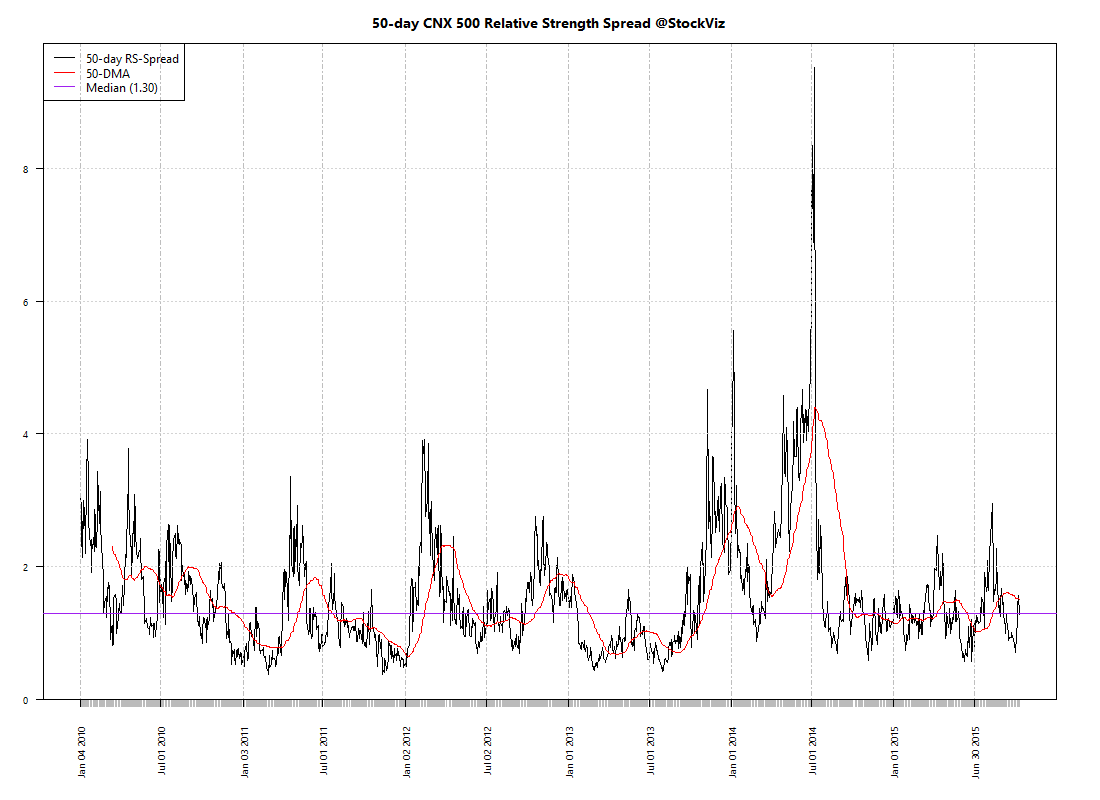
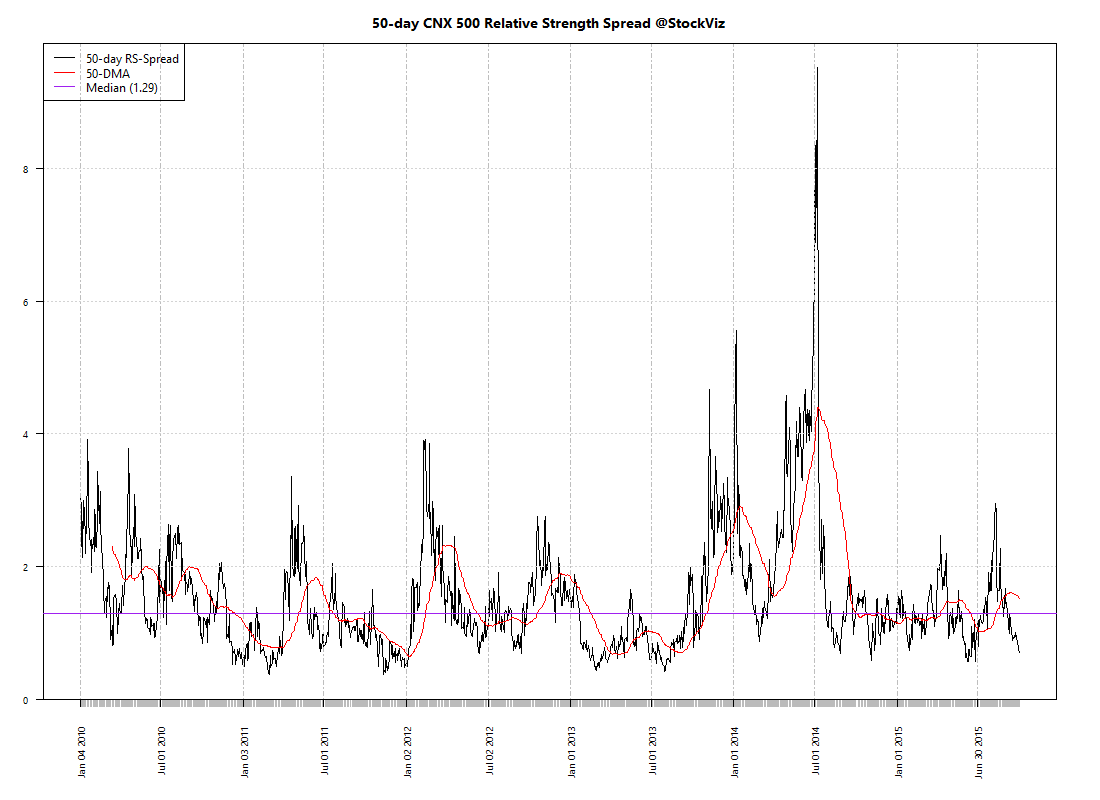
Relative Strength Spread

CNX_500 relative-spread-index 50 2015-10-16 png

Refactored Index Performance

50-day performance, from August 05, 2015 through October 16, 2015:

Trend Model Summary

Index Signal % From Peak Day of Peak
CNX AUTO LONG
9.15
2015-Jan-27
CNX BANK SHORT
12.86
2015-Jan-27
CNX COMMODITIES LONG
34.08
2008-Jan-04
CNX CONSUMPTION SHORT
5.14
2015-Aug-05
CNX ENERGY LONG
32.46
2008-Jan-14
CNX FMCG SHORT
8.34
2015-Feb-25
CNX INFRA LONG
51.93
2008-Jan-09
CNX IT LONG
88.13
2000-Feb-21
CNX MEDIA LONG
15.16
2008-Jan-04
CNX METAL LONG
65.79
2008-Jan-04
CNX MNC SHORT
9.23
2015-Aug-10
CNX NIFTY SHORT
8.43
2015-Mar-03
CNX PHARMA SHORT
4.54
2015-Apr-08
CNX PSE LONG
32.11
2008-Jan-04
CNX PSU BANK SHORT
39.36
2010-Nov-05
CNX REALTY SHORT
90.28
2008-Jan-14
CNX SERVICE SHORT
9.35
2015-Mar-03
A retracement is underway for most indices. CNX 100 broke about its 50-day SMA, activating the Tactical CNX 100 Theme. With most companies yet to announce their results, curb your enthusiasm.

Relative Strength Spread Charts

What is Relative Strength Spread?

Relative Strength Spread of a stock is the relative cumulative performance of the stock vs. the CNX 500 index over the same period.

We had discussed how the Relative Strength Spread Index is a coincident indicator of momentum earlier. With a new update, we are publishing charts of relative strengths of individual stocks over multiple lookback periods. This can be found under the ‘Quant’ tab of the equity pages.

How to interpret Relative Strength Spread?

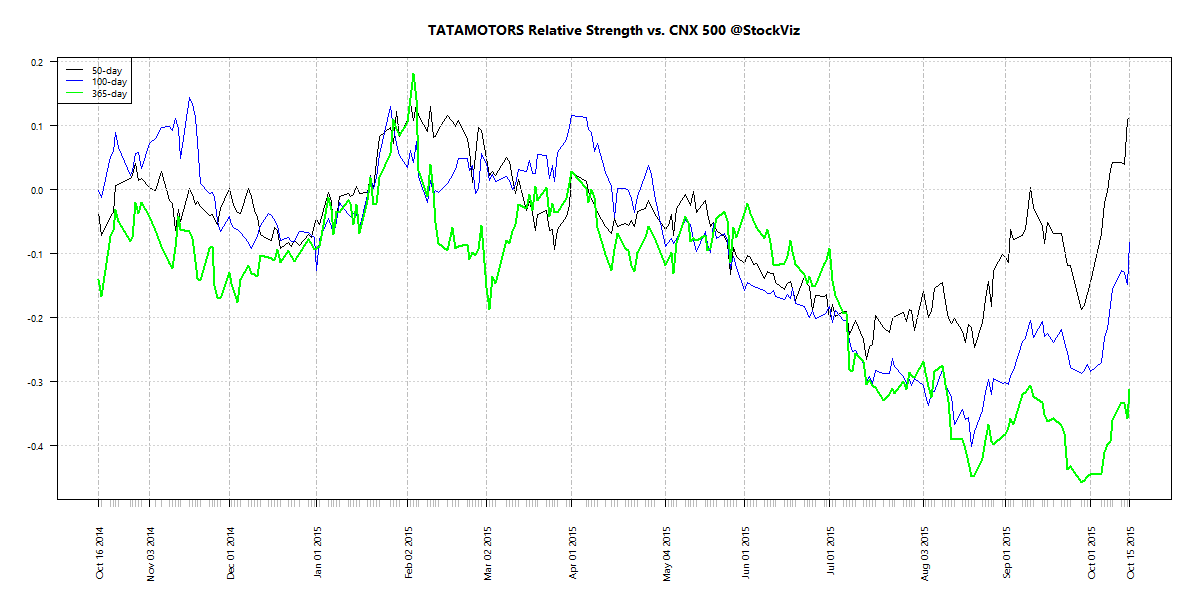
Relative Strength Spread is a measure of historical out-performance. By observing the RS-Spread over different lookback periods, investors can get a sense of future direction of momentum. For example, if you look at the RS-Spread of TATAMOTORS, you can observe how the stock lagged the broad market for the better part of the year before suddenly turning around in the last few days.

TATAMOTORS.relstrength

Now contrast that to BHARATFORG:

BHARATFORG.relstrength

Unlike a price or return chart that looks at an individual stock, the RS-Spread chart incorporates information from a broad set of stocks and compares it to the market average. It has more information content than the ‘Relative Momentum’ chart as well.

Index Update 10.10.2015

MOMENTUM

We run our proprietary momentum scoring algorithm on indices just like we do on stocks. You can use the momentum scores of sub-indices to get a sense for which sectors have the wind on their backs and those that are facing headwinds.

Traders can pick their longs in sectors with high short-term momentum and their shorts in sectors with low momentum. Investors can use the longer lookback scores to position themselves using our re-factored index Themes.

You can see how the momentum algorithm has performed on individual stocks here.

Here are the best and the worst sub-indices:
index momentum best 365 2015-10-09 png

index momentum best 50 2015-10-09 png

index momentum worst 365 2015-10-09 png

index momentum worst 50 2015-10-09 png

Relative Strength Spread

CNX_500 relative-spread-index 50 2015-10-09 png

Refactored Index Performance

50-day performance, from July 29, 2015 through October 09, 2015:

Trend Model Summary

Index Signal % From Peak Day of Peak
CNX AUTO LONG
11.52
2015-Jan-27
CNX BANK LONG
14.42
2015-Jan-27
CNX COMMODITIES LONG
35.32
2008-Jan-04
CNX CONSUMPTION LONG
5.71
2015-Aug-05
CNX ENERGY LONG
33.93
2008-Jan-14
CNX FMCG LONG
7.96
2015-Feb-25
CNX INFRA LONG
53.04
2008-Jan-09
CNX IT SHORT
87.64
2000-Feb-21
CNX MEDIA LONG
18.06
2008-Jan-04
CNX METAL LONG
66.60
2008-Jan-04
CNX MNC SHORT
9.28
2015-Aug-10
CNX NIFTY LONG
8.97
2015-Mar-03
CNX PHARMA LONG
4.00
2015-Apr-08
CNX PSE LONG
33.36
2008-Jan-04
CNX PSU BANK SHORT
40.81
2010-Nov-05
CNX REALTY LONG
90.30
2008-Jan-14
CNX SERVICE LONG
9.02
2015-Mar-03
And just like that, momentum is back!

Index Update 02.10.2015

MOMENTUM

We run our proprietary momentum scoring algorithm on indices just like we do on stocks. You can use the momentum scores of sub-indices to get a sense for which sectors have the wind on their backs and those that are facing headwinds.

Traders can pick their longs in sectors with high short-term momentum and their shorts in sectors with low momentum. Investors can use the longer lookback scores to position themselves using our re-factored index Themes.

You can see how the momentum algorithm has performed on individual stocks here.

Here are the best and the worst sub-indices:
index momentum best 365 2015-10-01 png

index momentum best 50 2015-10-01 png

index momentum worst 365 2015-10-01 png

index momentum worst 50 2015-10-01 png

Relative Strength Spread

CNX_500 relative-spread-index 50 2015-10-01 png

Refactored Index Performance

50-day performance, from July 22, 2015 through October 01, 2015:

Trend Model Summary

Index Signal % From Peak Day of Peak
CNX AUTO SHORT
15.03
2015-Jan-27
CNX BANK SHORT
16.57
2015-Jan-27
CNX COMMODITIES LONG
38.24
2008-Jan-04
CNX CONSUMPTION SHORT
7.34
2015-Aug-05
CNX ENERGY LONG
36.33
2008-Jan-14
CNX FMCG LONG
10.30
2015-Feb-25
CNX INFRA LONG
54.62
2008-Jan-09
CNX IT SHORT
87.57
2000-Feb-21
CNX MEDIA SHORT
18.02
2008-Jan-04
CNX METAL LONG
69.95
2008-Jan-04
CNX MNC SHORT
9.50
2015-Aug-10
CNX NIFTY SHORT
11.62
2015-Mar-03
CNX PHARMA SHORT
4.99
2015-Apr-08
CNX PSE LONG
35.62
2008-Jan-04
CNX PSU BANK SHORT
42.81
2010-Nov-05
CNX REALTY SHORT
90.62
2008-Jan-14
CNX SERVICE SHORT
10.92
2015-Mar-03
Dispersion is around its all-time lows – momentum algos will be struggling to find a toe-hold. Besides, the only thing that has worked in the last few months is long-only pharma and IT – both long USD trades.

Index Update 25.09.2015

MOMENTUM

We run our proprietary momentum scoring algorithm on indices just like we do on stocks. You can use the momentum scores of sub-indices to get a sense for which sectors have the wind on their backs and those that are facing headwinds.

Traders can pick their longs in sectors with high short-term momentum and their shorts in sectors with low momentum. Investors can use the longer lookback scores to position themselves using our re-factored index Themes.

You can see how the momentum algorithm has performed on individual stocks here.

Here are the best and the worst sub-indices:
index momentum best 365 2015-09-24 png

index momentum best 50 2015-09-24 png

index momentum worst 365 2015-09-24 png

index momentum worst 50 2015-09-24 png

Relative Strength Spread

CNX_500 relative-spread-index 50 2015-09-24 png

Refactored Index Performance

50-day performance, from July 16, 2015 through September 24, 2015:

Trend Model Summary

Index Signal % From Peak Day of Peak
CNX AUTO SHORT
15.15
2015-Jan-27
CNX BANK LONG
16.34
2015-Jan-27
CNX COMMODITIES SHORT
38.78
2008-Jan-04
CNX CONSUMPTION SHORT
9.43
2015-Aug-05
CNX ENERGY SHORT
37.64
2008-Jan-14
CNX FMCG LONG
12.60
2015-Feb-25
CNX INFRA SHORT
55.65
2008-Jan-09
CNX IT LONG
87.48
2000-Feb-21
CNX MEDIA SHORT
18.71
2008-Jan-04
CNX METAL SHORT
69.33
2008-Jan-04
CNX MNC SHORT
10.28
2015-Aug-10
CNX NIFTY SHORT
12.54
2015-Mar-03
CNX PHARMA LONG
7.26
2015-Apr-08
CNX PSE SHORT
36.45
2008-Jan-04
CNX PSU BANK LONG
41.91
2010-Nov-05
CNX REALTY LONG
90.96
2008-Jan-14
CNX SERVICE LONG
11.70
2015-Mar-03
Relative strength spread continues to be in negative momentum territory. Contrarians can use this moment to load up on momentum strategies and ride the bounce…