Tag: momentum

Index Update 16.01.2016

MOMENTUM

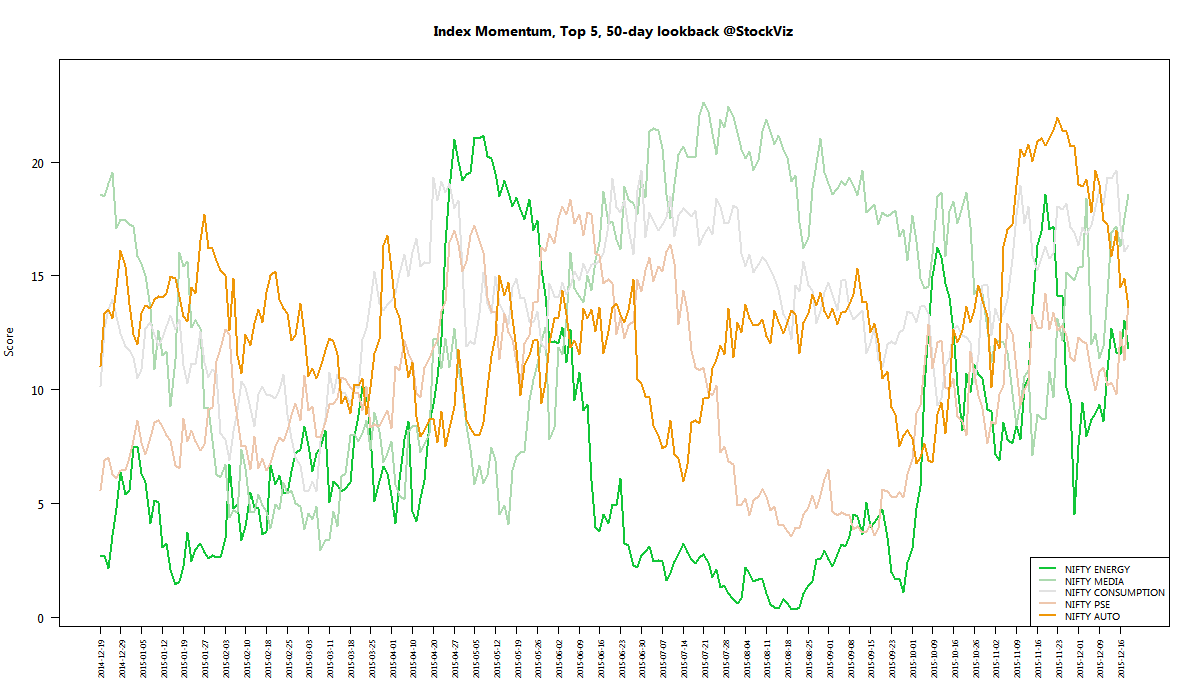
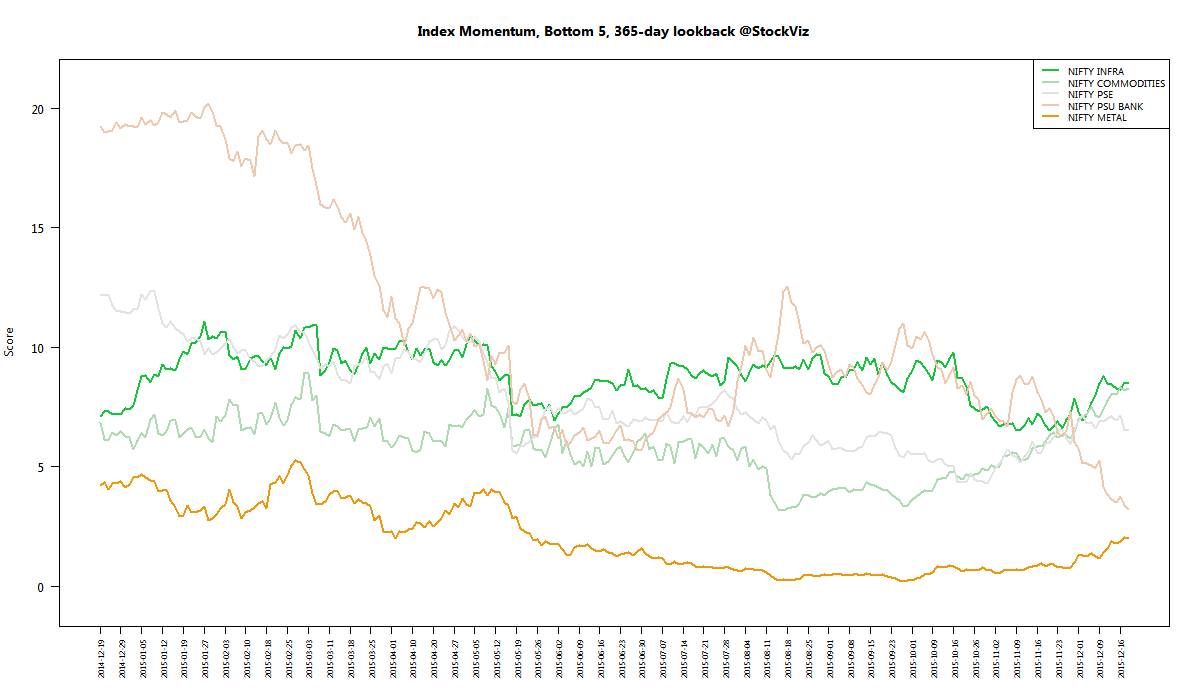
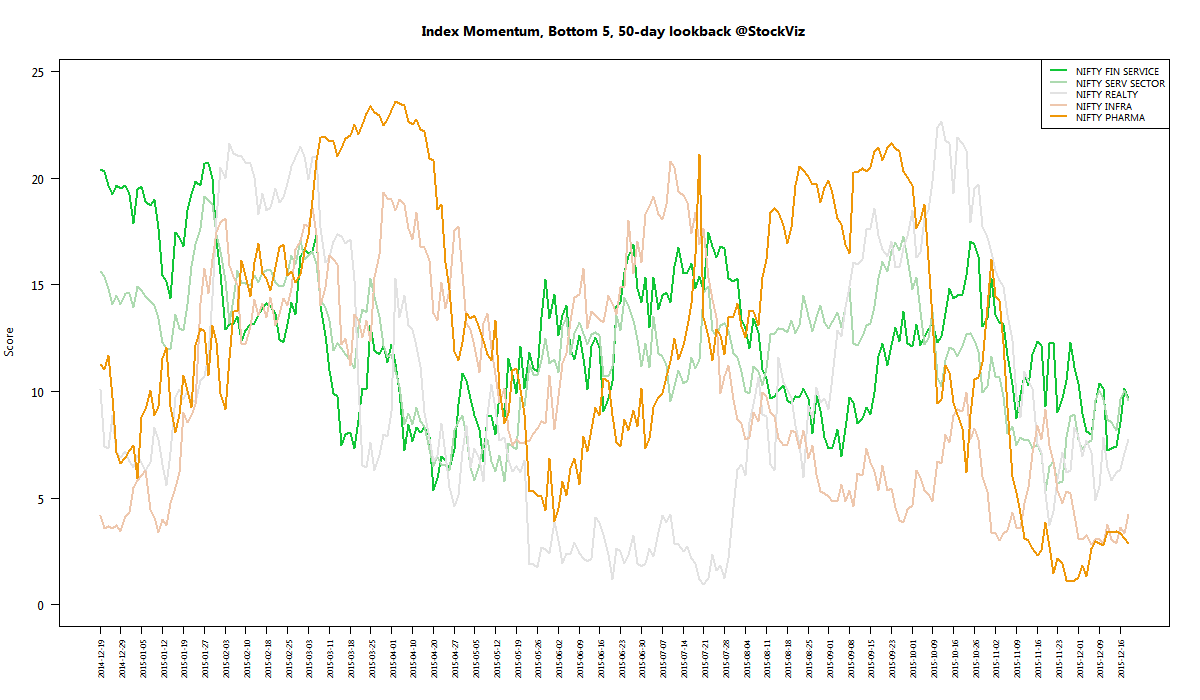
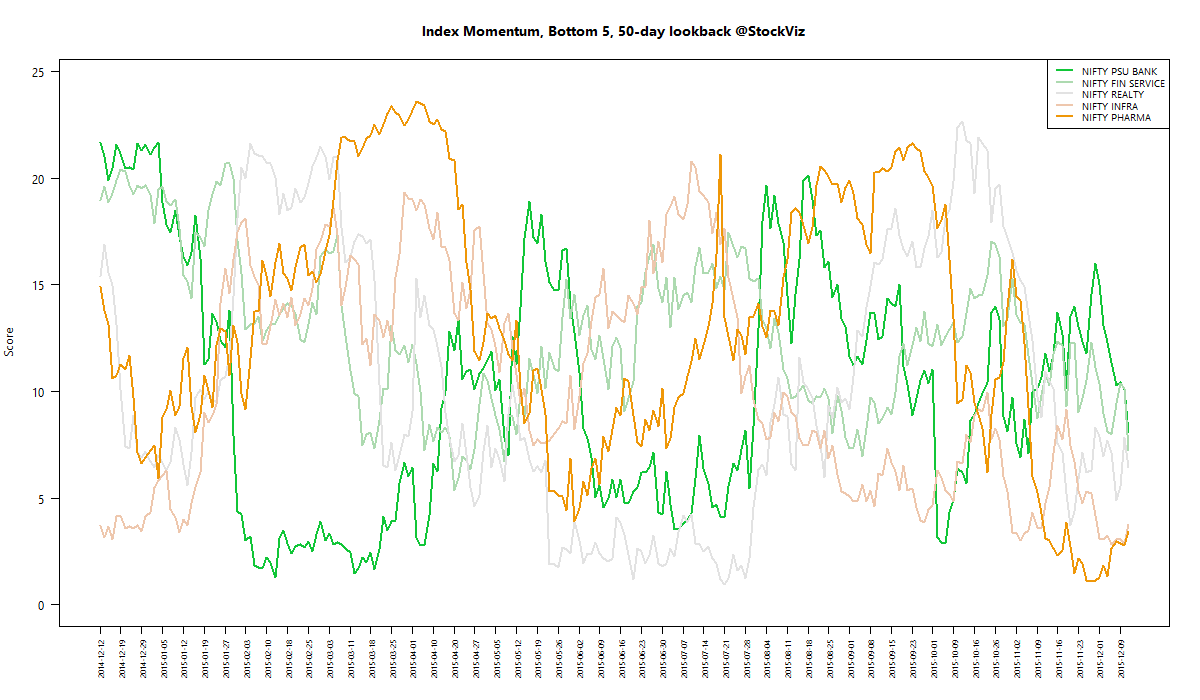
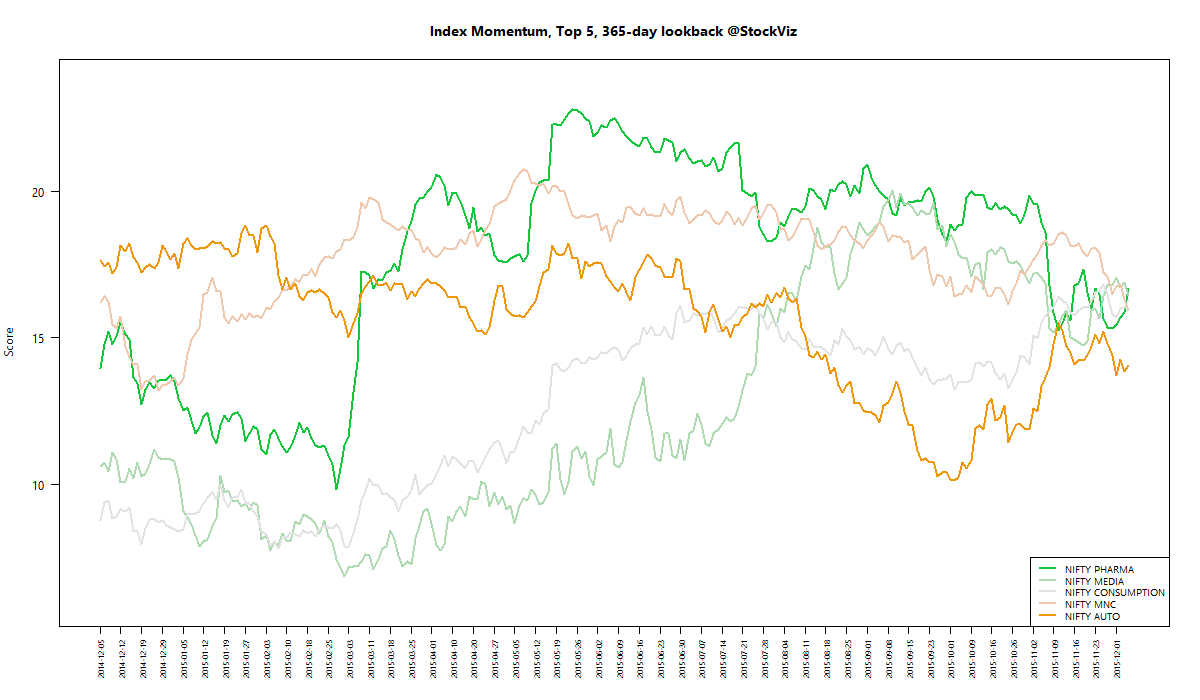
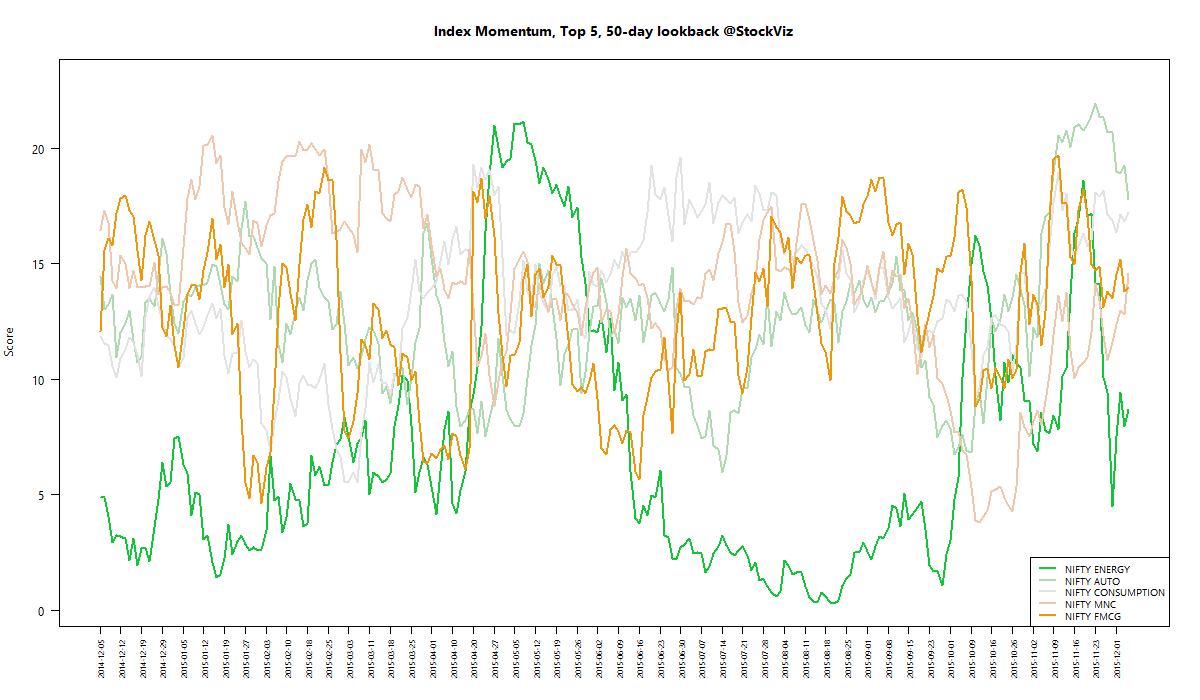
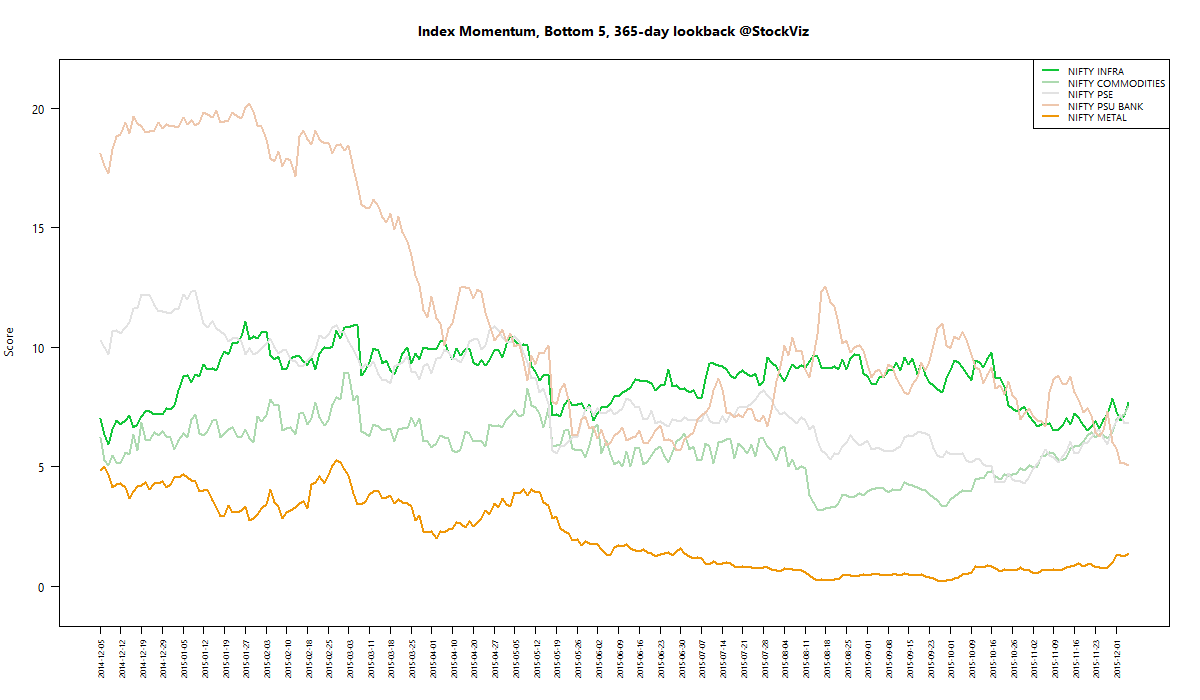
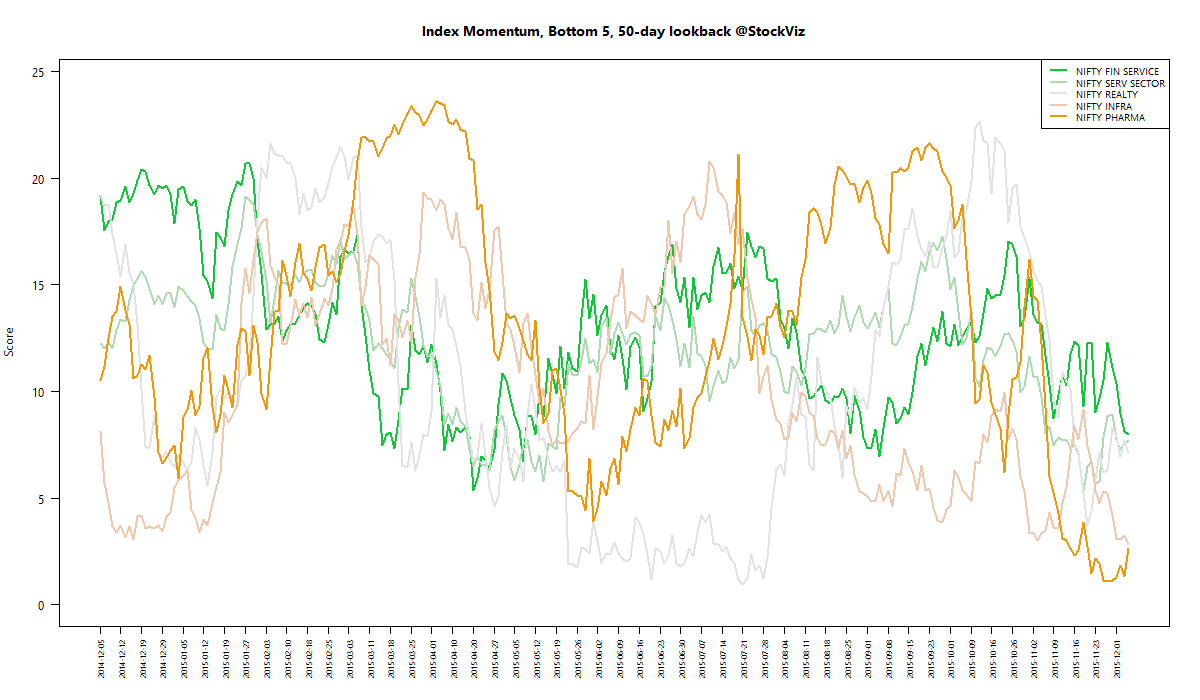
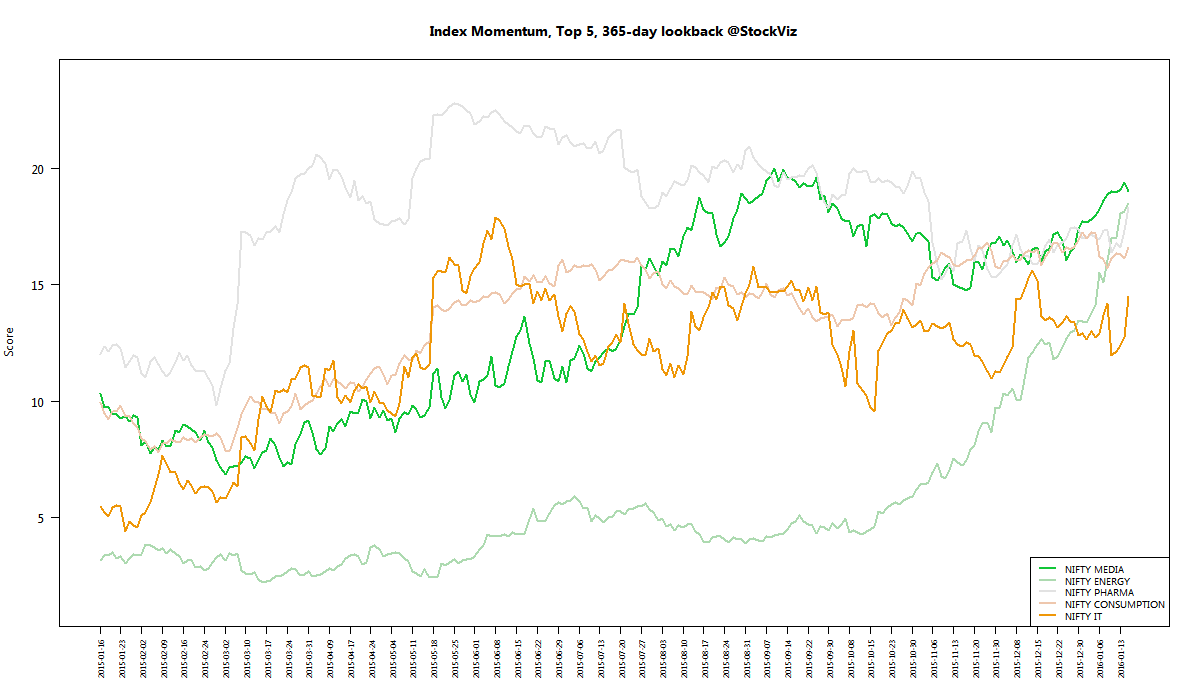
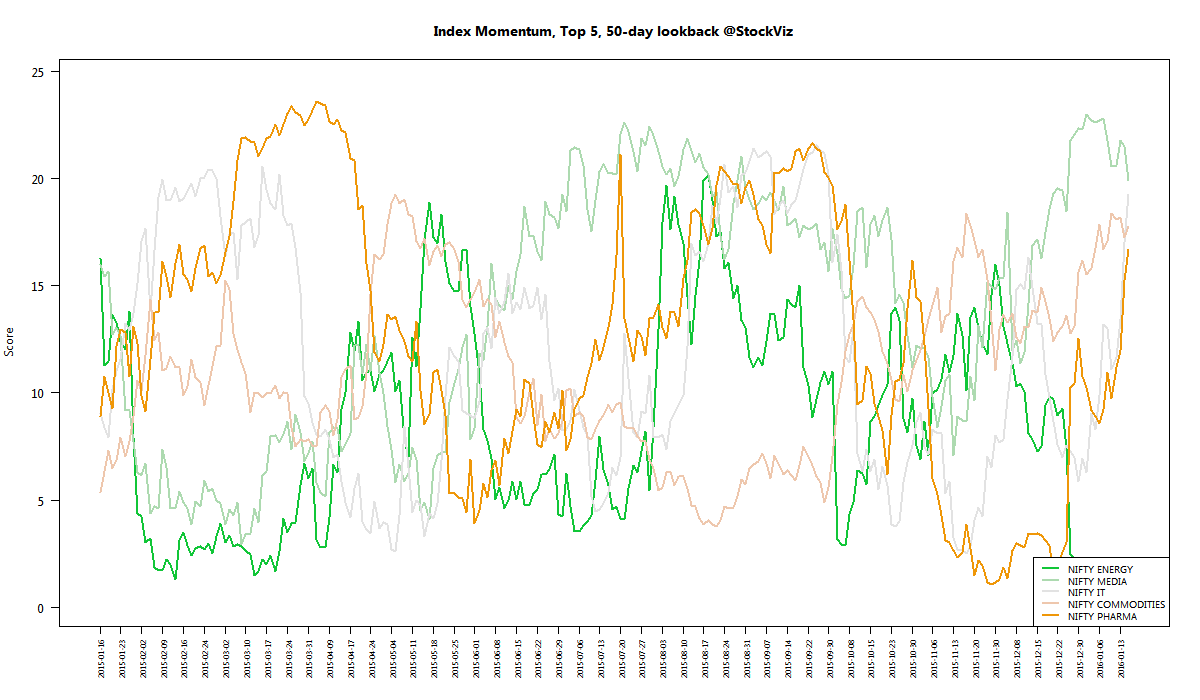
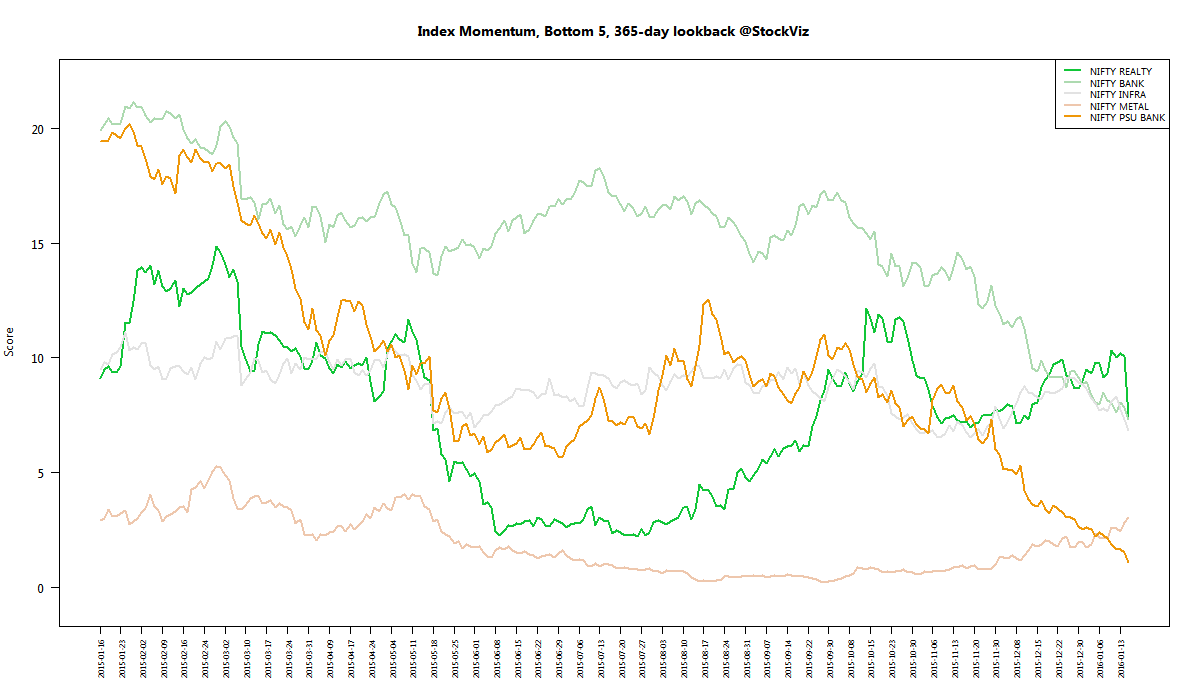
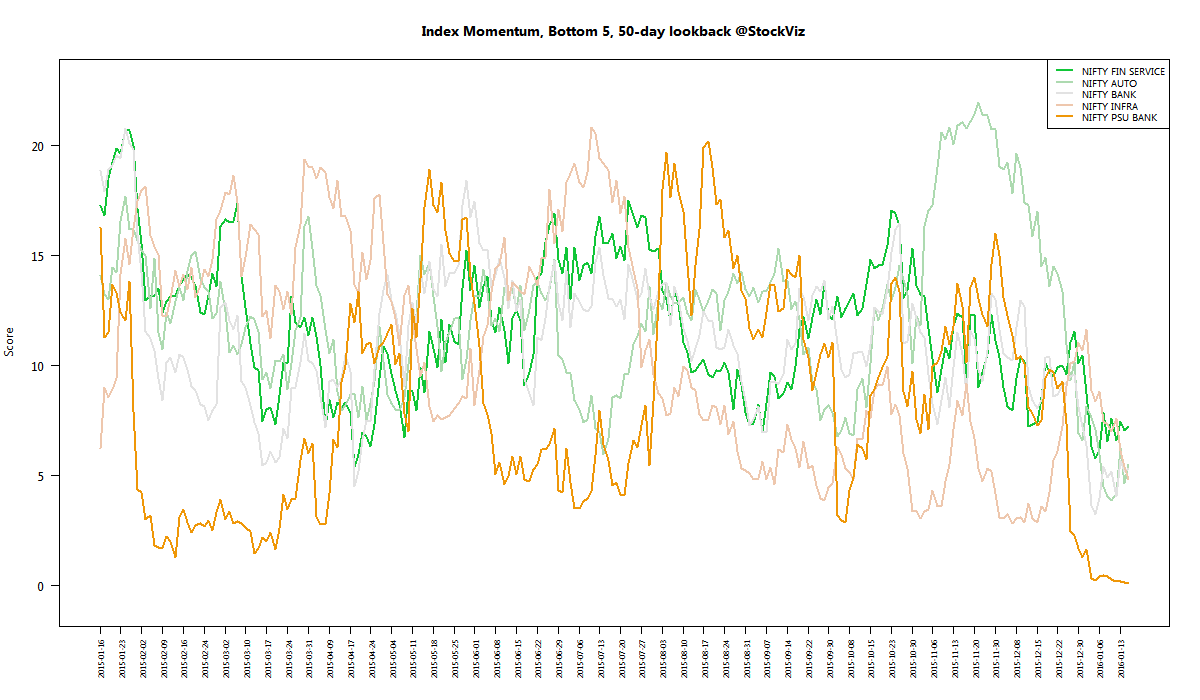
We run our proprietary momentum scoring algorithm on indices just like we do on stocks. You can use the momentum scores of sub-indices to get a sense for which sectors have the wind on their backs and those that are facing headwinds.

Traders can pick their longs in sectors with high short-term momentum and their shorts in sectors with low momentum. Investors can use the longer lookback scores to position themselves using our re-factored index Themes.

You can see how the momentum algorithm has performed on individual stocks here.

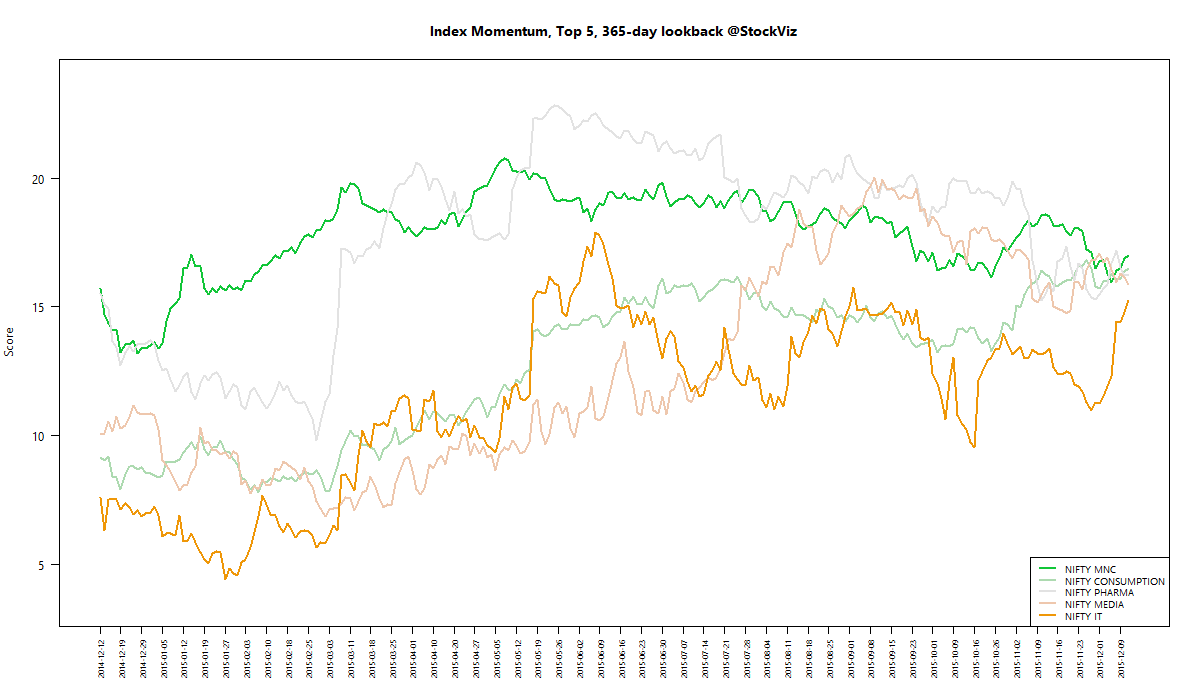
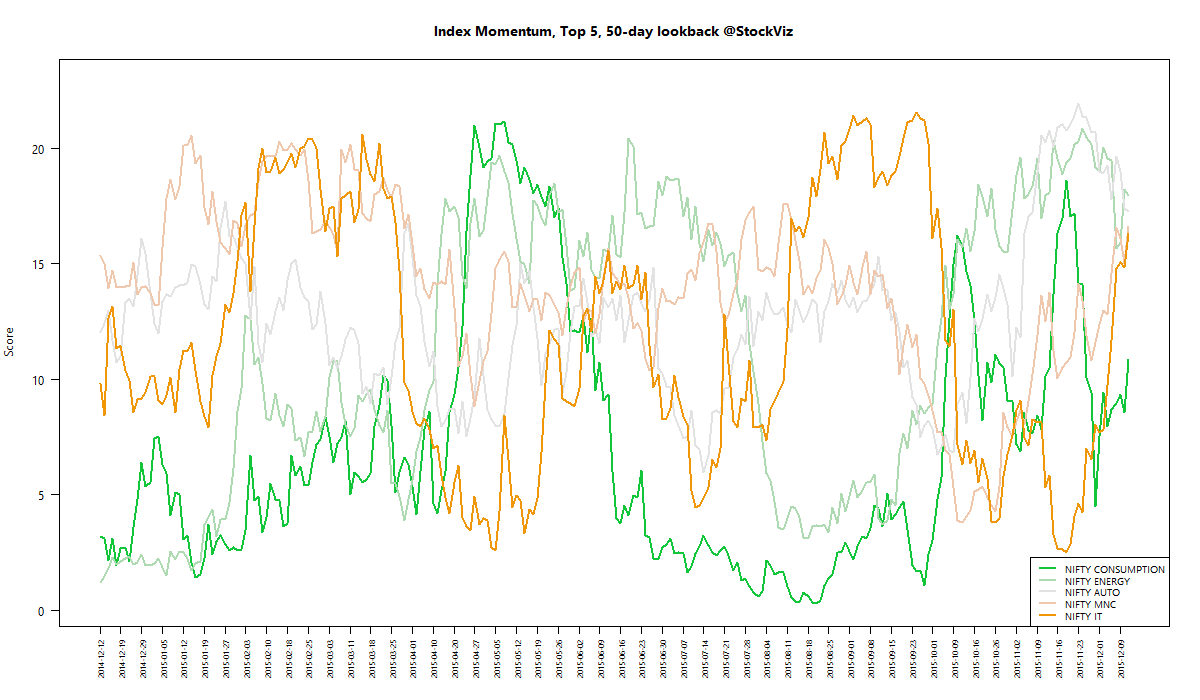
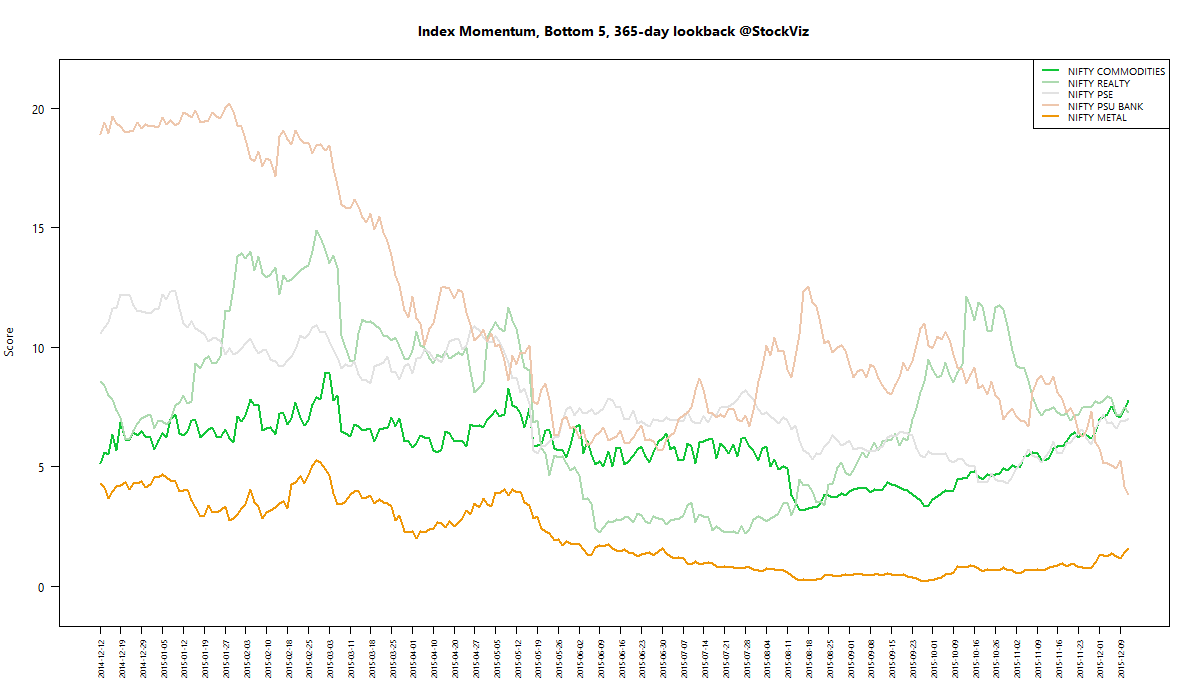
Here are the best and the worst sub-indices:
index momentum best 365 2016-01-15 png

index momentum best 50 2016-01-15 png

index momentum worst 365 2016-01-15 png

index momentum worst 50 2016-01-15 png

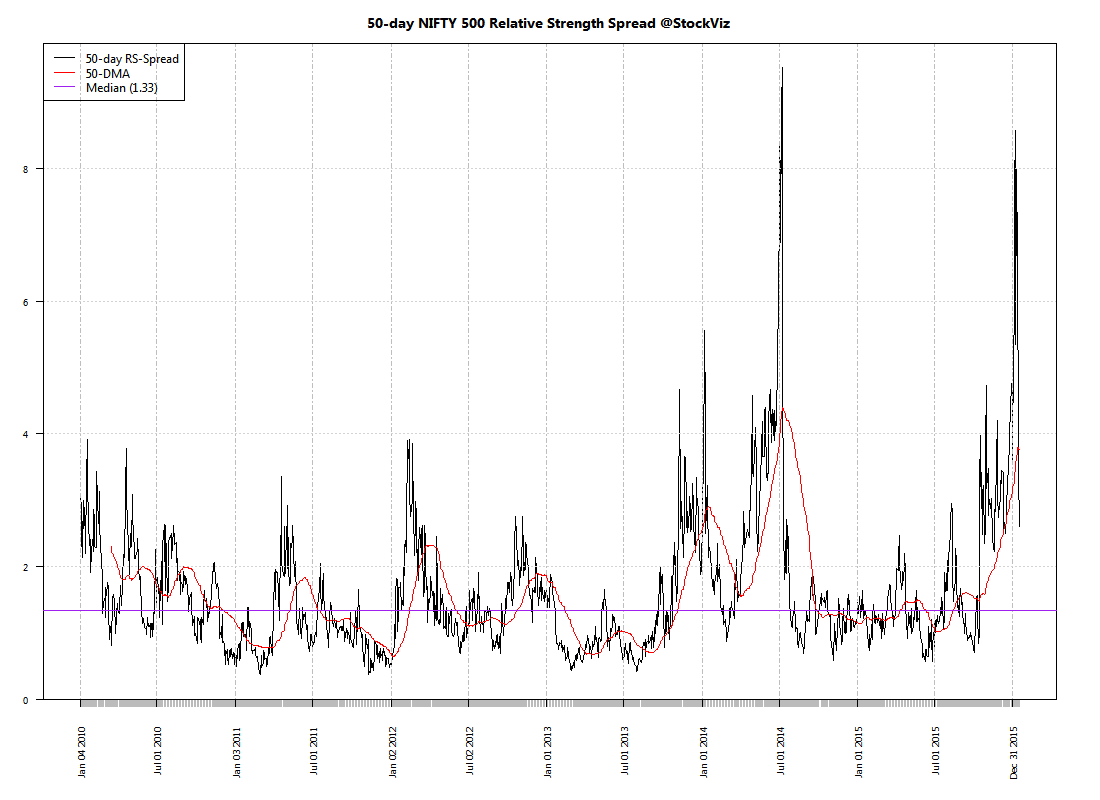
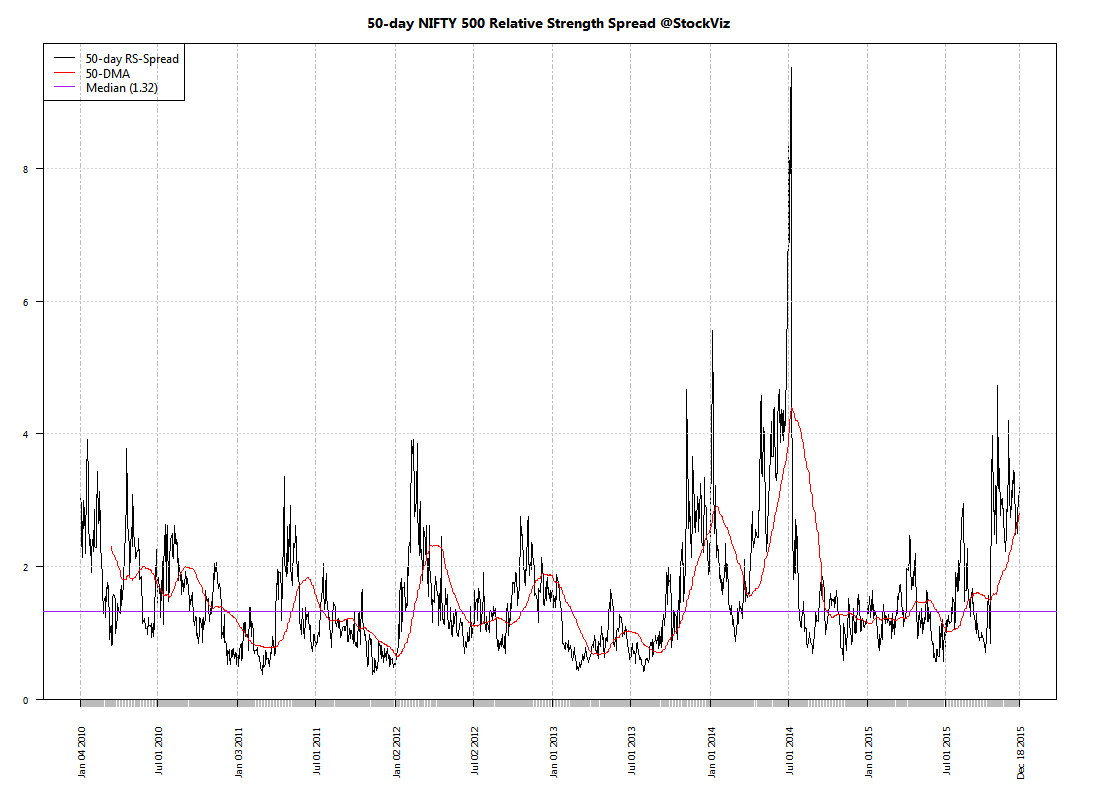
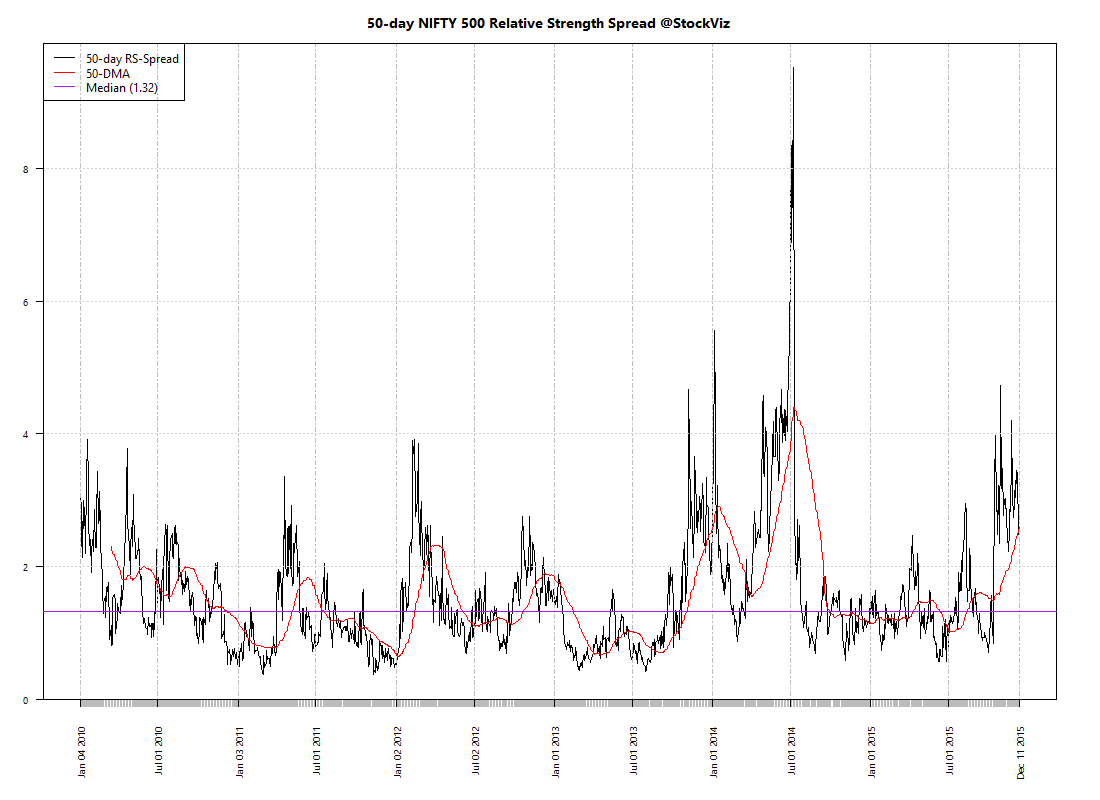
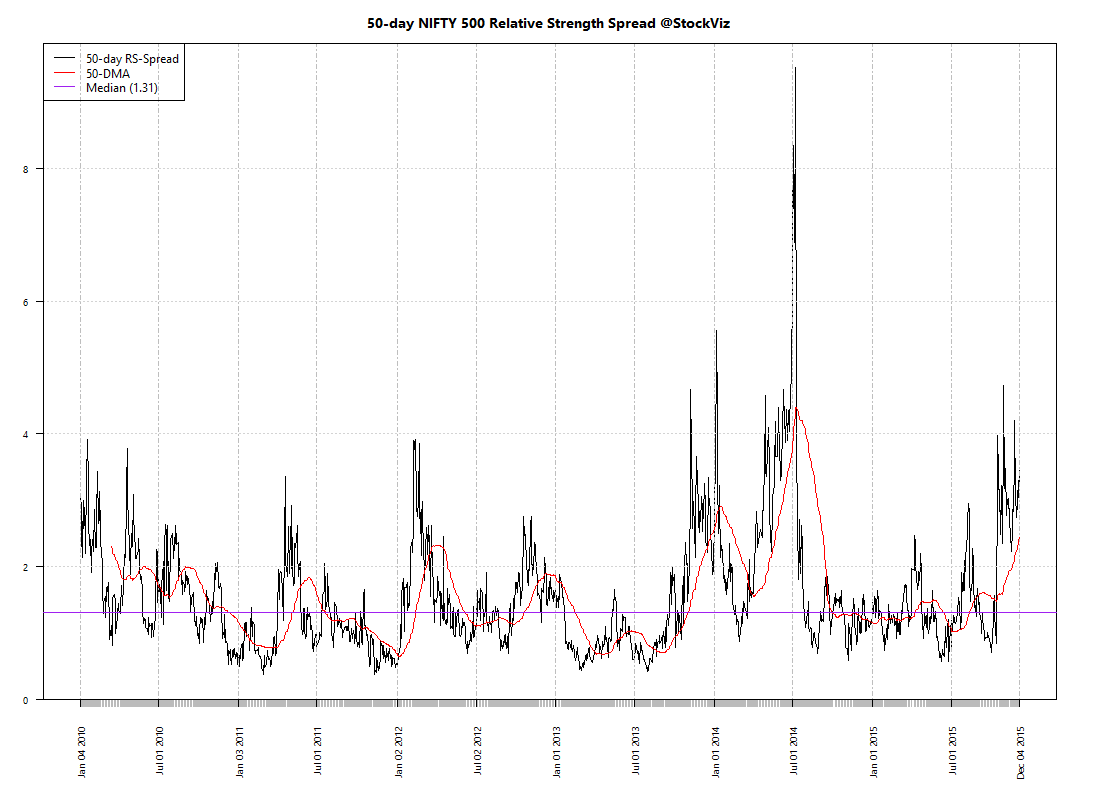
Relative Strength Spread

NIFTY_500 relative-spread-index 50 2016-01-15 png

Refactored Index Performance

50-day performance, from November 03, 2015 through January 15, 2016:

Trend Model Summary

Index Signal % From Peak Day of Peak
NIFTY AUTO LONG
17.09
2015-Jan-27
NIFTY BANK LONG
26.02
2015-Jan-27
NIFTY COMMODITIES SHORT
37.60
2008-Jan-04
NIFTY CONSUMPTION LONG
10.19
2015-Aug-05
NIFTY ENERGY SHORT
28.34
2008-Jan-14
NIFTY FIN SERVICE LONG
22.84
2015-Jan-28
NIFTY FMCG LONG
14.35
2015-Feb-25
NIFTY INFRA LONG
60.96
2008-Jan-09
NIFTY IT SHORT
88.49
2000-Feb-21
NIFTY MEDIA LONG
18.33
2008-Jan-04
NIFTY METAL LONG
70.43
2008-Jan-04
NIFTY MNC LONG
15.76
2015-Aug-10
NIFTY PHARMA LONG
18.59
2015-Apr-08
NIFTY PSE SHORT
36.99
2008-Jan-04
NIFTY PSU BANK LONG
56.98
2010-Nov-05
NIFTY REALTY LONG
91.74
2008-Jan-14
NIFTY SERV SECTOR LONG
18.49
2015-Mar-03
Pretty much every sub-index has a negative 50-day return…

Theme: Momentum Update 01.01.2016

held since returns (%)
TATAELXSI
2015-Sep-07
+27.09
CAPLIPOINT
2015-Sep-07
-3.89
GAYAPROJ
2015-Sep-07
+75.96
SANGAMIND
2015-Sep-07
+38.79
TAKE
2015-Sep-07
+55.67
JUBILANT
2015-Oct-06
+4.25
NCLIND
2015-Oct-06
+46.64
ICIL
2015-Nov-02
+23.28
SRIPIPES
2015-Nov-02
-14.51
NDL
2015-Nov-02
+14.90
LYKALABS
2015-Nov-02
+17.59
EMMBI
2015-Nov-02
+45.50
MIC
2015-Nov-02
+20.10
NAVINFLUOR
2015-Dec-01
+0.06
8KMILES
2015-Dec-01
+15.74
RAJESHEXPO
2015-Dec-01
-5.41
ISFT
2015-Dec-01
-11.55
RUSHIL
2015-Dec-01
+2.76
DEEPIND
2015-Dec-01
-12.05
ESTER
2015-Dec-01
-2.57
Since the last rebalance on 2015-Dec-01 till 2015-Dec-31, this strategy has returned -0.40%

You can find more details about the Momentum Theme here.

Index Update 19.12.2015

MOMENTUM

We run our proprietary momentum scoring algorithm on indices just like we do on stocks. You can use the momentum scores of sub-indices to get a sense for which sectors have the wind on their backs and those that are facing headwinds.

Traders can pick their longs in sectors with high short-term momentum and their shorts in sectors with low momentum. Investors can use the longer lookback scores to position themselves using our re-factored index Themes.

You can see how the momentum algorithm has performed on individual stocks here.

Here are the best and the worst sub-indices:
index momentum best 365 2015-12-18 png

index momentum best 50 2015-12-18 png

index momentum worst 365 2015-12-18 png

index momentum worst 50 2015-12-18 png

Relative Strength Spread

NIFTY_500 relative-spread-index 50 2015-12-18 png

Refactored Index Performance

50-day performance, from October 06, 2015 through December 18, 2015:

Trend Model Summary

Index Signal % From Peak Day of Peak
NIFTY AUTO SHORT
11.21
2015-Jan-27
NIFTY BANK LONG
19.27
2015-Jan-27
NIFTY COMMODITIES SHORT
36.24
2008-Jan-04
NIFTY CONSUMPTION SHORT
5.41
2015-Aug-05
NIFTY ENERGY LONG
31.09
2008-Jan-14
NIFTY FIN SERVICE SHORT
16.66
2015-Jan-28
NIFTY FMCG SHORT
11.13
2015-Feb-25
NIFTY INFRA SHORT
57.24
2008-Jan-09
NIFTY IT SHORT
88.35
2000-Feb-21
NIFTY MEDIA LONG
15.34
2008-Jan-04
NIFTY METAL LONG
67.73
2008-Jan-04
NIFTY MNC LONG
10.02
2015-Aug-10
NIFTY PHARMA LONG
15.67
2015-Apr-08
NIFTY PSE LONG
35.76
2008-Jan-04
NIFTY PSU BANK LONG
45.99
2010-Nov-05
NIFTY REALTY LONG
91.07
2008-Jan-14
NIFTY SERV SECTOR SHORT
14.23
2015-Mar-03
Auto and Pharma – the darlings of days past.

Index Update 12.12.2015

MOMENTUM

We run our proprietary momentum scoring algorithm on indices just like we do on stocks. You can use the momentum scores of sub-indices to get a sense for which sectors have the wind on their backs and those that are facing headwinds.

Traders can pick their longs in sectors with high short-term momentum and their shorts in sectors with low momentum. Investors can use the longer lookback scores to position themselves using our re-factored index Themes.

You can see how the momentum algorithm has performed on individual stocks here.

Here are the best and the worst sub-indices:
index momentum best 365 2015-12-11 png

index momentum best 50 2015-12-11 png

index momentum worst 365 2015-12-11 png

index momentum worst 50 2015-12-11 png

Relative Strength Spread

NIFTY_500 relative-spread-index 50 2015-12-11 png

Refactored Index Performance

50-day performance, from September 28, 2015 through December 11, 2015:

Trend Model Summary

Index Signal % From Peak Day of Peak
NIFTY AUTO LONG
12.71
2015-Jan-27
NIFTY BANK LONG
20.49
2015-Jan-27
NIFTY COMMODITIES LONG
38.18
2008-Jan-04
NIFTY CONSUMPTION LONG
7.56
2015-Aug-05
NIFTY ENERGY LONG
33.38
2008-Jan-14
NIFTY FIN SERVICE LONG
18.47
2015-Jan-28
NIFTY FMCG LONG
11.98
2015-Feb-25
NIFTY INFRA LONG
58.43
2008-Jan-09
NIFTY IT SHORT
88.44
2000-Feb-21
NIFTY MEDIA SHORT
19.15
2008-Jan-04
NIFTY METAL LONG
69.06
2008-Jan-04
NIFTY MNC LONG
12.51
2015-Aug-10
NIFTY PHARMA SHORT
17.70
2015-Apr-08
NIFTY PSE LONG
37.51
2008-Jan-04
NIFTY PSU BANK LONG
46.32
2010-Nov-05
NIFTY REALTY LONG
91.37
2008-Jan-14
NIFTY SERV SECTOR LONG
16.10
2015-Mar-03
All eyes on the Fed…

Index Update 05.12.2015

MOMENTUM

We run our proprietary momentum scoring algorithm on indices just like we do on stocks. You can use the momentum scores of sub-indices to get a sense for which sectors have the wind on their backs and those that are facing headwinds.

Traders can pick their longs in sectors with high short-term momentum and their shorts in sectors with low momentum. Investors can use the longer lookback scores to position themselves using our re-factored index Themes.

You can see how the momentum algorithm has performed on individual stocks here.

Here are the best and the worst sub-indices:
index momentum best 365 2015-12-04 png

index momentum best 50 2015-12-04 png

index momentum worst 365 2015-12-04 png

index momentum worst 50 2015-12-04 png

Relative Strength Spread

NIFTY_500 relative-spread-index 50 2015-12-04 png

Refactored Index Performance

50-day performance, from September 18, 2015 through December 04, 2015:

Trend Model Summary

Index Signal % From Peak Day of Peak
NIFTY AUTO SHORT
9.44
2015-Jan-27
NIFTY BANK SHORT
17.80
2015-Jan-27
NIFTY COMMODITIES SHORT
35.95
2008-Jan-04
NIFTY CONSUMPTION SHORT
5.81
2015-Aug-05
NIFTY ENERGY SHORT
31.97
2008-Jan-14
NIFTY FIN SERVICE SHORT
16.57
2015-Jan-28
NIFTY FMCG SHORT
9.90
2015-Feb-25
NIFTY INFRA SHORT
56.92
2008-Jan-09
NIFTY IT SHORT
88.51
2000-Feb-21
NIFTY MEDIA LONG
18.62
2008-Jan-04
NIFTY METAL LONG
67.66
2008-Jan-04
NIFTY MNC SHORT
11.10
2015-Aug-10
NIFTY PHARMA SHORT
15.81
2015-Apr-08
NIFTY PSE SHORT
35.06
2008-Jan-04
NIFTY PSU BANK LONG
42.61
2010-Nov-05
NIFTY REALTY LONG
90.84
2008-Jan-14
NIFTY SERV SECTOR SHORT
14.66
2015-Mar-03
NIFTY MNC has been trailing lately. Is the trade overdone?