MOMENTUM
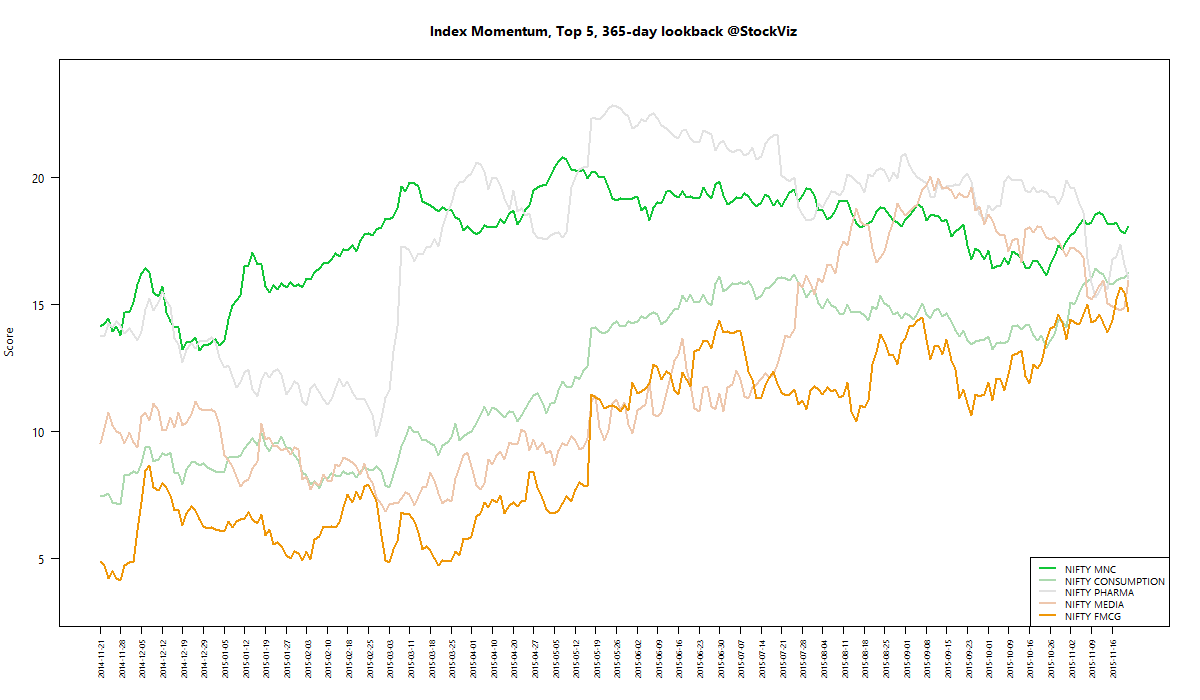
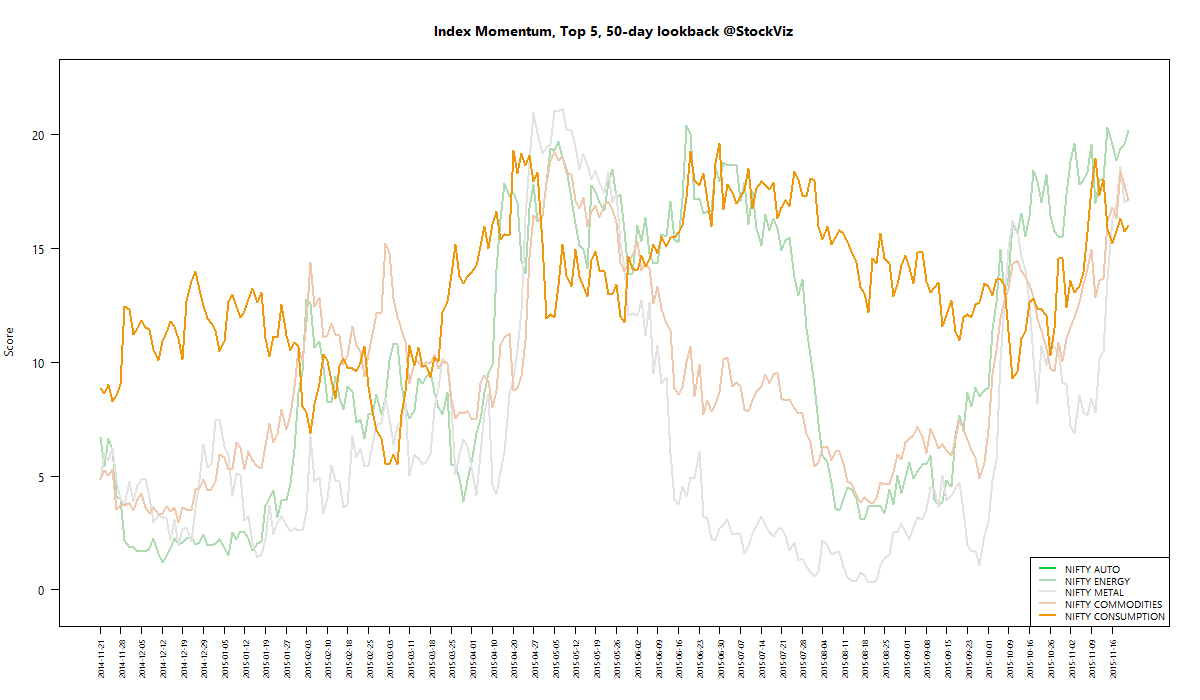
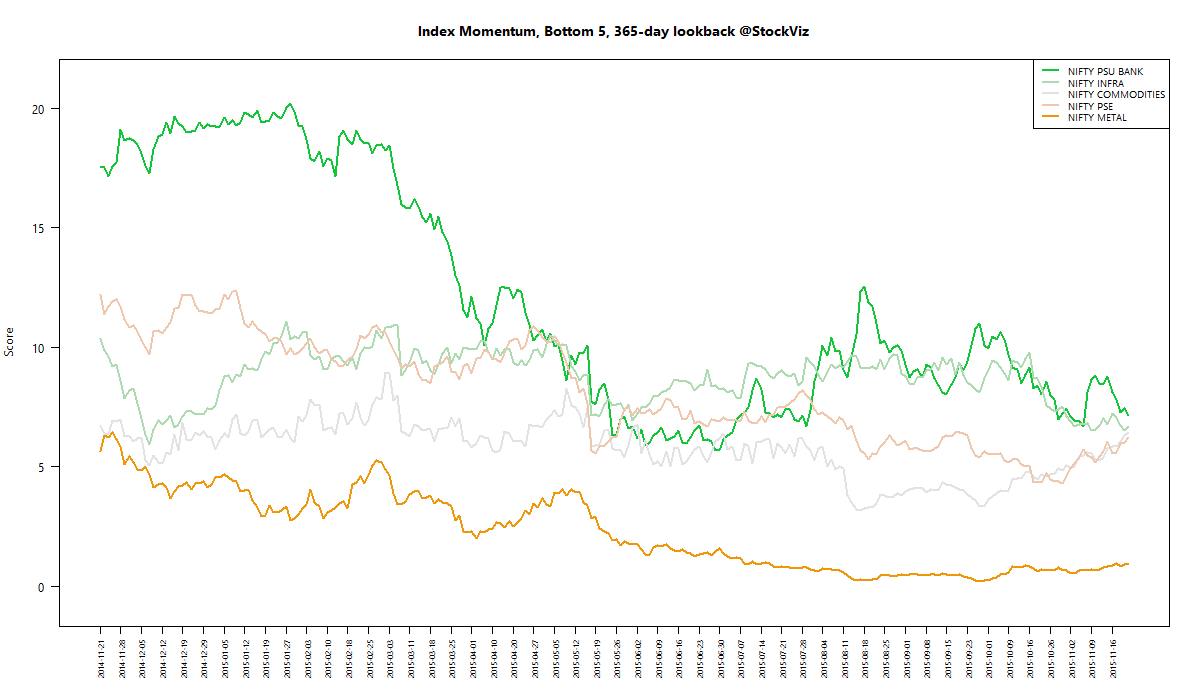
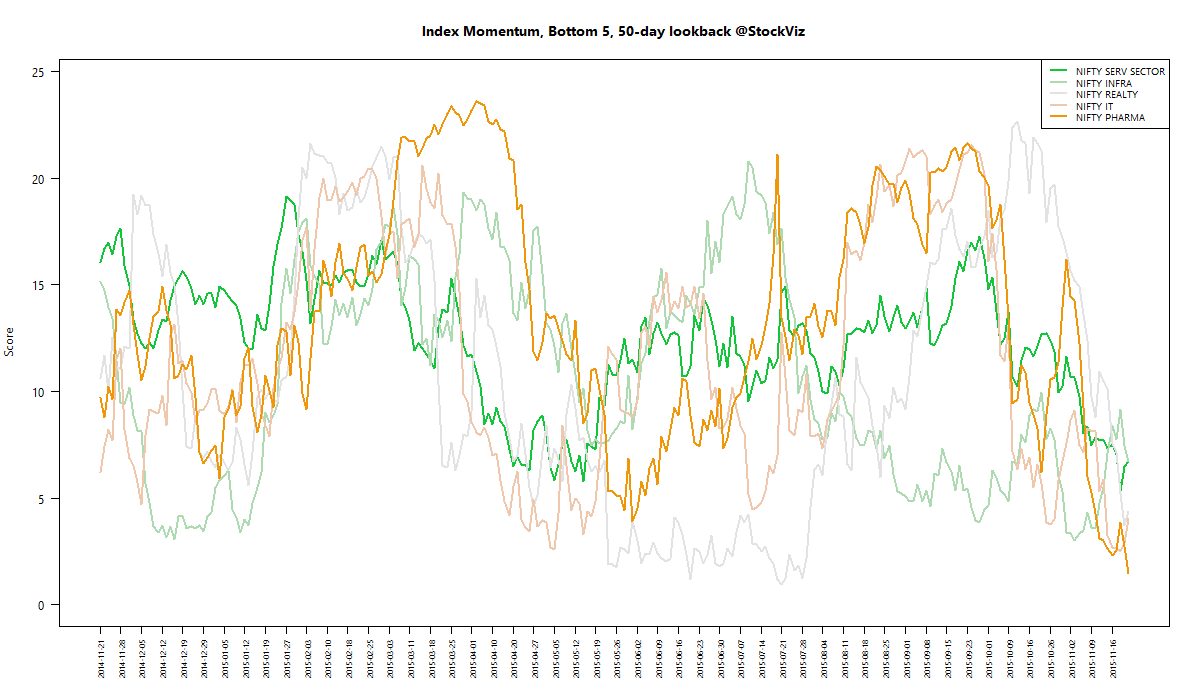
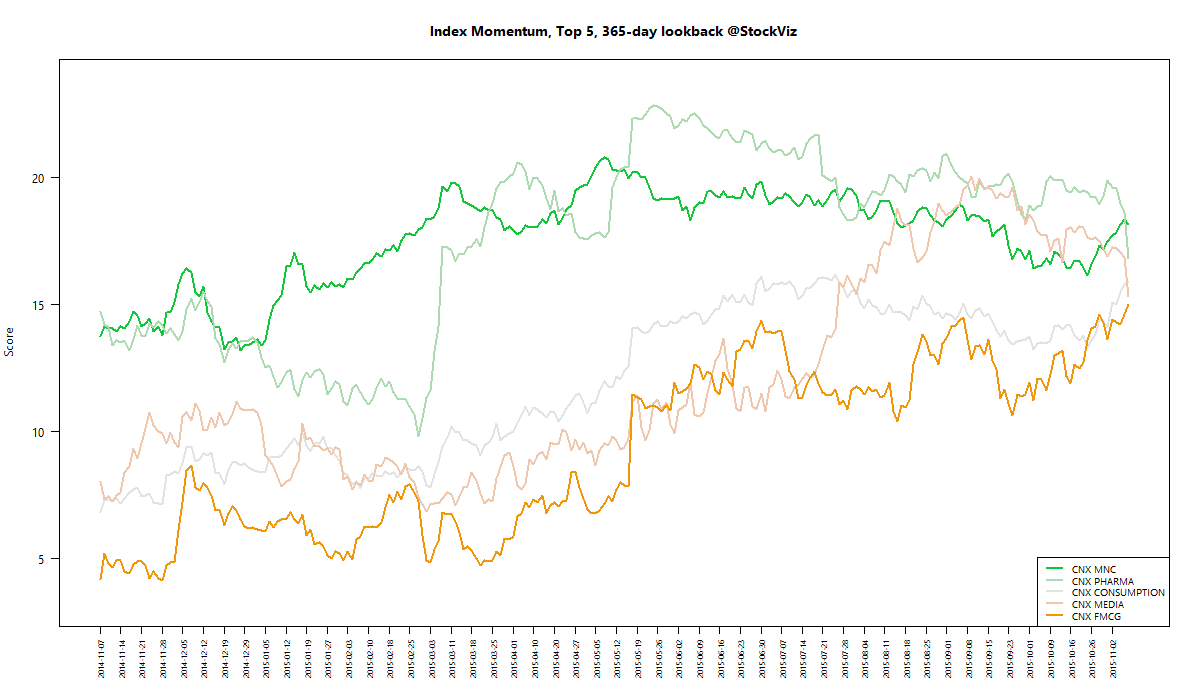
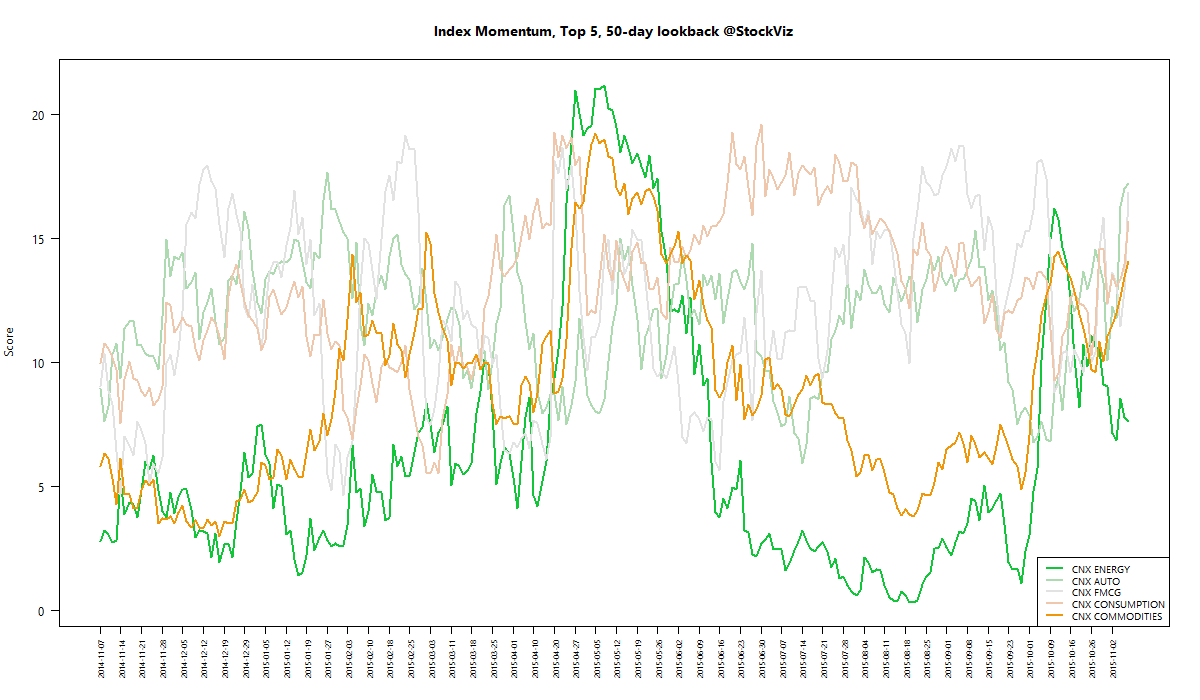
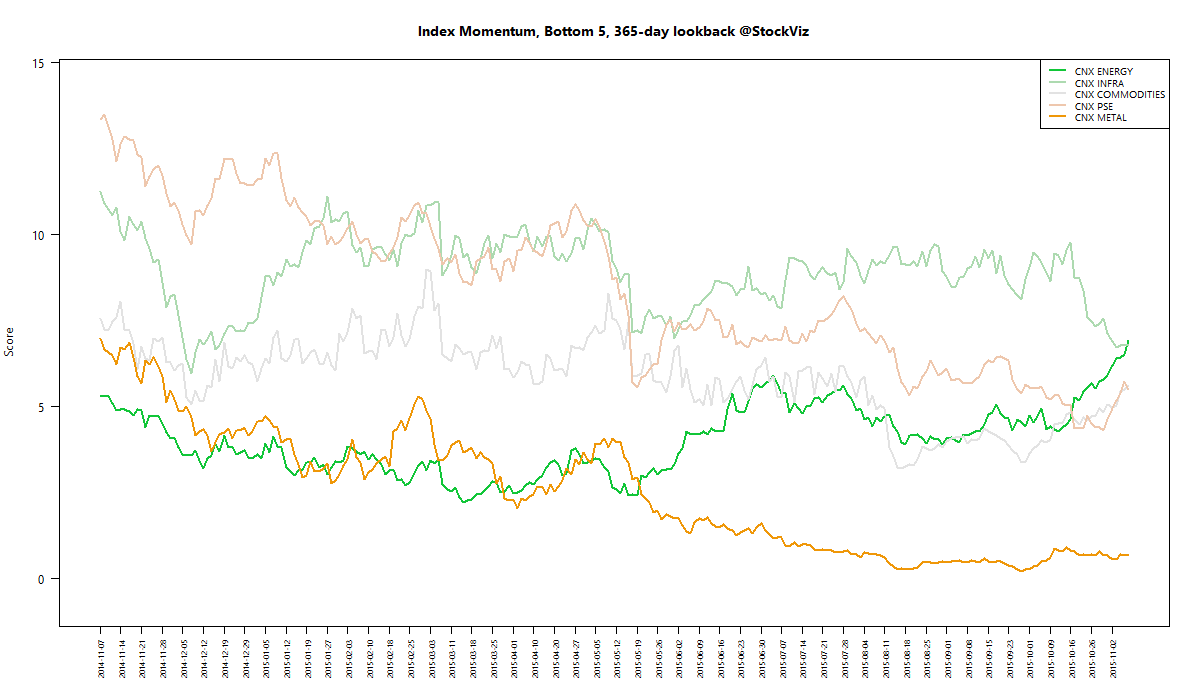
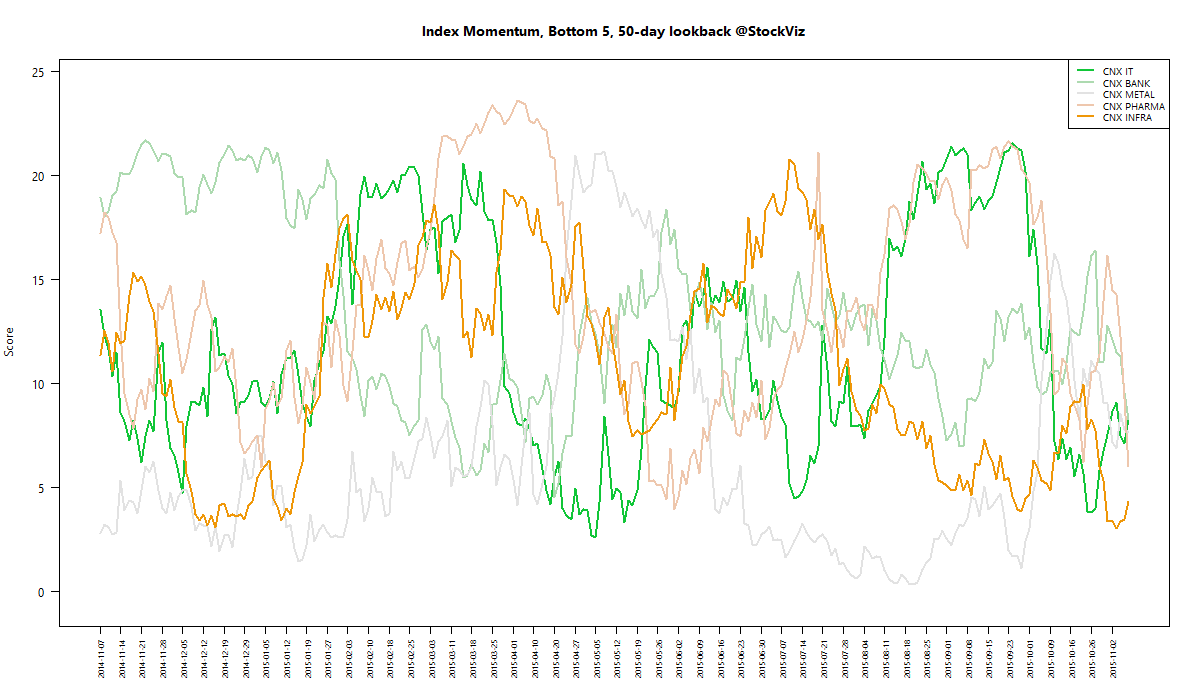
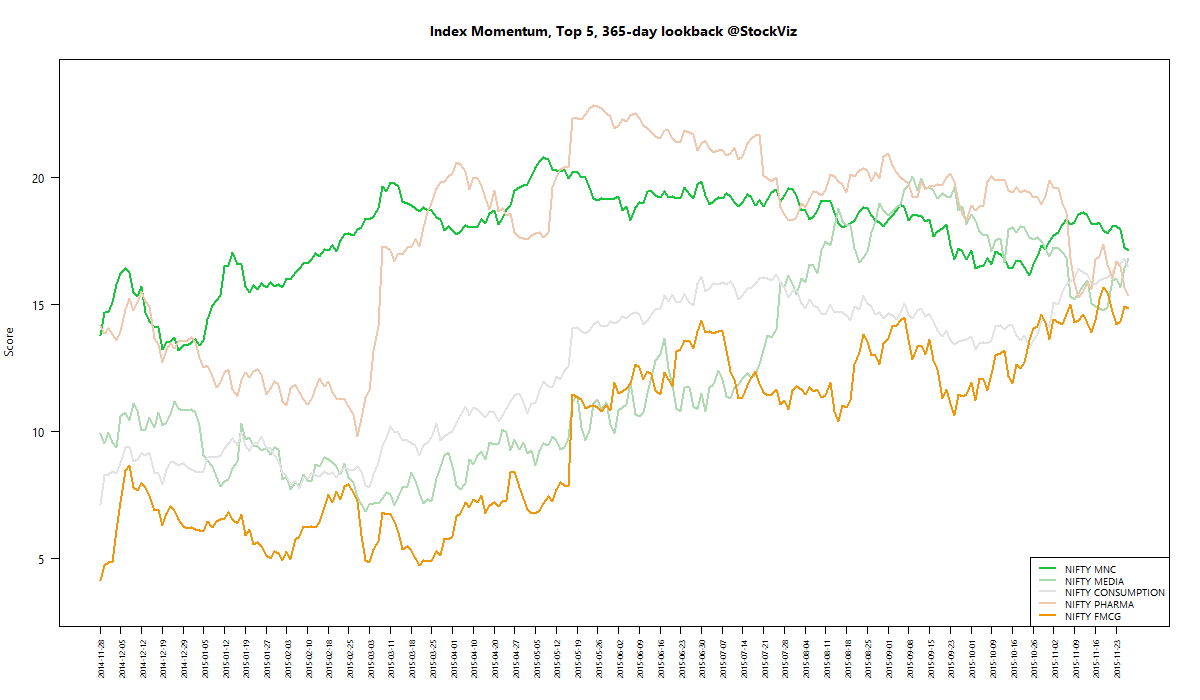
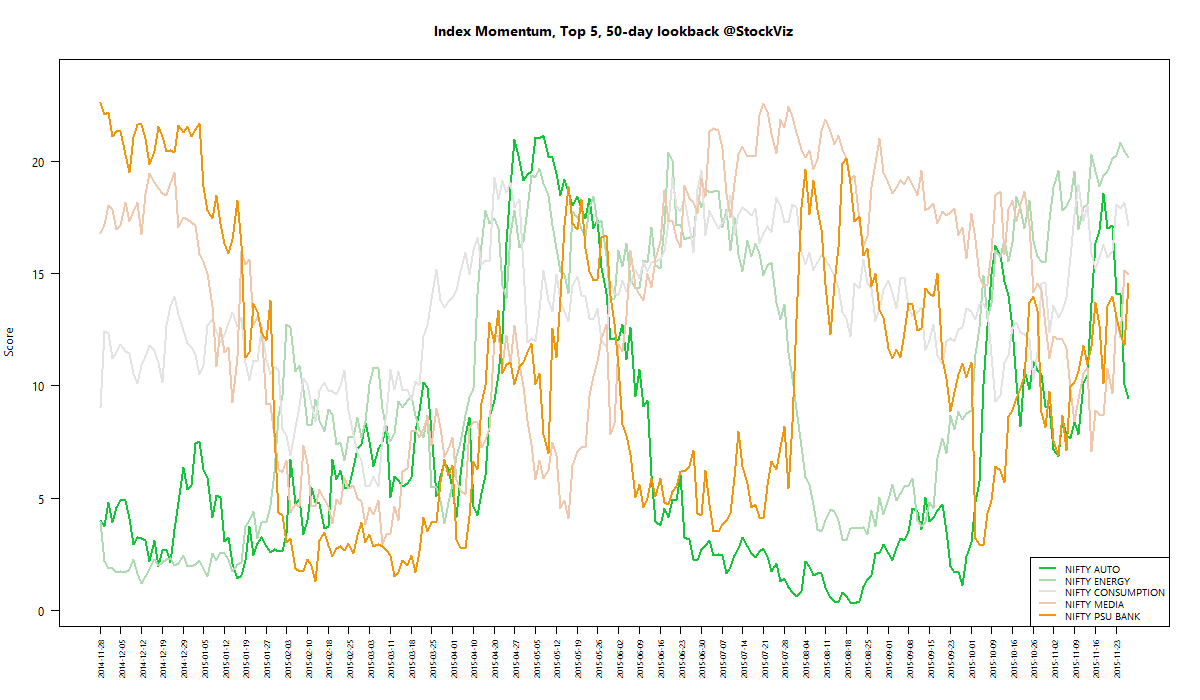
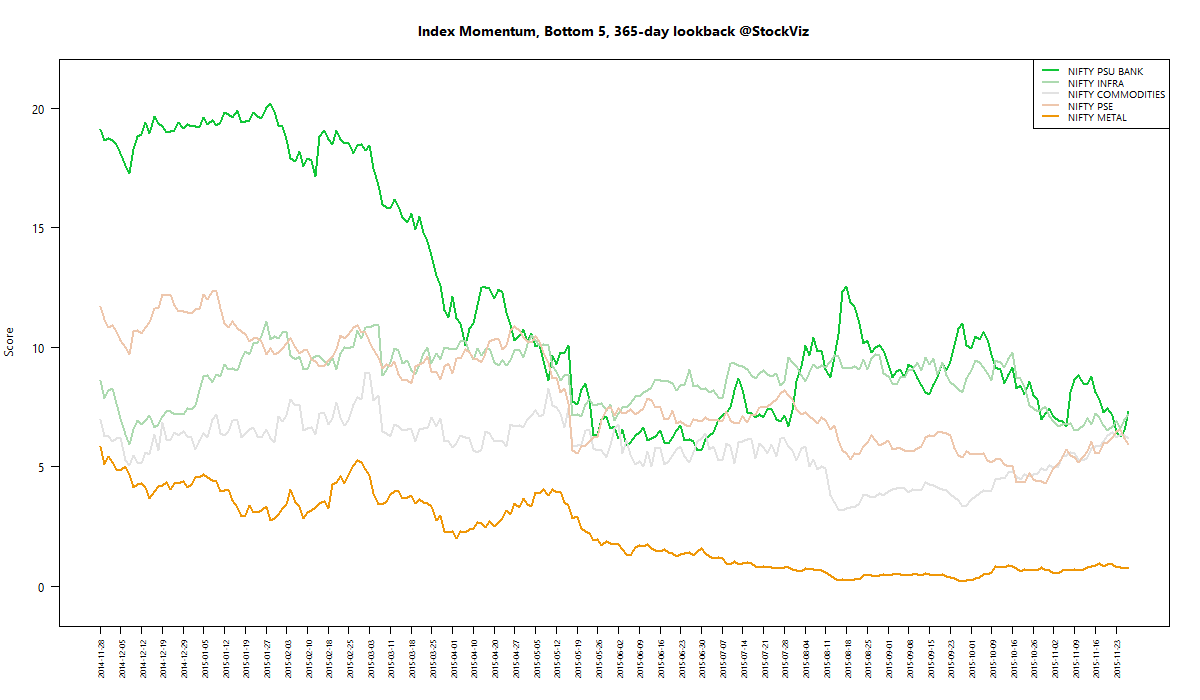
We run our proprietary momentum scoring algorithm on indices just like we do on stocks. You can use the momentum scores of sub-indices to get a sense for which sectors have the wind on their backs and those that are facing headwinds.
Traders can pick their longs in sectors with high short-term momentum and their shorts in sectors with low momentum. Investors can use the longer lookback scores to position themselves using our re-factored index Themes.
You can see how the momentum algorithm has performed on individual stocks here.
Here are the best and the worst sub-indices:

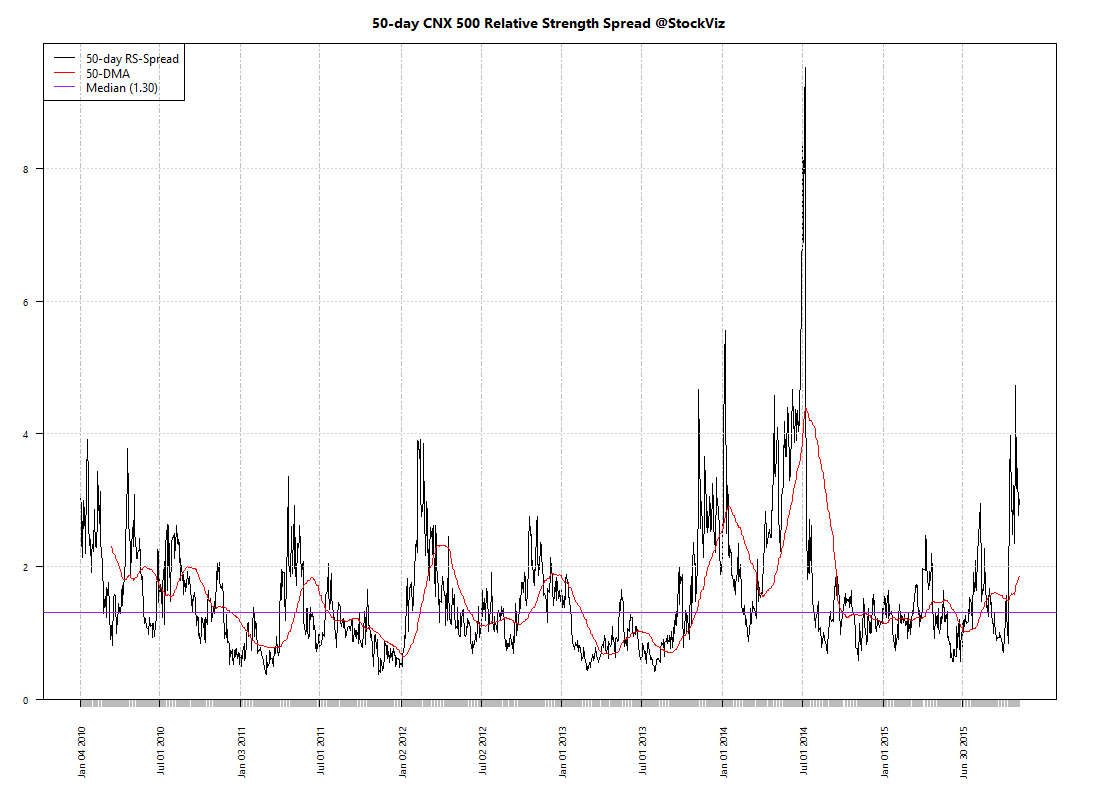
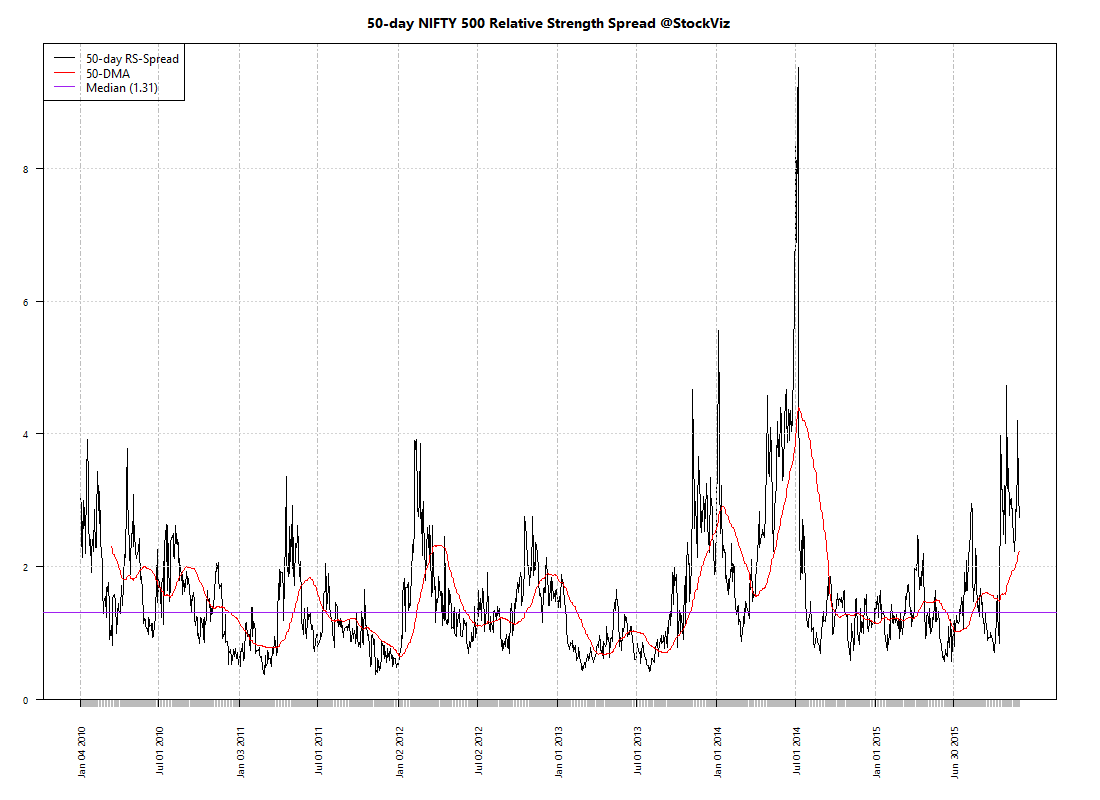
Relative Strength Spread
Refactored Index Performance
50-day performance, from September 10, 2015 through November 27, 2015:
Trend Model Summary
| Index | Signal | % From Peak | Day of Peak |
|---|---|---|---|
| NIFTY AUTO | LONG |
7.21
|
2015-Jan-27
|
| NIFTY BANK | SHORT |
15.49
|
2015-Jan-27
|
| NIFTY COMMODITIES | SHORT |
35.90
|
2008-Jan-04
|
| NIFTY CONSUMPTION | LONG |
4.30
|
2015-Aug-05
|
| NIFTY ENERGY | LONG |
31.03
|
2008-Jan-14
|
| NIFTY FIN SERVICE | SHORT |
13.83
|
2015-Jan-28
|
| NIFTY FMCG | SHORT |
8.34
|
2015-Feb-25
|
| NIFTY INFRA | SHORT |
55.79
|
2008-Jan-09
|
| NIFTY IT | SHORT |
88.35
|
2000-Feb-21
|
| NIFTY MEDIA | LONG |
17.55
|
2008-Jan-04
|
| NIFTY METAL | SHORT |
68.40
|
2008-Jan-04
|
| NIFTY MNC | SHORT |
10.52
|
2015-Aug-10
|
| NIFTY PHARMA | SHORT |
16.37
|
2015-Apr-08
|
| NIFTY PSE | SHORT |
34.30
|
2008-Jan-04
|
| NIFTY PSU BANK | SHORT |
40.16
|
2010-Nov-05
|
| NIFTY REALTY | SHORT |
90.89
|
2008-Jan-14
|
| NIFTY SERV SECTOR | SHORT |
12.35
|
2015-Mar-03
|
Large RS-Spreads are a net positive to active strategies. The past week saw Quality to Price post over +250% and Momentum post over +200% gains since their inception in August 2013.