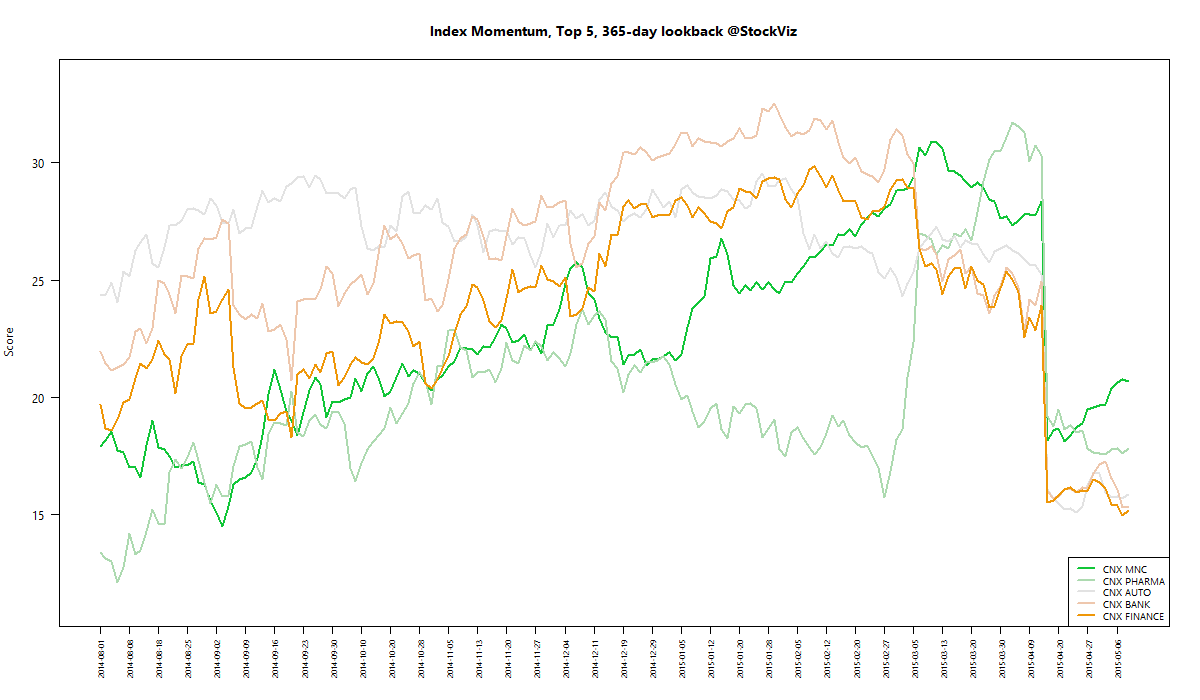
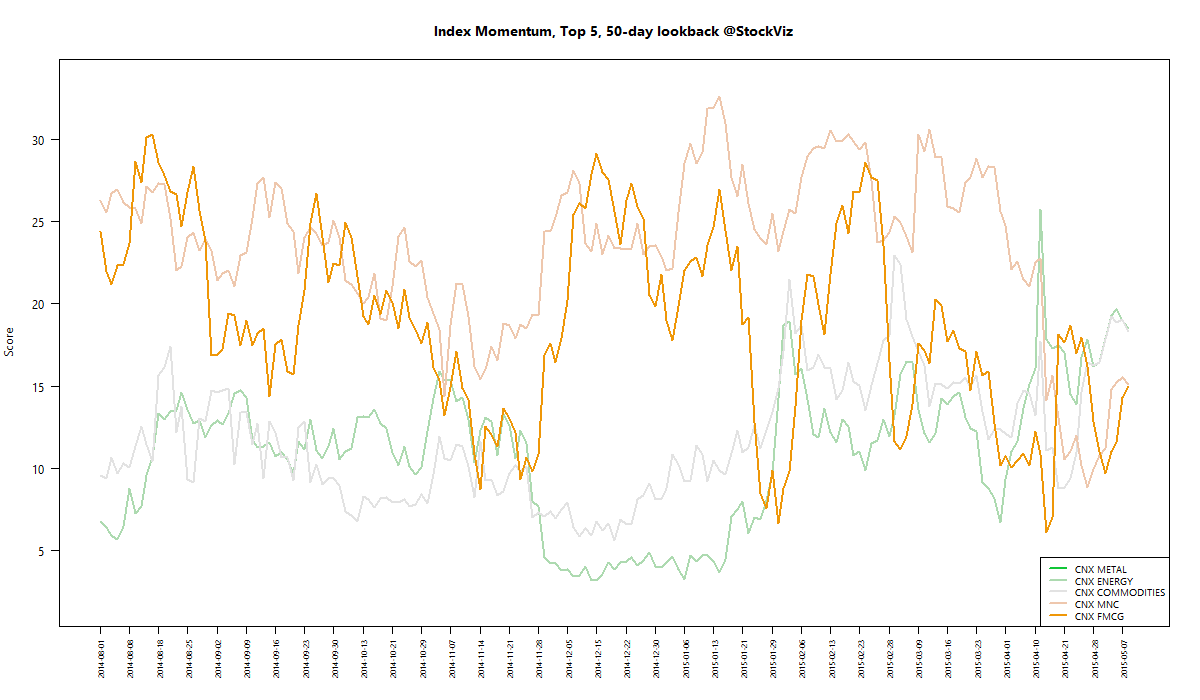
MOMENTUM
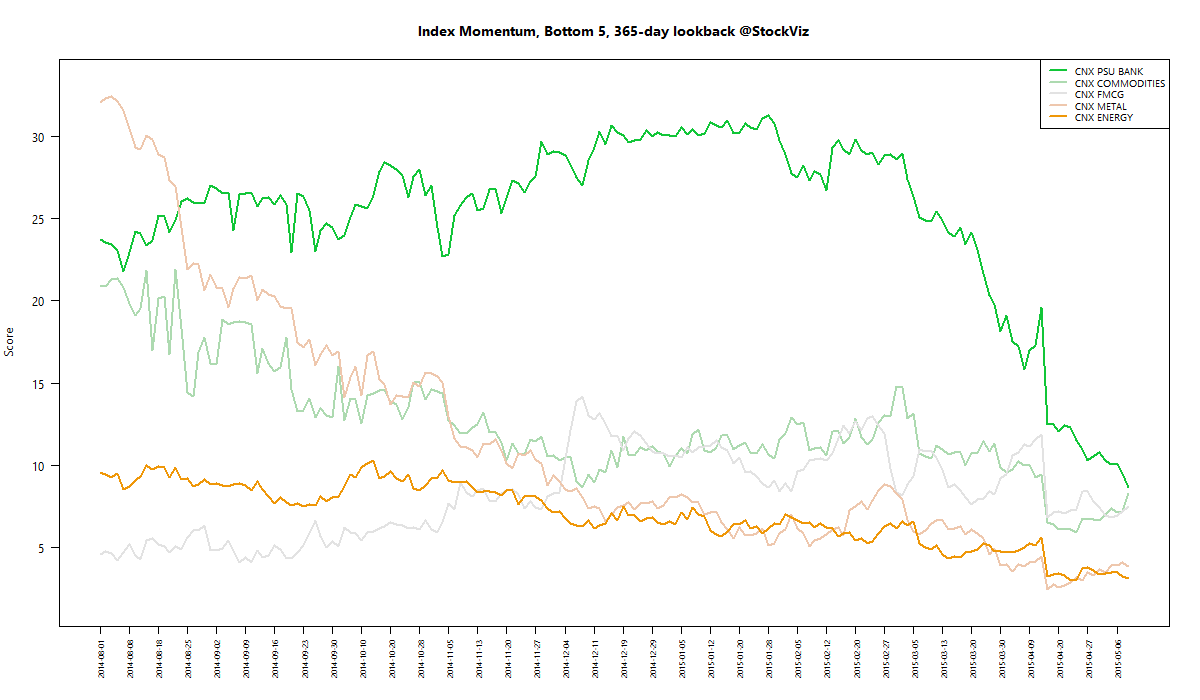
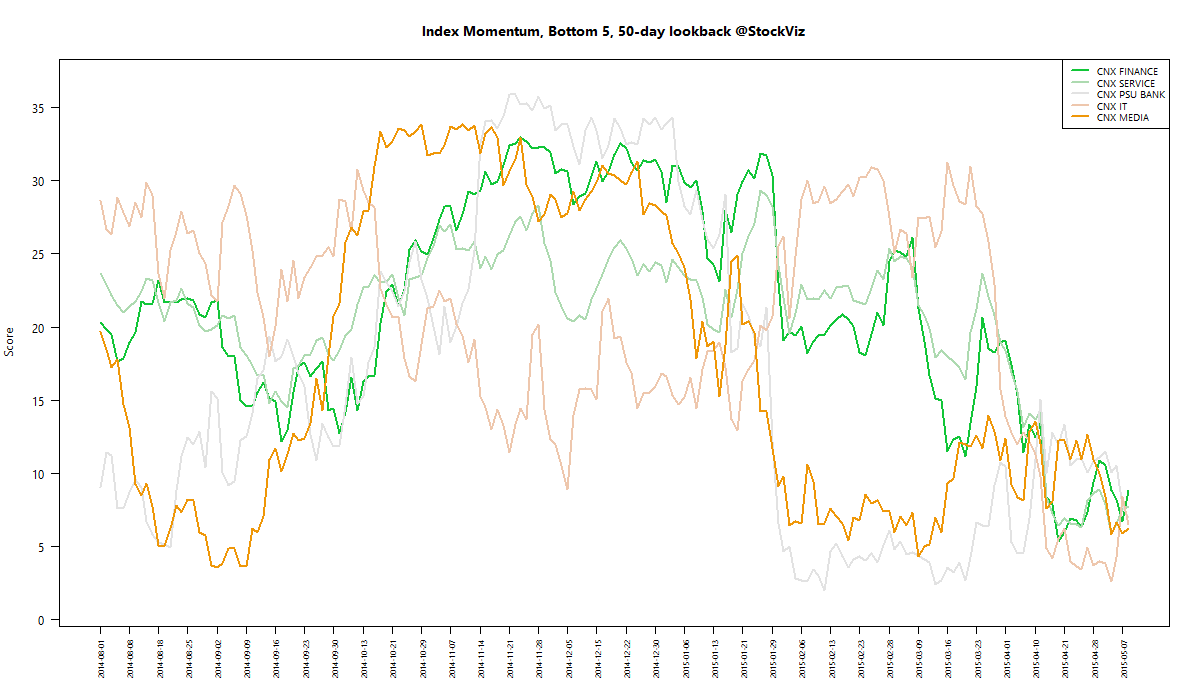
We run our proprietary momentum scoring algorithm on indices just like we do on stocks. You can use the momentum scores of sub-indices to get a sense for which sectors have the wind on their backs and those that are facing headwinds.
Traders can pick their longs in sectors with high short-term momentum and their shorts in sectors with low momentum. Investors can use the longer lookback scores to position themselves using our re-factored index Themes.
You can see how the momentum algorithm has performed on individual stocks here.
Here are the best and the worst sub-indices:
Refactored Index Performance
50-day performance, from February 24, 2015 through May 08, 2015:
Trend Model Summary
| Index | Signal | % From Peak | Day of Peak |
|---|---|---|---|
| CNX AUTO | SHORT |
9.89
|
2015-Jan-27
|
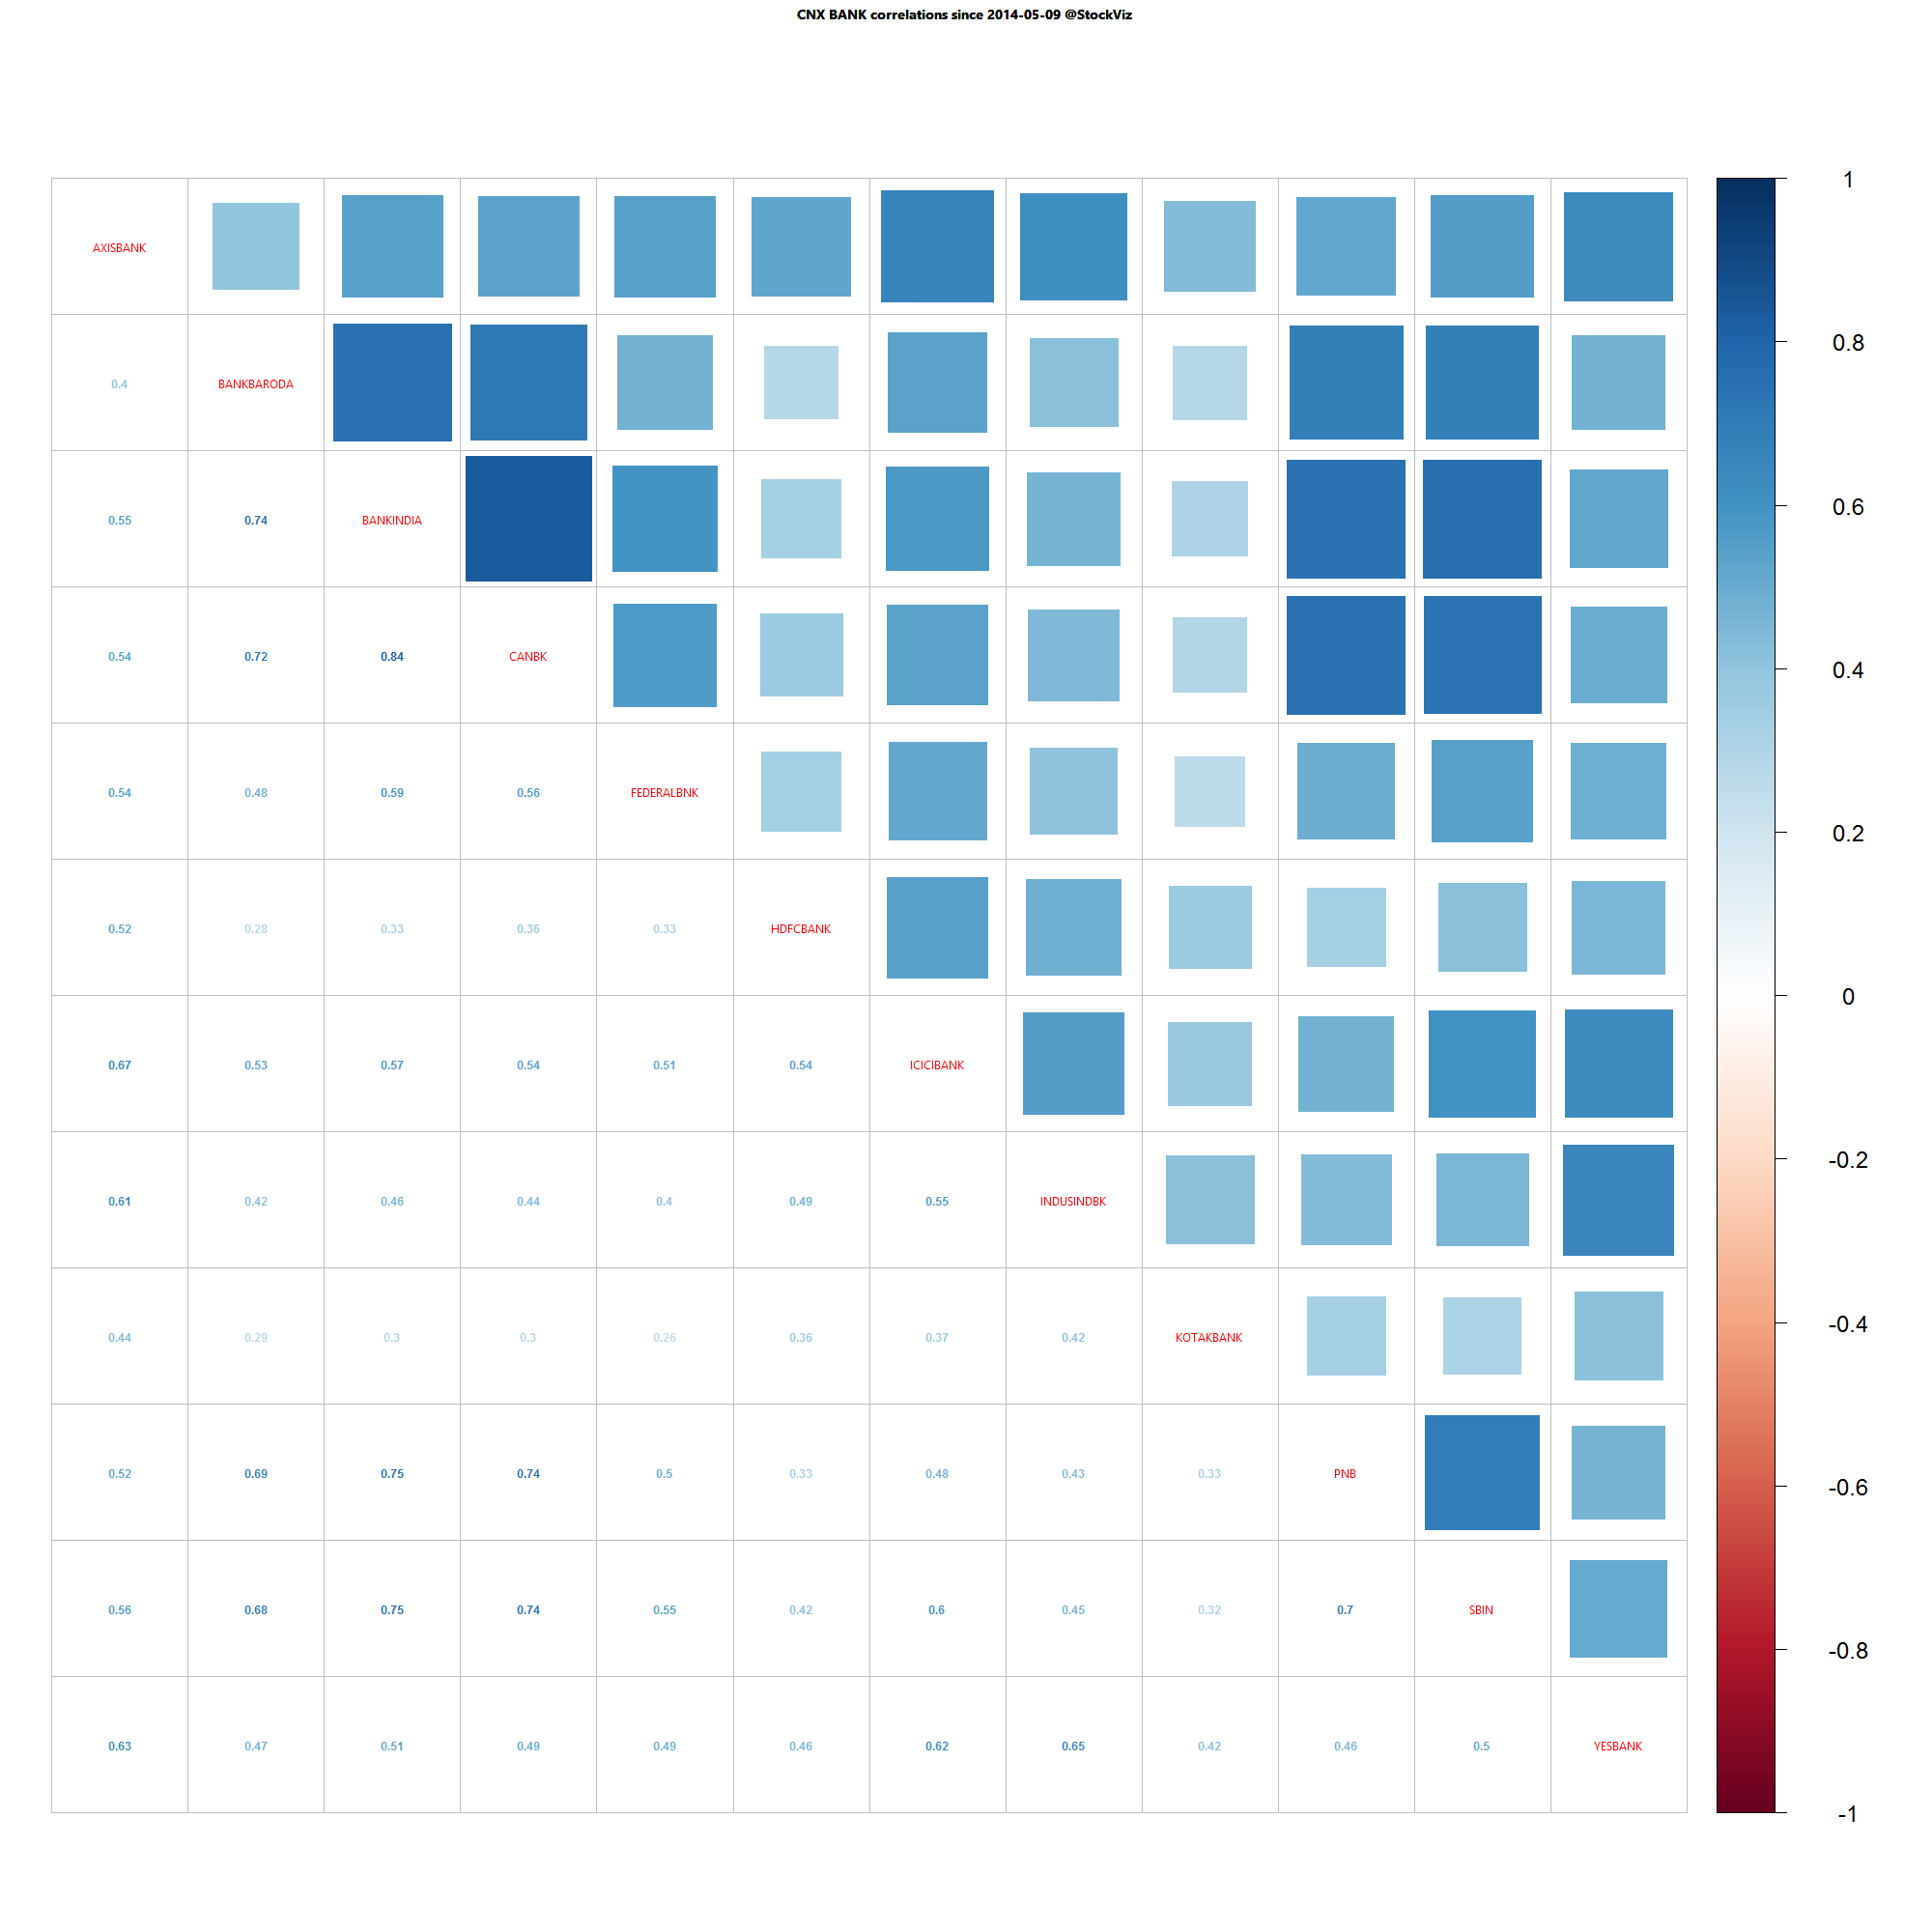
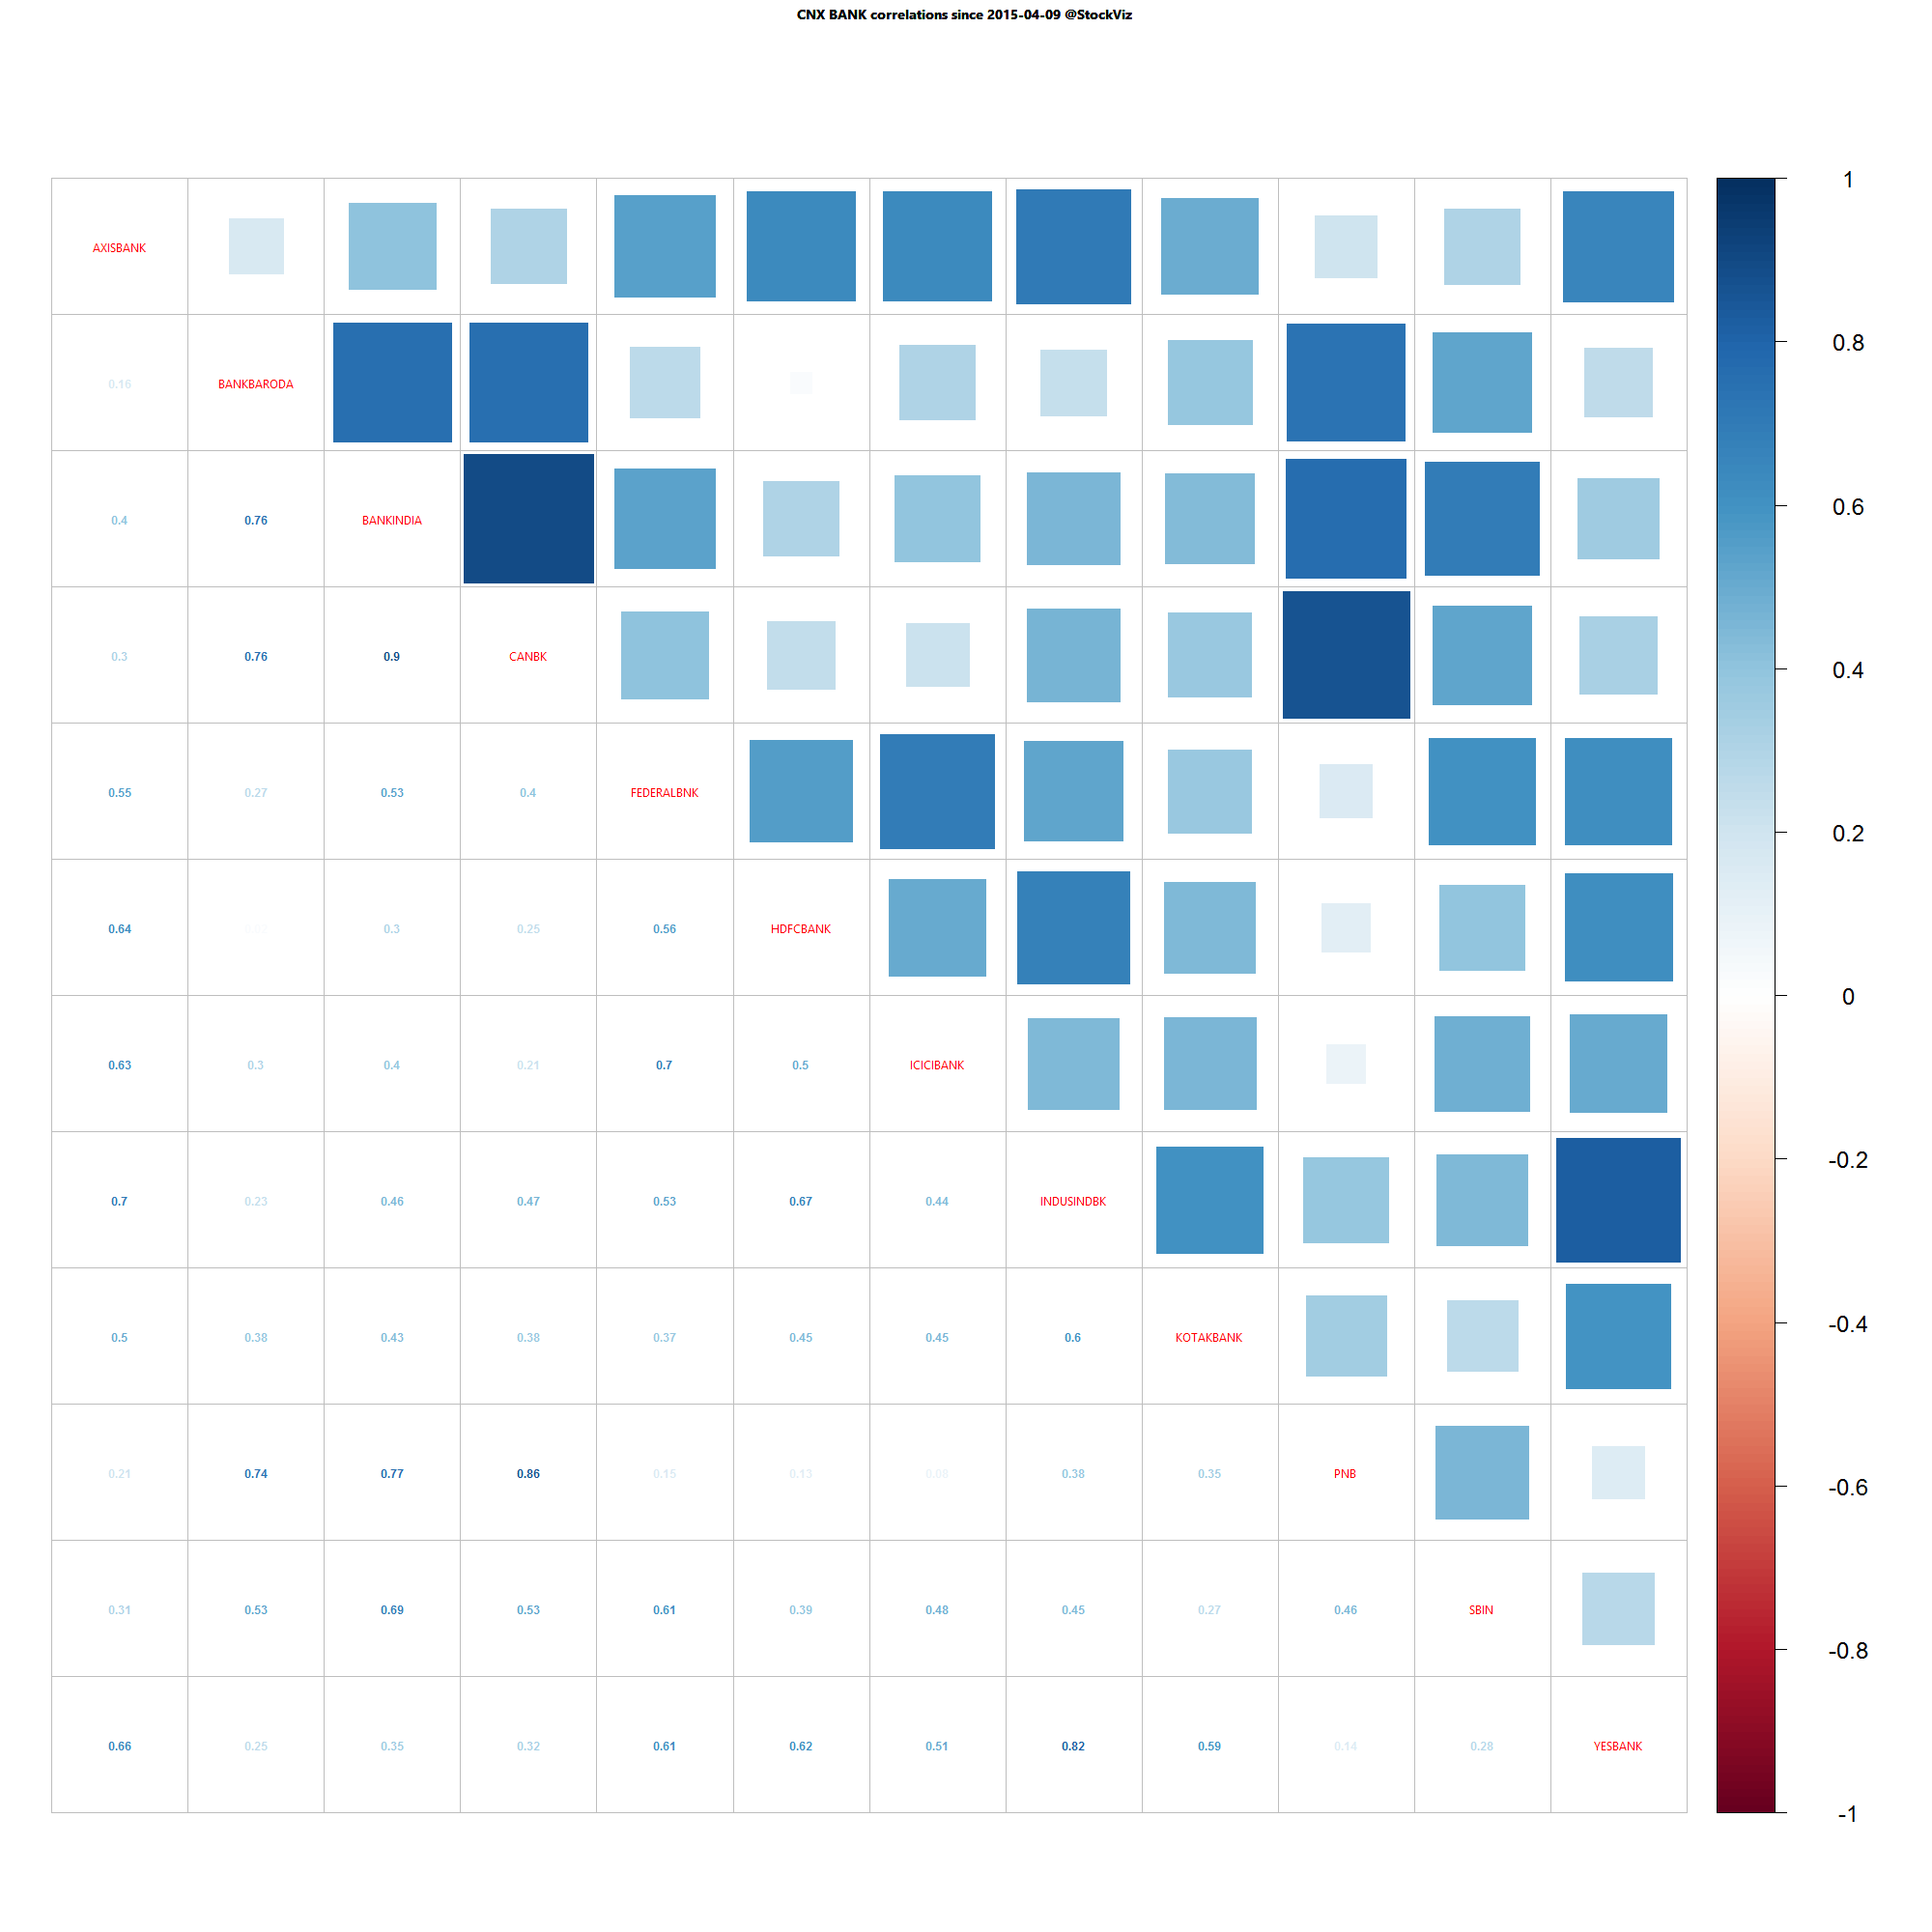
| CNX BANK | SHORT |
13.42
|
2015-Jan-27
|
| CNX ENERGY | SHORT |
30.10
|
2008-Jan-14
|
| CNX FMCG | SHORT |
10.93
|
2015-Feb-25
|
| CNX INFRA | SHORT |
50.20
|
2008-Jan-09
|
| CNX IT | SHORT |
88.30
|
2000-Feb-21
|
| CNX MEDIA | SHORT |
30.20
|
2008-Jan-04
|
| CNX METAL | SHORT |
55.67
|
2008-Jan-04
|
| CNX MNC | SHORT |
5.36
|
2015-Mar-12
|
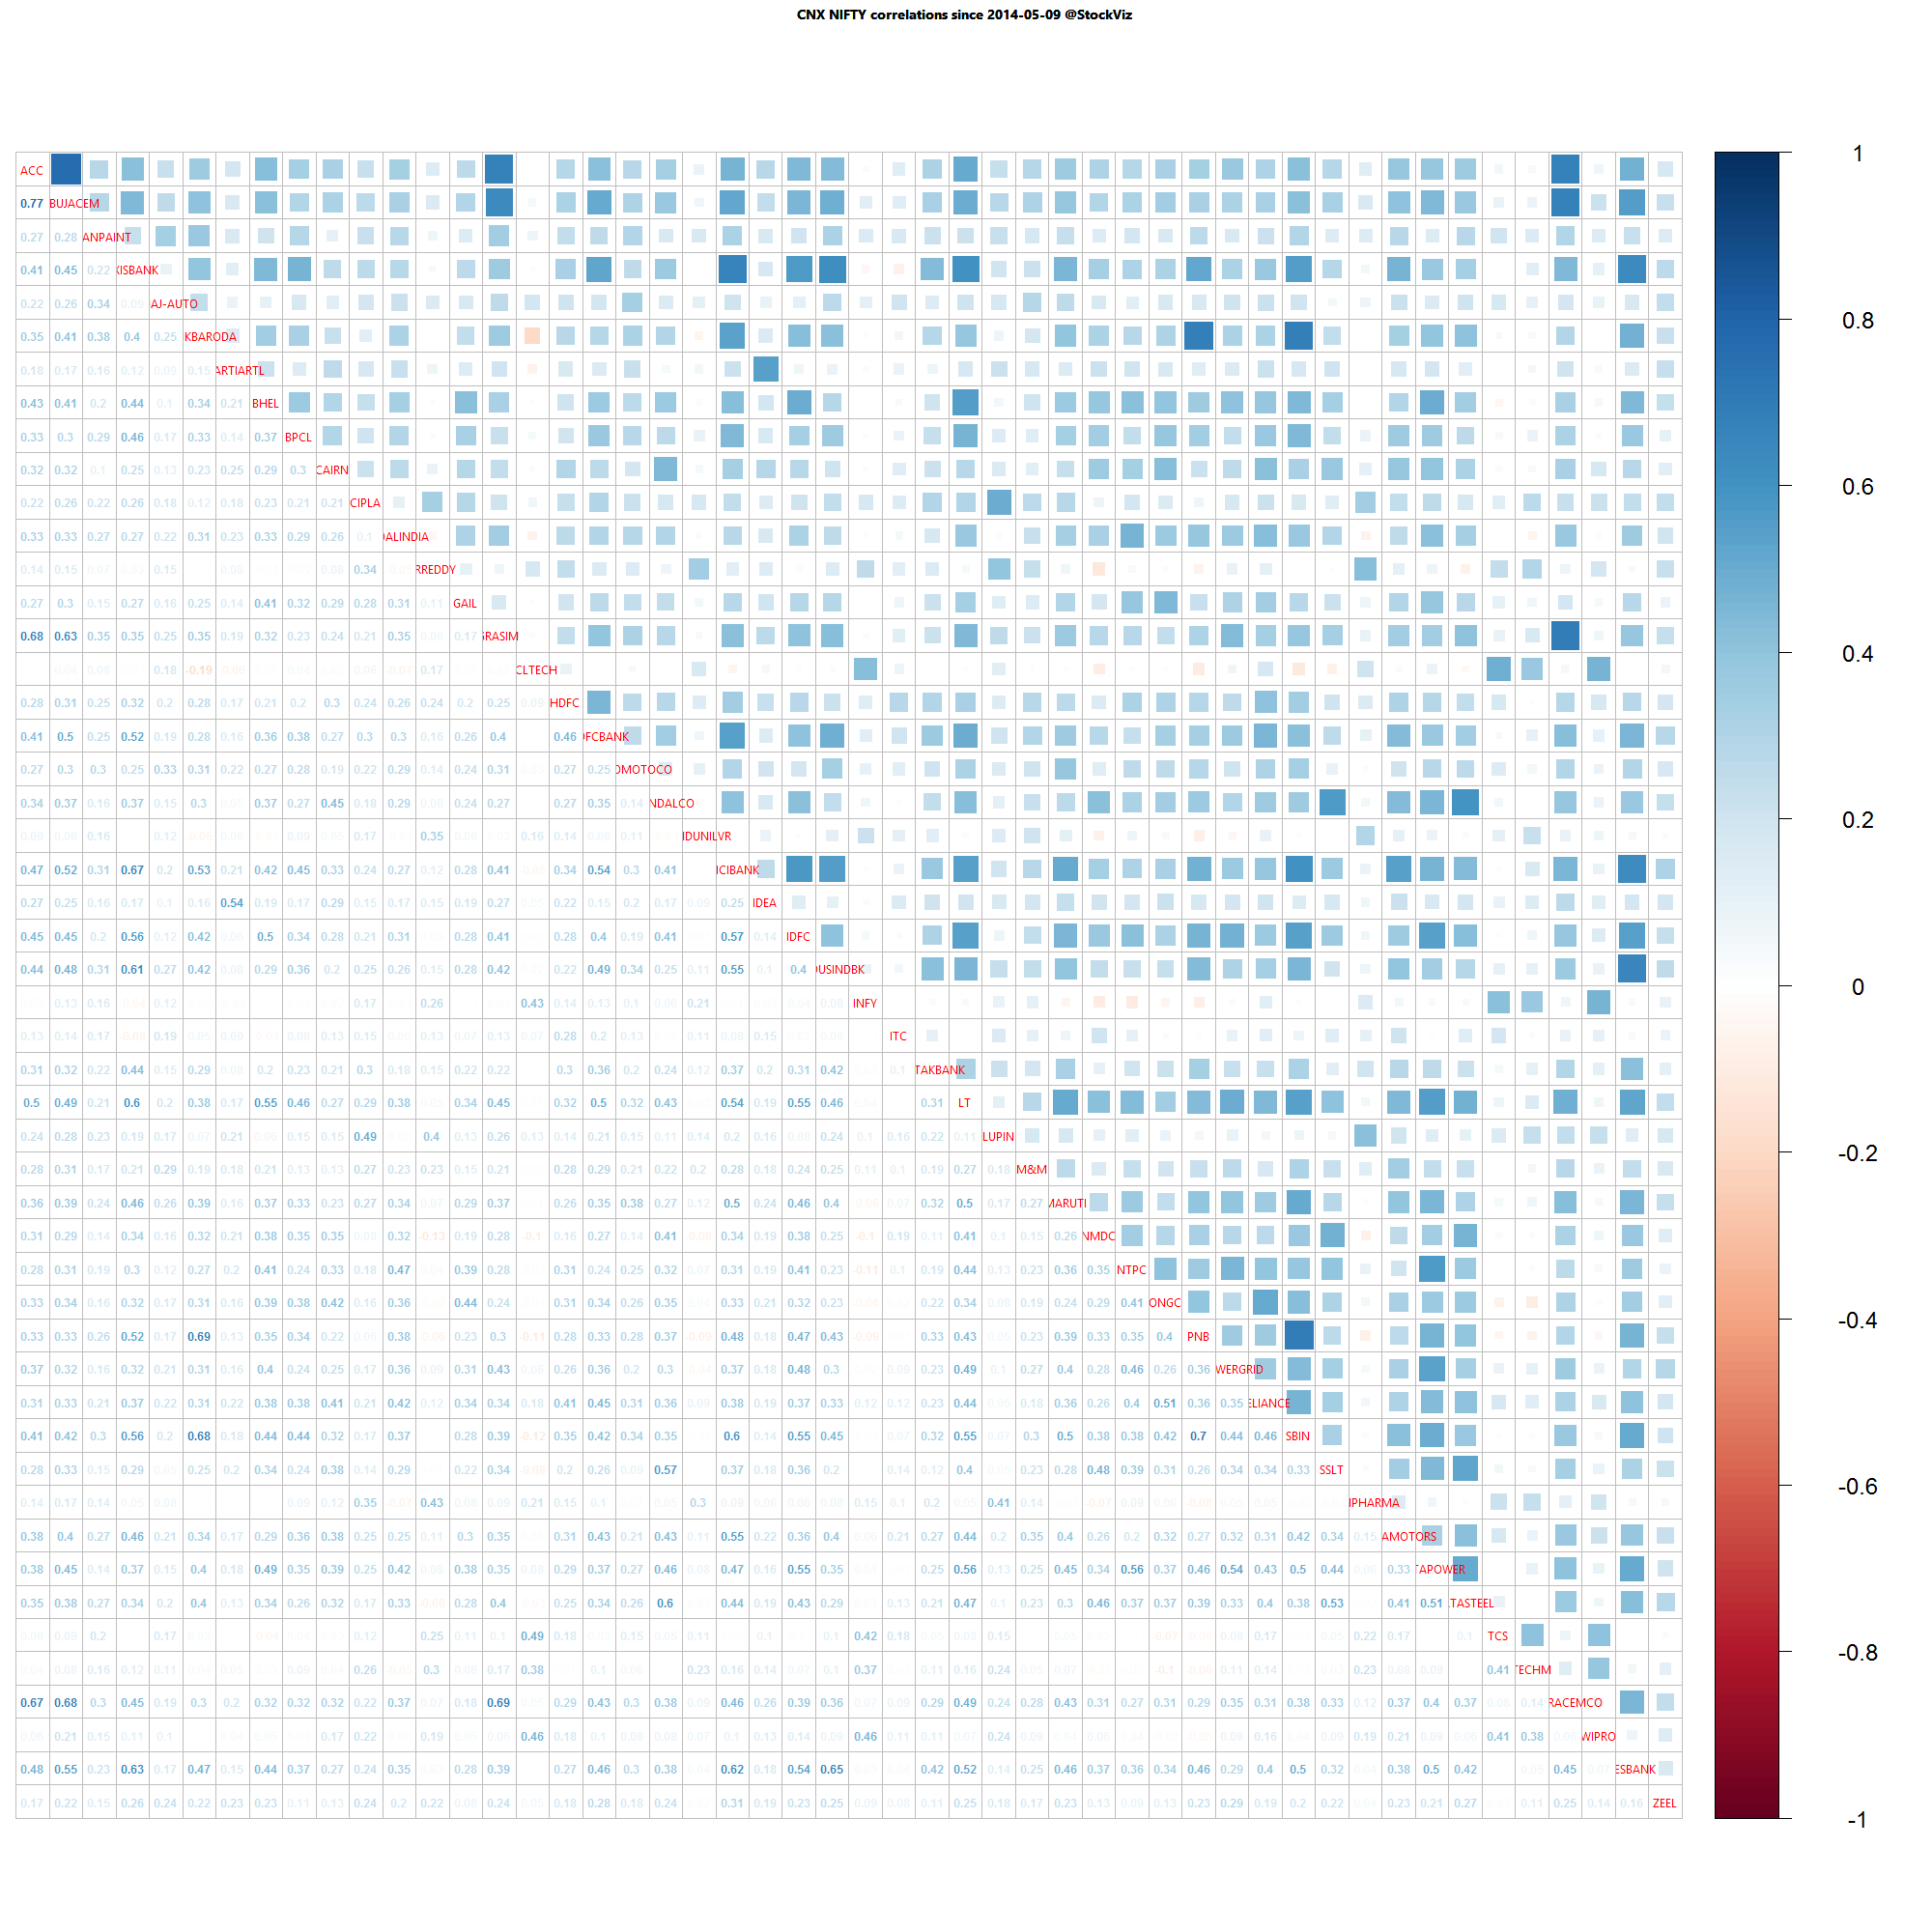
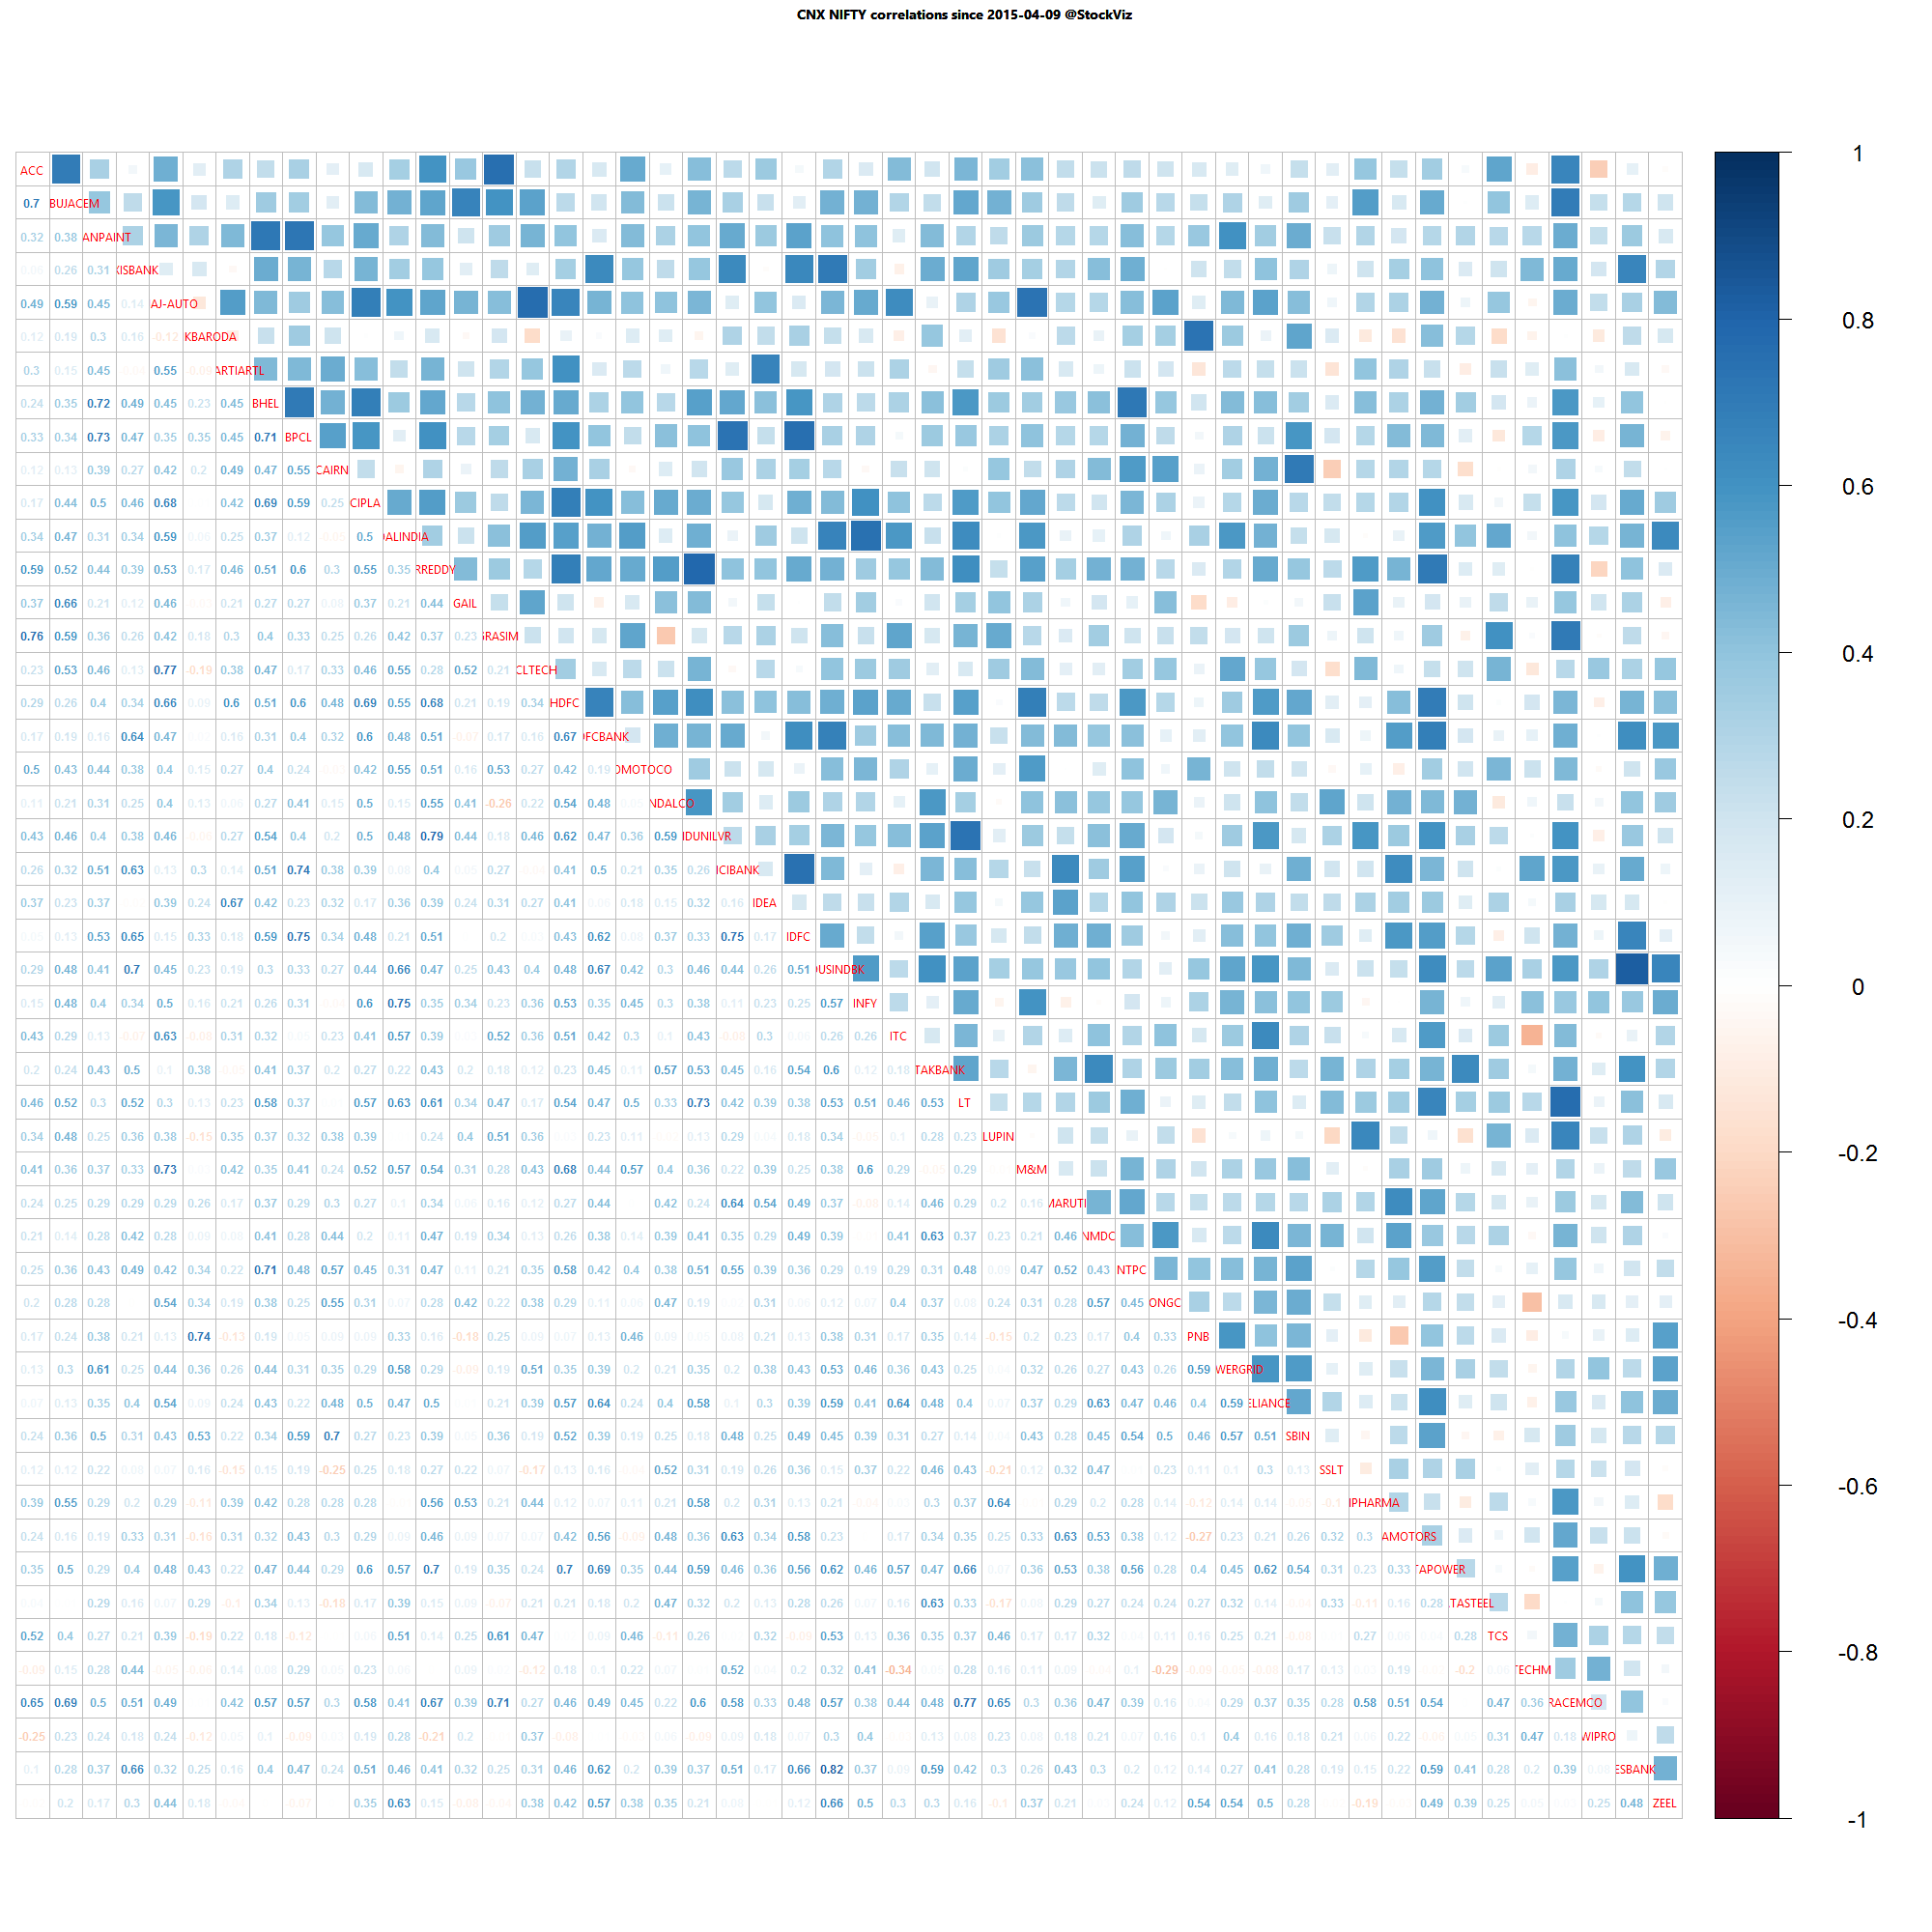
| CNX NIFTY | SHORT |
8.95
|
2015-Mar-03
|
| CNX PHARMA | SHORT |
12.48
|
2015-Apr-08
|
| CNX PSE | SHORT |
27.69
|
2008-Jan-04
|
| CNX REALTY | SHORT |
88.96
|
2008-Jan-14
|
The MNC index should be real “blue-chip” index – lowest draw-down of the whole bunch.