Category: Your Money

Butterfly Option Strategy – Introduction

What is it?

An option butterfly strategy can be used to bet on underlying volatility. A long call butterfly can entered when you think that the underlying will not rise or fall much by expiration. Using calls, the long butterfly can be constructed by buying one lower striking ITM call, writing two ATM calls and buying another higher striking OTM call.

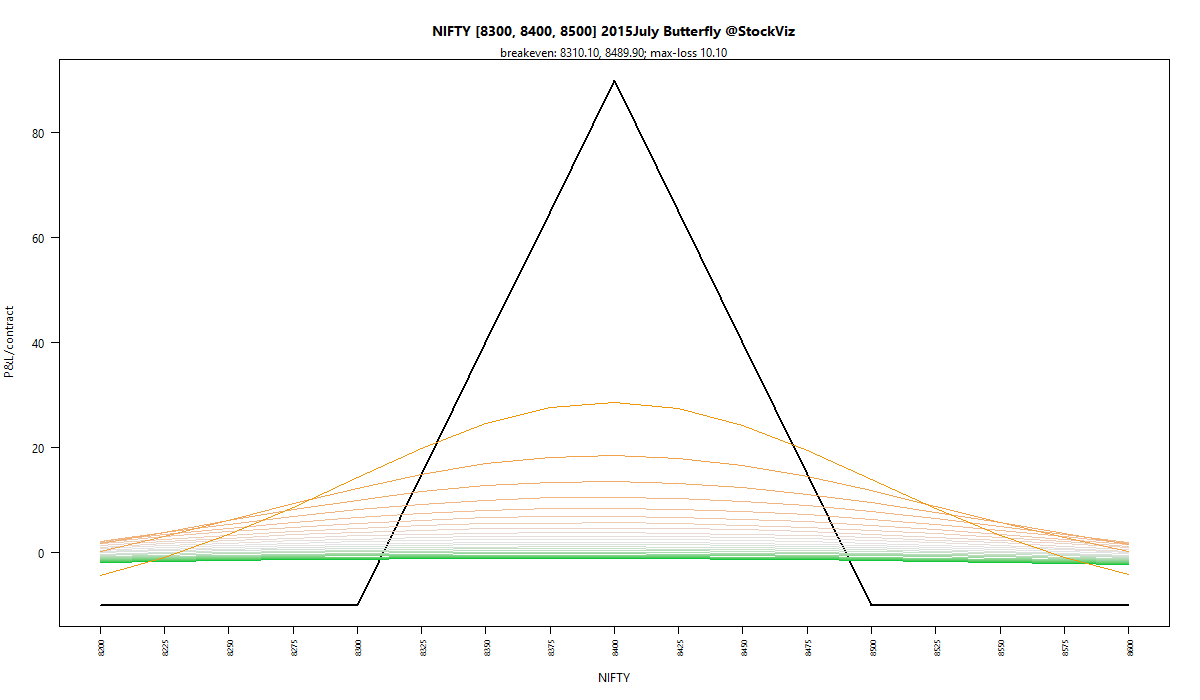
For example, with the NIFTY at ~8330, the strikes would be 8300, 8400 and 8500. If the NIFTY bends between 8310 and 8490, you make a profit of ~Rs. 90 per contract (x lot-size) and your downside (max loss) is limited to the premium you paid (~Rs. 10 per butterfly contract x lot-size.)

To get a sense for how your P&L will look, you can project the option premiums using the Black-Scholes model.

butterfly.NIFTY.2015-07-08.2015-07-30

The solid black line is the P&L scenario at expiry. As you can see, intermediate P&L bears very little resemblance to expiry. It is almost as if most of the P&L is “pulled” as you get nearer to expiry.

Projection vs. Reality

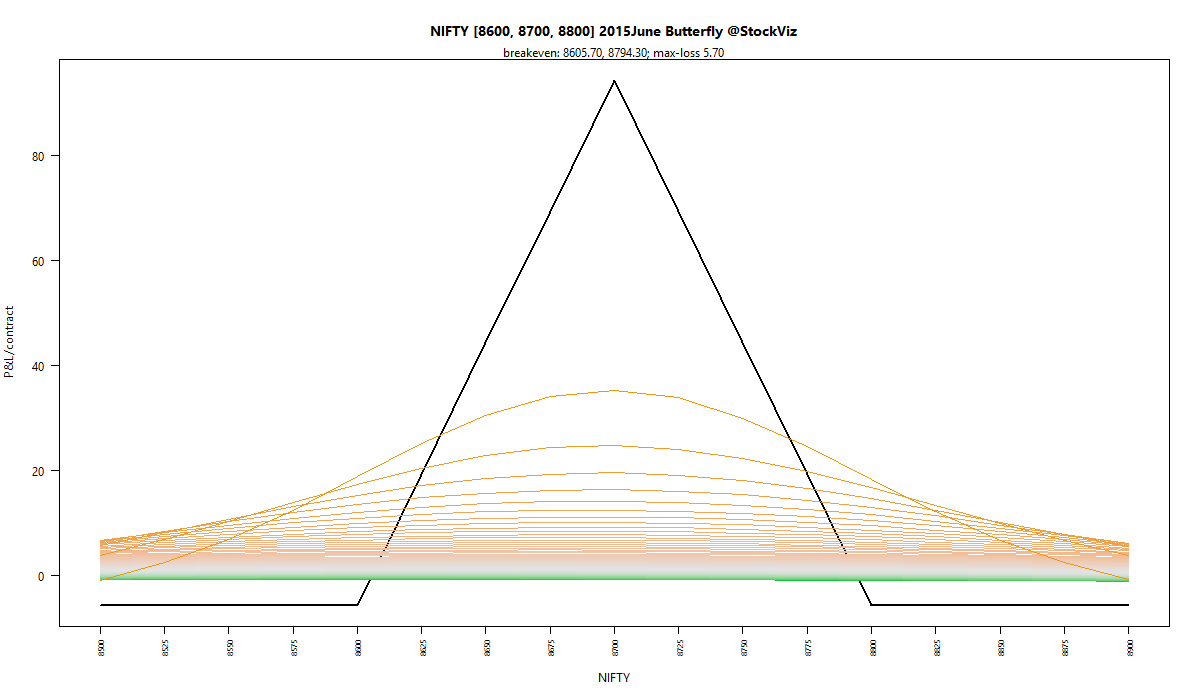
Back in early April this year, the NIFTY was trading around 8600. So you would enter into an 8600, 8700, 8800 butterfly. If you sold the June butterfly, you are essentially betting that the NIFTY would expire outside of 8605 and 8795. If it did, you would get to keep the premium you received (~Rs. 5.70 per butterfly.)

butterfly.NIFTY.2015-04-06.2015-06-25.6.7.8.projection

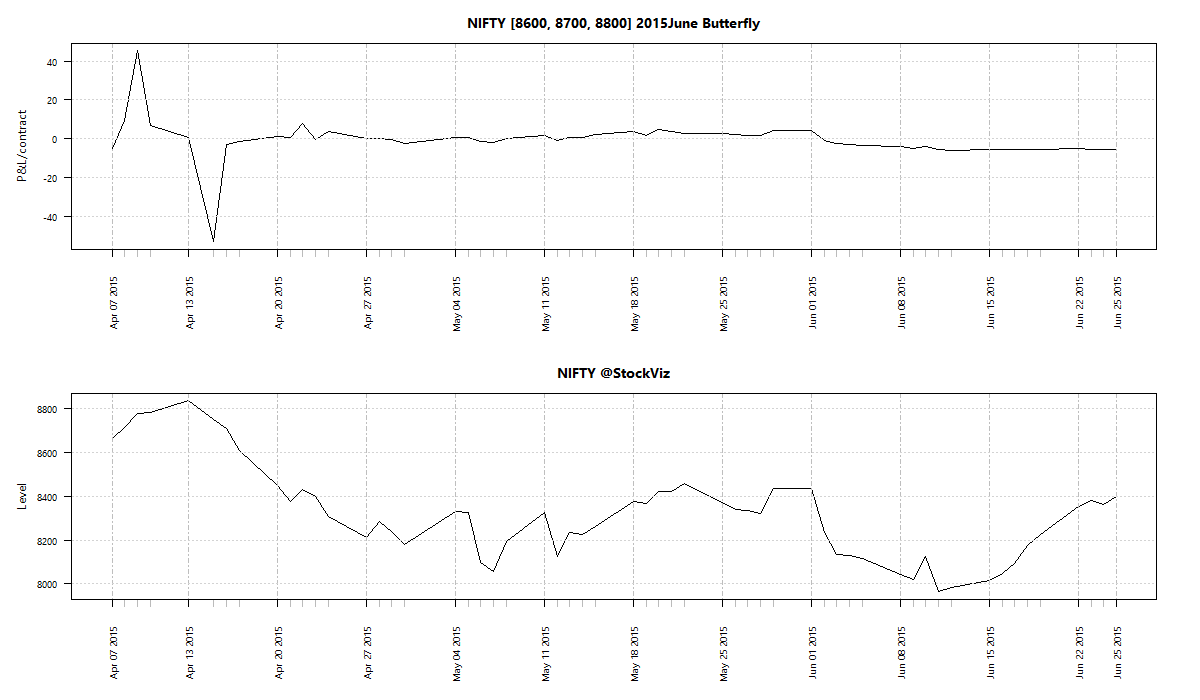
Here is how the butterfly actually behaved:

butterfly.NIFTY.2015-06-25.2015-06-25.678

As a seller, your P&L is actually the inverse of what is shown above. So you would have lost a lot of money when NIFTY shot to 8800s and then swung the other way as NIFTY headed back down. Finally, as you neared expiry, your P&L approached the premium you received.

As you can see, actual behavior bears very little resemblance to modeled behavior.

Butterfly profitability

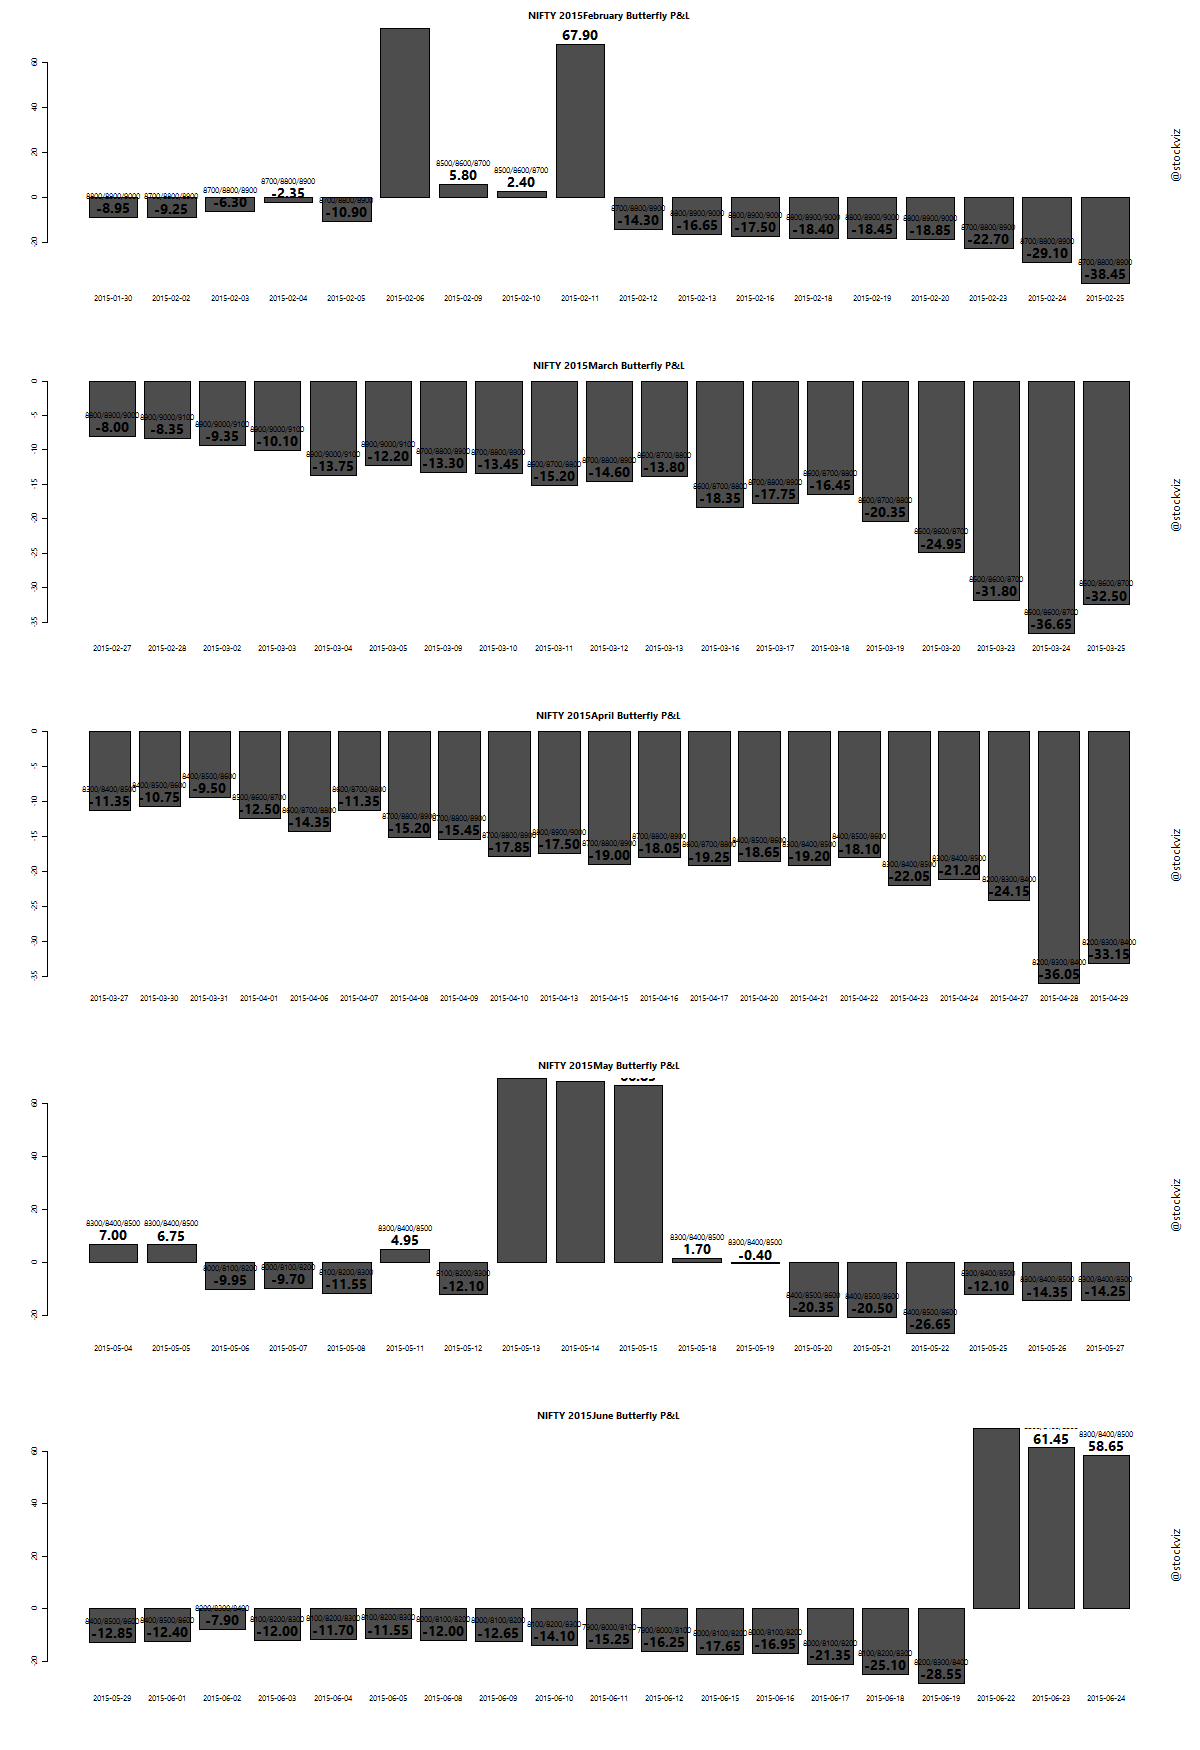
Selling butterflies has been a profitable trade this year. As long as there is volatility, a short call butterfly should make money. Here is the long P&L (selling butterflies would invert this P&L):

butterfly.PL.NIFTY

However, it is a bet on the NIFTY not expiring within the break-even range of the trade. Getting this right could prove tricky. Losses tend to be large and if risk is not managed properly, it can wipe out all the profits made over a period of time. The proverbial “picking up pennies in front of a bulldozer.”

Summary

To point out the obvious, liquidity is a huge problem while executing on this trade. However, selling butterflies can be used to systematically earn carry, as long as risks are managed.

Optimization vs. Maximization

The dog years of 2010, 2011, 2012 and 2013

According to AMFI, these are the 5 largest funds at the end of March-2015:

Scheme Name AUM (Cr.)
HDFC Equity Fund – Growth Option
1,280,287
HDFC Top 200 Fund – Growth Option
1,009,121
Reliance Equity Opportunities Fund-Growth Plan-Growth Option
764,383
HDFC MID-CAP OPPORTUNITIES FUND – Growth Option
715,865
ICICI Prudential Value Discovery Fund – Regular Plan – Growth
645,946

What this means is that there is at least one person in your immediate network who would have invested in one of these funds.

Now let’s take a walk down memory lane. 2010, 2011, 2012 and 2013 were the worst years for the Indian economy. The RBI had messed up monetary policy leading to high inflation (double digits), there was a currency panic (rupee went from 45 to a dollar to 65), a never-ending series of scams and a government hell bent on redistribution. The only two asset classes that were doing well at the time were gold and real estate. GOLDBEES, the gold ETF, returned 13.25% (IRR) during that period. Fixed deposits were yielding around 11%. How would a typical investor react if his actively managed equity investments gave the following returns?

Scheme Name IRR
HDFC Equity Fund – Growth Option
7.00%
HDFC Top 200 Fund – Growth Option
6.74%
Reliance Equity Opportunities Fund-Growth Plan-Growth Option
12.00%
HDFC MID-CAP OPPORTUNITIES FUND – Growth Option
13.24%
ICICI Prudential Value Discovery Fund – Regular Plan – Growth
11.09%

Here is Gold (in red) vs. HDFC Equity Fund (in black):

Needless to say, most investors who dipped their toes into the equity markets in 2010 gave up after a couple of years and still believe that the whole mutual fund business is a scam.

First half of 2015

We are supposed to be in a bull market. But let’s see how the first half worked out for the HDFC Equity Fund:

IRR of -2.39%. And bonds lost money too (in June.) Bull markets are not immune to prolonged periods of a “sideways” market.

Diversification across assets

A standard response to most investing problems in diversification. Invest a little into a variety of asset classes – equities, commodities, real-estate, gold, bonds – and you will be fine.

The problem with diversification is that it always feels wrong. For example, there are “balanced” funds that are supposed to allocate between both bonds and equities. They end up having lower draw-downs because of this. If you compare the ICICI Prudential Balanced Fund with HDFC Equity Fund between 2010-2013, the latter has an IRR of 11.38% vs. 7.00% of the former. But during the bull market of 2014, the balanced-fund gave an IRR of 45.47% vs. the equity fund’s 53.83%. So the lower draw-down comes at the expense of performance. It is a huge cognitive burden for investors to live with.

The kind of assets you pick for diversifying into also matters. For example, there was this big thing back in the day about the “commodity super-cycle.” About how the insatiable appetite for all sorts of commodities from China would keep growing to infinity. Plus, commodities were supposed to uncorrelated with equities. So great for diversification, right? Here’s how Mirae Global Commodity Equity Fund compares to the HDFC Equity Fund:

Commodity stocks did turn out to be uncorrelated but not in a way that you would like. And the commodities themselves are bouncing along multi-year lows right now.

What about bonds? Surely, they are safe. But let’s not forget that in 2009 and 2013, gilts drew-down double digits and their long-term IRRs are between 7% and 10%.
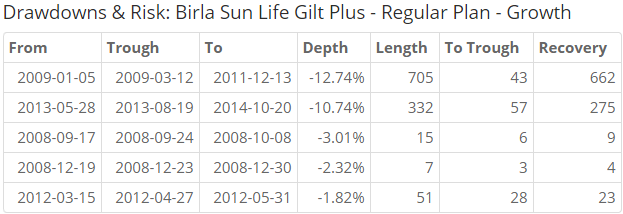
gilt drawdowns

Diversifying across geographies

What if you invested in international funds? After all, the rupee keeps going down, right? Depends on where you look. Between 2010 and 2013 (the dog years) the Birla Sun Life International Equity Fund – Plan A gave an IRR of 16.09% vs. HDFC Equity Fund’s 7%. But before you pat yourself on the back, between 2014 and now, the latter gave an IRR of 3.06% vs. 32.54% of the former. And Religare’s Pan European Equity Fund gave 1.50%.

Diversification means that your overall portfolio will trail behind the best performing asset class du jour. Psychologically, it is a very difficult thing to stick to.

Investing fads and broker recommendations

Of all the poor choices that investors can make, the worst is giving into investing fads. Back in 2004, there was this whole “India shining” marketing slogan. And now there is “make in India”, “smart cities”, “digital India”, etc. And almost every single time, fund houses come out with new schemes that tag along the slogan du jour. Here are some examples:

Morgan Stanley came out with their stock picks if Modi won (Theme created Dec 6, 2013):
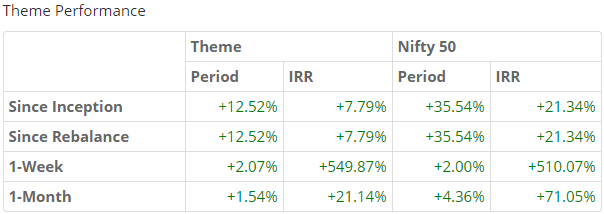
morgan stanley strong election result

Here’s one on the Rail Budget (Theme, created Feb 26, 2015)
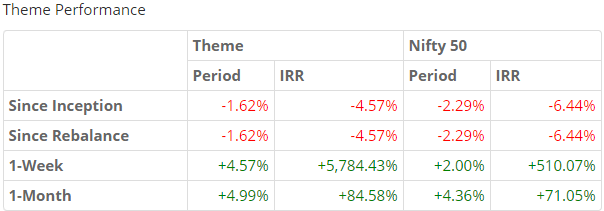
rail budget 2015 theme

So much for betting on rate-sensitive stocks (Theme, created Feb 3, 2015):
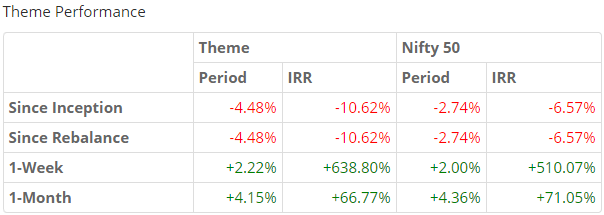
rate sensitive 2015 theme

You can browse through all these recommendations and lists under the “Broker Recommendations” section of our Themes page. We call it Doodh Ka Doodh Pani ka Pani.

Optimization vs. Maximization

The above examples highlight the problems of trying to maximize returns. There will always be an asset class, mutual fund or stock that is doing better than what you own. And there is an entire industry of tip-sheets, newsletter writers and subscription services that promise to pick the next winner.

However, we see investing as an optimization problem. We believe that drawdowns are an inseparable part of investing. Instead, we focus on getting the right mix of assets and strategies based on your risk appetite. And we make it supremely easy to stick to a plan.

For direct equity investors, this means getting Value and Momentum right. We have created Themes based on different approaches to value and momentum investing. Investors can then map our Themes to gain exposure to a specific set of strategies.

For mutual fund investors, this means getting portfolio risk right. We have created Themes based on the risk of the overall portfolio. Investors can now tune out the noise and focus on achieving their life goals.

Investing is not easy, but your journey as an investor will be so much more smoother with us. Get in touch with us now!
Weekly Recap: Illusion of Insight

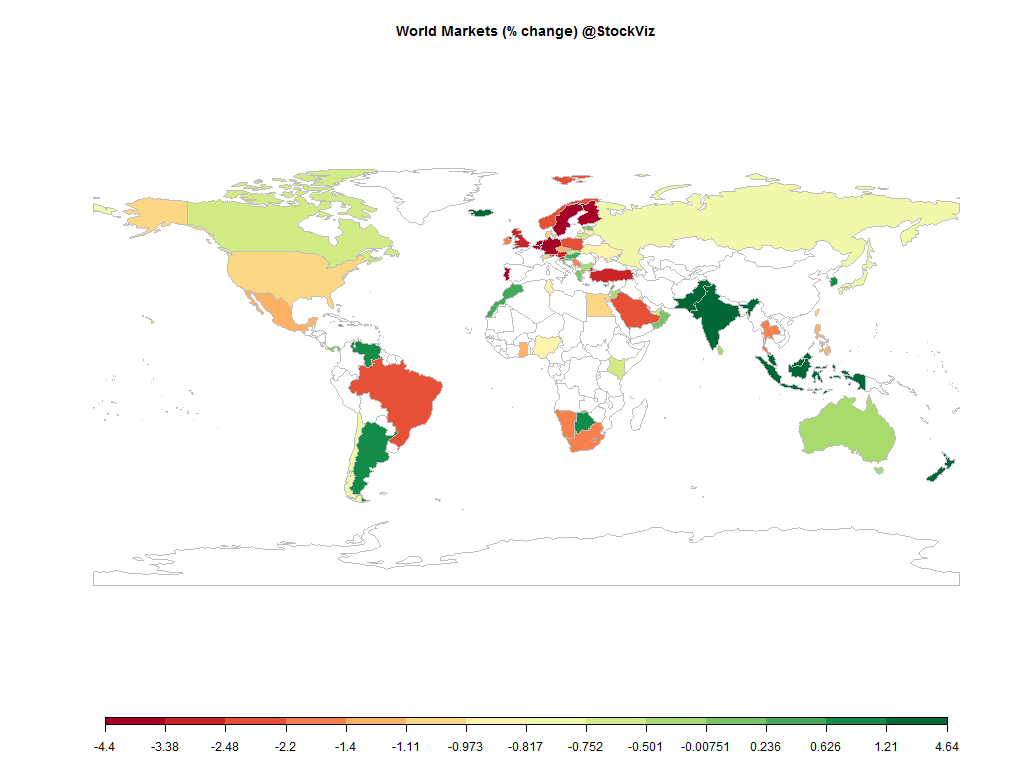
world.2015-06-26.2015-07-03

Equities

Major
DAX(DEU) -3.78%
CAC(FRA) -4.96%
UKX(GBR) -2.49%
NKY(JPN) -0.80%
SPX(USA) -1.07%
MINTs
JCI(IDN) +1.22%
INMEX(MEX) -1.33%
NGSEINDX(NGA) -0.96%
XU030(TUR) -3.24%
BRICS
IBOV(BRA) -2.42%
SHCOMP(CHN) -12.07%
NIFTY(IND) +1.24%
INDEXCF(RUS) -0.78%
TOP40(ZAF) -1.49%

Commodities

Energy
Brent Crude Oil -4.66%
Ethanol +3.10%
Natural Gas +0.18%
WTI Crude Oil -6.97%
Heating Oil -3.60%
RBOB Gasoline -2.01%
Metals
Copper -1.13%
Palladium +0.78%
Platinum +0.21%
Gold 100oz -0.29%
Silver 5000oz -0.64%

Currencies

USDEUR:+0.51% USDJPY:-0.86%

MINTs
USDIDR(IDN) +0.09%
USDMXN(MEX) +0.96%
USDNGN(NGA) -0.03%
USDTRY(TUR) +0.95%
BRICS
USDBRL(BRA) +0.25%
USDCNY(CHN) -0.06%
USDINR(IND) -0.32%
USDRUB(RUS) +1.83%
USDZAR(ZAF) +0.82%
Agricultural
Corn +9.16%
Feeder Cattle +0.15%
Lean Hogs +4.63%
Lumber -1.60%
Cattle +2.02%
Cocoa -0.23%
Coffee (Arabica) -4.07%
Cotton +1.26%
Coffee (Robusta) -2.48%
Orange Juice -2.44%
Soybean Meal +4.91%
Soybeans +4.58%
Sugar #11 +6.14%
Wheat +4.59%
White Sugar +3.31%

Credit Indices

Index Change
Markit CDX EM -0.19%
Markit CDX NA HY +0.10%
Markit CDX NA IG +1.32%
Markit iTraxx Asia ex-Japan IG +5.12%
Markit iTraxx Australia +5.77%
Markit iTraxx Europe +6.41%
Markit iTraxx Europe Crossover +27.25%
Markit iTraxx Japan +0.68%
Markit iTraxx SovX Western Europe +2.22%
Markit LCDX (Loan CDS) -0.04%
Markit MCDX (Municipal CDS) +4.16%
The Nifty was one of the few global indices that ended this week in the green. Pretty much all markets were buffetted by the Greece drama. Shanghai had one of the worst weeks ever – Chinese regulators have allowed pretty much anything to be posted as collateral, the only thing that remains to be tried is outlawing falling stock prices.

Nifty Heatmap

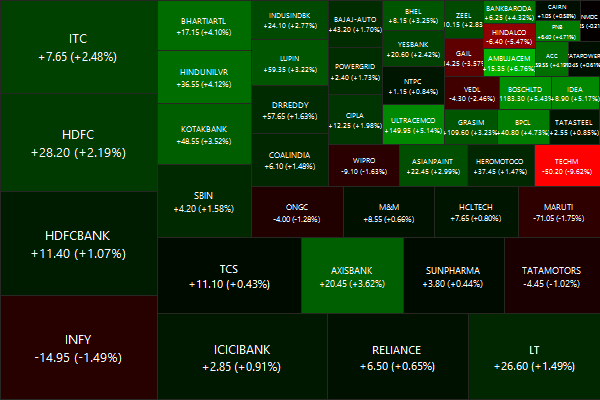
CNX NIFTY.2015-06-26.2015-07-03

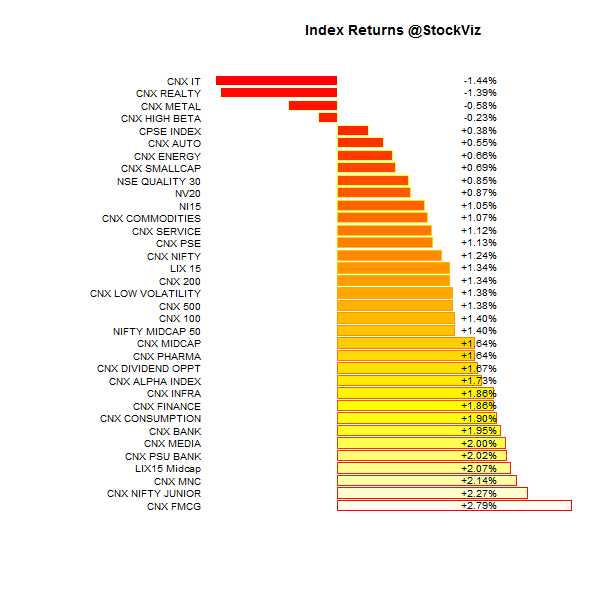
Index Returns

For a deeper dive into indices, check out our weekly Index Update.
index.performance.2015-06-26.2015-07-03

Sector Performance

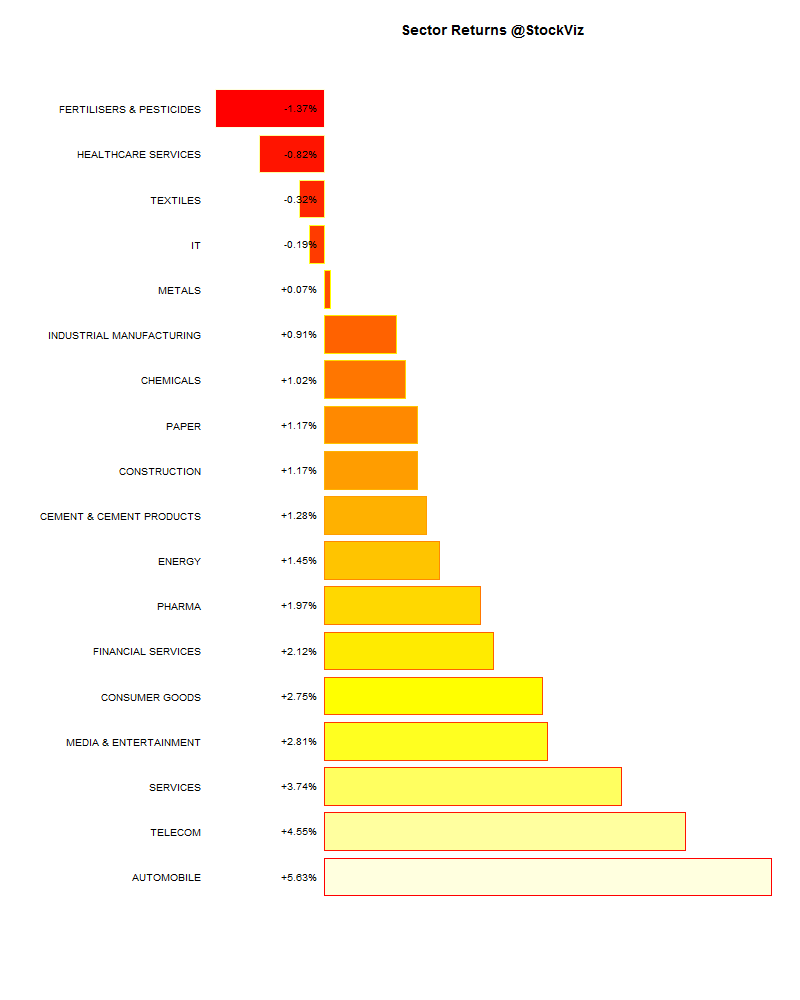
sector performance.2015-06-26.2015-07-03

Market Cap Decile Performance

Decile Mkt. Cap. Adv/Decl
1 (micro) +2.10% 64/67
2 +2.76% 71/59
3 +3.02% 72/59
4 +2.47% 68/62
5 +3.80% 76/55
6 +2.73% 67/63
7 +1.58% 69/62
8 +1.35% 67/63
9 +1.52% 63/68
10 (mega) +0.81% 72/59
Midcaps outperformed large-caps. Is this a sign of the market turning around?

Top Winners and Losers

AMBUJACEM +6.76%
BAJAJFINSV +12.09%
UBL +13.80%
TECHM -9.62%
HINDALCO -5.47%
BHARATFORG -3.67%
Who would’ve thunk that a cement stock can go up more than 6% in a week?

ETF Performance

BANKBEES +1.72%
JUNIORBEES +1.70%
PSUBNKBEES +1.02%
NIFTYBEES +0.88%
CPSEETF +0.56%
INFRABEES +0.36%
GOLDBEES -1.07%
Banks caught a bid. Gold sank.

Yield Curve

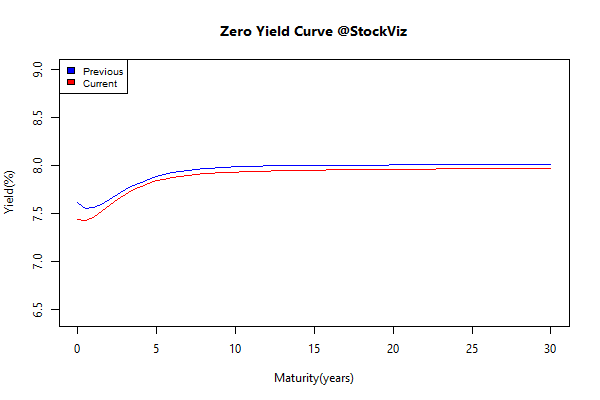
yield Curve.2015-06-26.2015-07-03

Bond Indices

Sub Index Change in YTM Total Return(%)
GSEC TB -0.14 +0.12%
GSEC SUB 1-3 +0.16 -0.10%
GSEC SUB 3-8 +0.32 -1.27%
GSEC SUB 8 +0.19 -1.32%
The long end of the curve got creamed…

Investment Theme Performance

Equity Mutual Funds

Bond Mutual Funds

Thought for the weekend

People were more confident that they knew the answers — had the information in their heads — if they had access to [internet] search. It’s more like thinking you know how to fix a car if you have access to a mechanic.

Plus, searching the internet is almost effortless, and it’s almost always accessible. You never face your ignorance when it’s there. Because we’re so deeply plugged into it, we misattribute the connection to knowledge to actually having the knowledge ourselves.

Emotional investments can give people the illusion of insight.

Source: The Internet Makes You Think You’re Smarter Than You Are

Index Update 04.07.2015

MOMENTUM

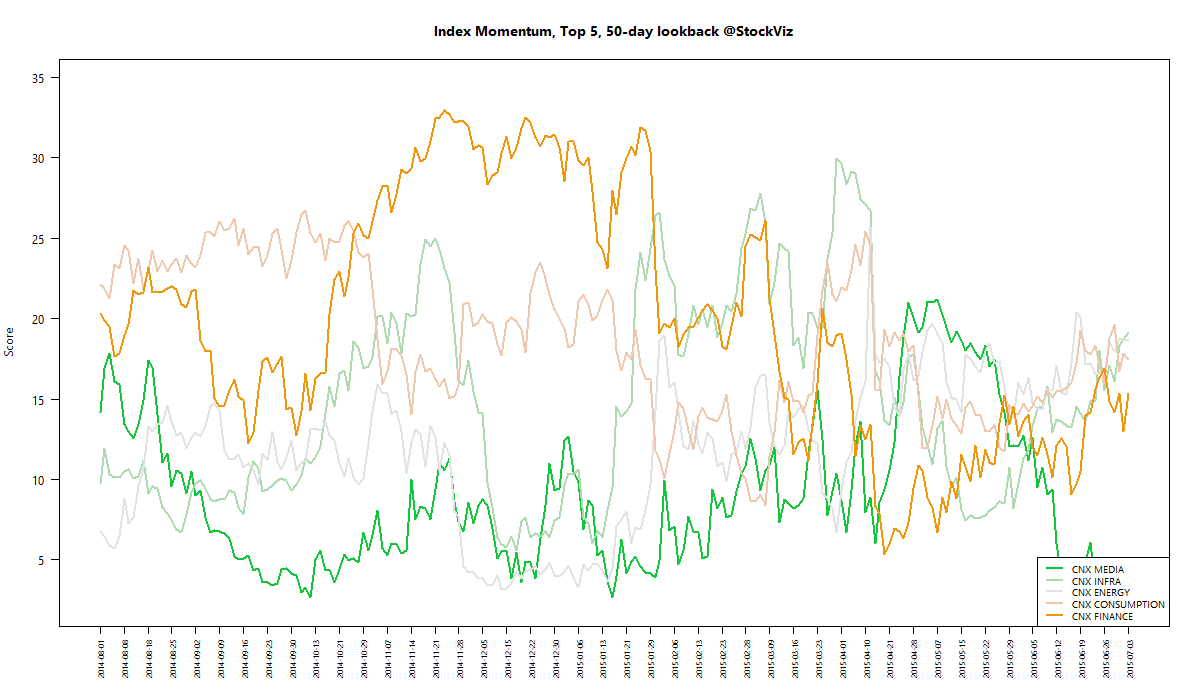
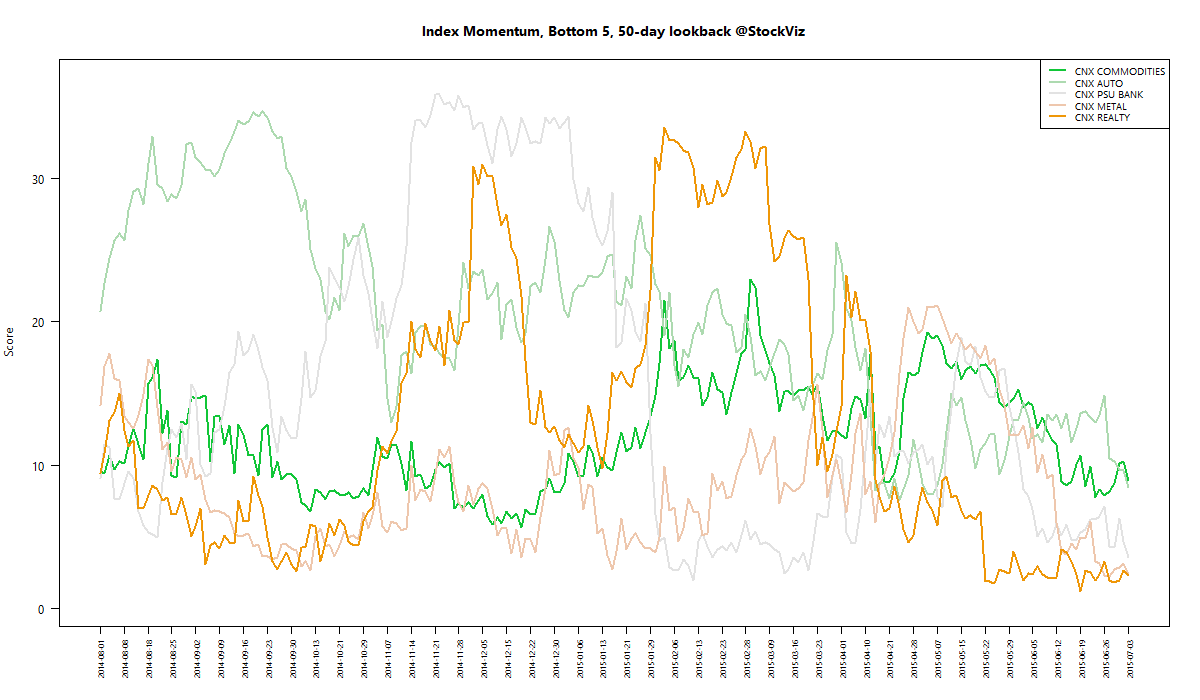
We run our proprietary momentum scoring algorithm on indices just like we do on stocks. You can use the momentum scores of sub-indices to get a sense for which sectors have the wind on their backs and those that are facing headwinds.

Traders can pick their longs in sectors with high short-term momentum and their shorts in sectors with low momentum. Investors can use the longer lookback scores to position themselves using our re-factored index Themes.

You can see how the momentum algorithm has performed on individual stocks here.

Here are the best and the worst sub-indices:

index momentum best 365 2015-07-03 png

index momentum best 50 2015-07-03 png

index momentum worst 365 2015-07-03 png

index momentum worst 50 2015-07-03 png

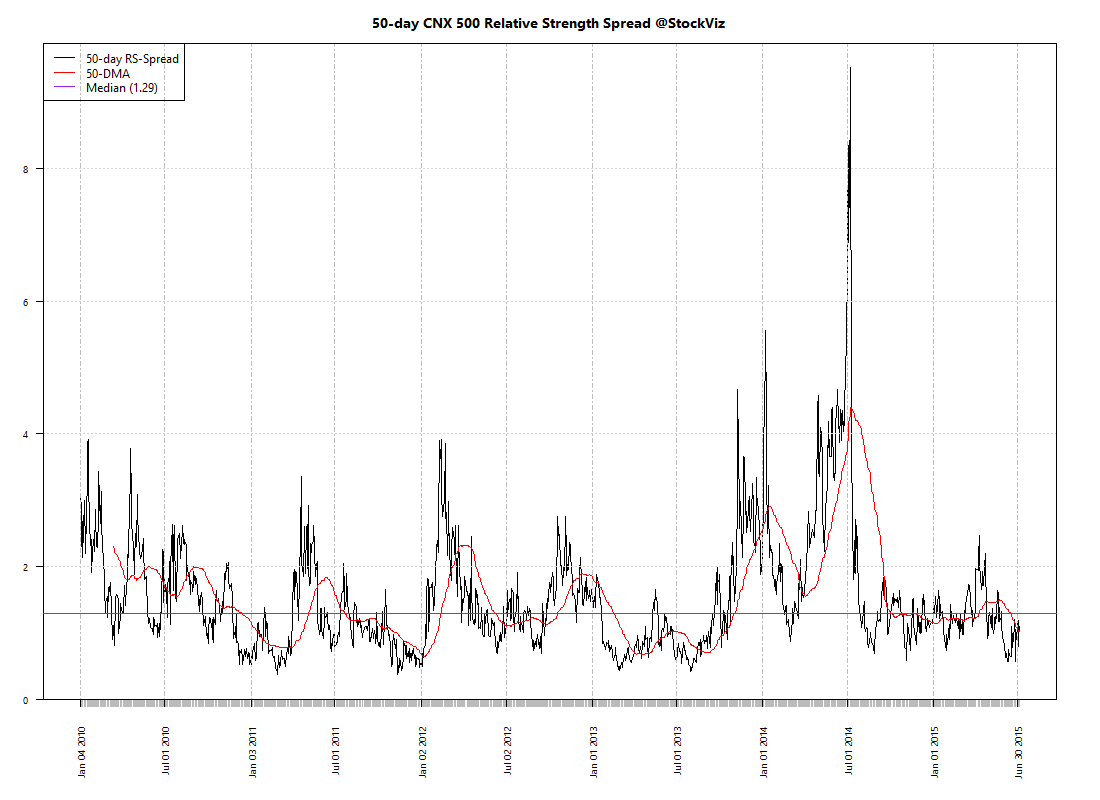
Relative Strength Spread

CNX_500 relative-spread-index 50 2015-07-03 png

Refactored Index Performance

50-day performance, from April 24, 2015 through July 03, 2015:

Trend Model Summary

Index Signal % From Peak Day of Peak
CNX AUTO SHORT
6.66
2015-Jan-27
CNX BANK SHORT
8.88
2015-Jan-27
CNX ENERGY SHORT
25.33
2008-Jan-14
CNX FMCG LONG
9.20
2015-Feb-25
CNX INFRA LONG
46.95
2008-Jan-09
CNX IT LONG
88.27
2000-Feb-21
CNX MEDIA LONG
23.15
2008-Jan-04
CNX METAL LONG
58.71
2008-Jan-04
CNX MNC LONG
1.66
2015-Mar-12
CNX NIFTY SHORT
5.68
2015-Mar-03
CNX PHARMA LONG
11.32
2015-Apr-08
CNX PSE LONG
23.84
2008-Jan-04
CNX REALTY SHORT
90.35
2008-Jan-14
50-day performance turns green for most indices and the MNCs have more or less covered their draw-downs. Looks like financials and FMCG have found their mojo. Will the markets keep their trend?

Correlation Update 04.07.2015

Nifty one year daily return correlations

Nifty one year daily return correlations

Nifty one month daily return correlations

Nifty one month daily return correlations

Bank Nifty one year daily return correlations

Bank Nifty one year daily return correlations

Bank Nifty one month daily return correlations

Bank Nifty one month daily return correlations

Midcap one year daily return correlations

Midcap one year daily return correlations

Midcap one month daily return correlations

Midcap one month daily return correlations

A lot of thick blue squares mean that positive correlations are high. Red squares mean negative correlations are high. Whites are the doldrums.