Category: Your Money

Monthly Recap: May you live in Interesting Times…

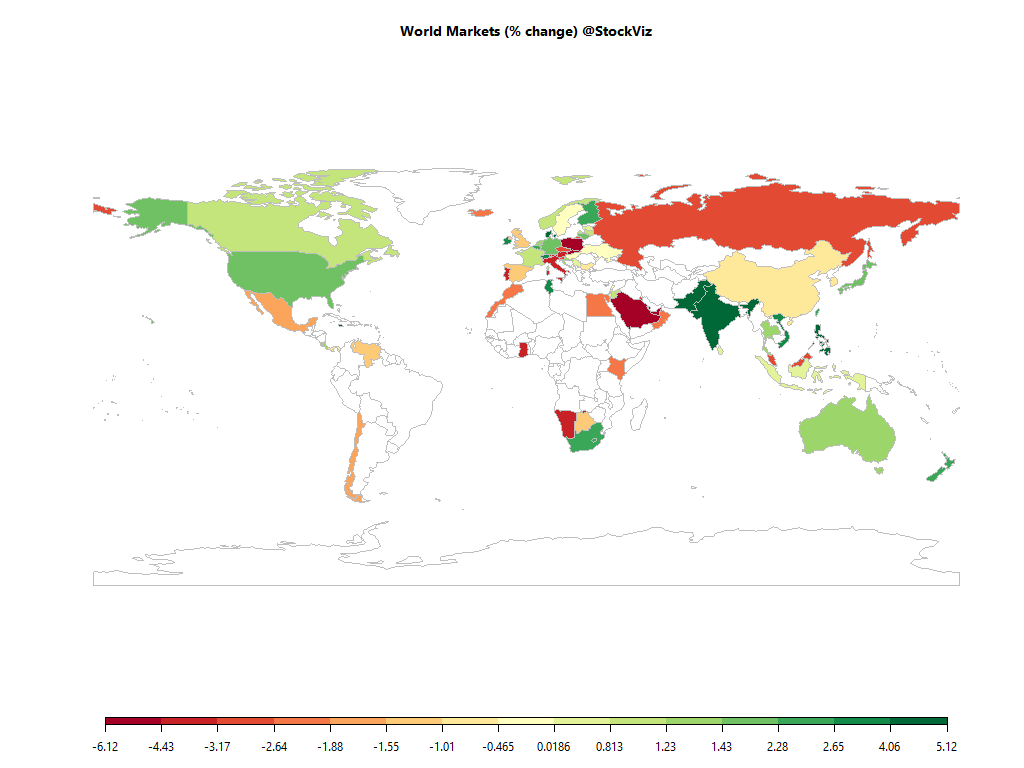
world.2016-04-29.2016-05-31

Equities

Major
DAX(DEU) +1.50%
CAC(FRA) +0.92%
UKX(GBR) -1.16%
NKY(JPN) +1.74%
SPX(USA) +2.15%
MINTs
JCI(IDN) +0.02%
INMEX(MEX) -1.61%
NGSEINDX(NGA) +7.83%
XU030(TUR) -9.43%
BRICS
IBOV(BRA) -9.81%
SHCOMP(CHN) -0.84%
NIFTY(IND) +4.21%
INDEXCF(RUS) -2.70%
TOP40(ZAF) +2.50%

Commodities

Energy
Ethanol +6.67%
Heating Oil +7.38%
Natural Gas +7.49%
Brent Crude Oil +2.90%
RBOB Gasoline +0.68%
WTI Crude Oil +6.55%
Metals
Copper -7.49%
Platinum -8.82%
Silver 5000oz -10.11%
Gold 100oz -5.52%
Palladium -12.65%

Currencies

USDEUR:+2.47% USDJPY:+2.45%

MINTs
USDIDR(IDN) +3.65%
USDMXN(MEX) +7.17%
USDNGN(NGA) +0.00%
USDTRY(TUR) +5.40%
BRICS
USDBRL(BRA) +4.23%
USDCNY(CHN) +1.54%
USDINR(IND) +1.69%
USDRUB(RUS) +3.25%
USDZAR(ZAF) +10.07%
Agricultural
Lean Hogs +3.33%
Lumber +2.78%
Orange Juice +20.00%
Wheat -2.56%
White Sugar +2.88%
Coffee (Robusta) +6.04%
Corn +2.81%
Cotton +0.28%
Soybean Meal +18.55%
Soybeans +5.17%
Cattle -2.34%
Cocoa -3.81%
Coffee (Arabica) +1.70%
Feeder Cattle +5.01%
Sugar #11 +7.46%

Credit Indices

Index Change
Markit CDX EM -0.78%
Markit CDX NA HY -0.24%
Markit CDX NA IG +0.19%
Markit iTraxx Asia ex-Japan IG +0.55%
Markit iTraxx Australia -4.39%
Markit iTraxx Europe -0.16%
Markit iTraxx Europe Crossover +3.18%
Markit iTraxx Japan -4.31%
Markit MCDX (Municipal CDS) -2.00%
The US Dollar rallied, NIFTY was the best performing equity index…

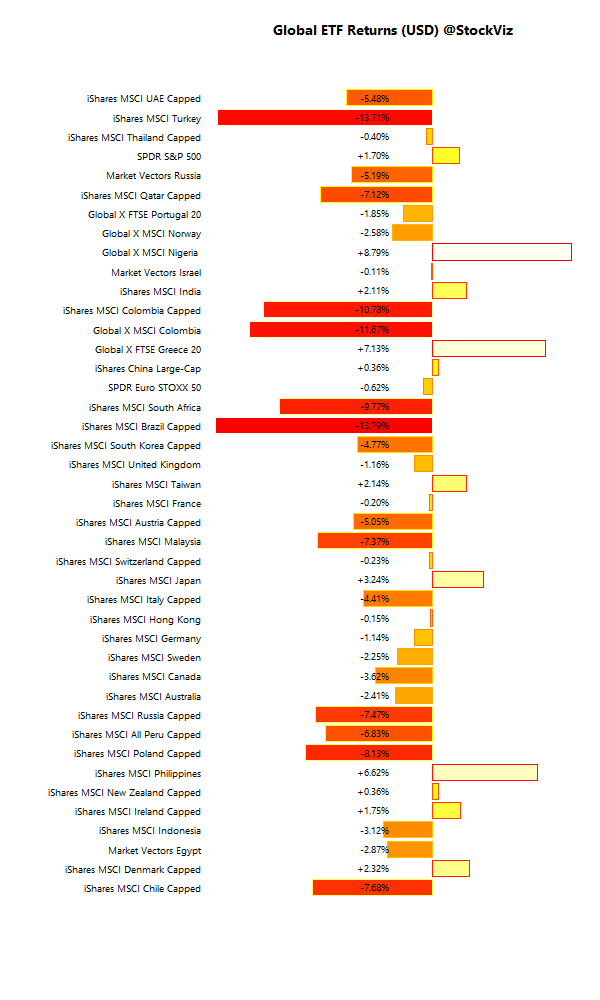
International ETFs (USD)

global.etf.performance.2016-04-29.2016-05-31

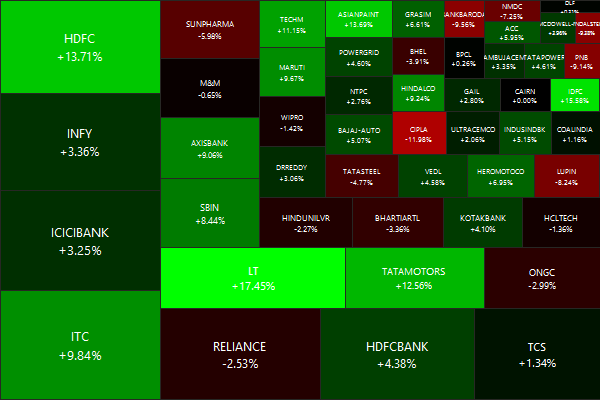
Nifty Heatmap

NIFTY 50.2016-04-29.2016-05-31

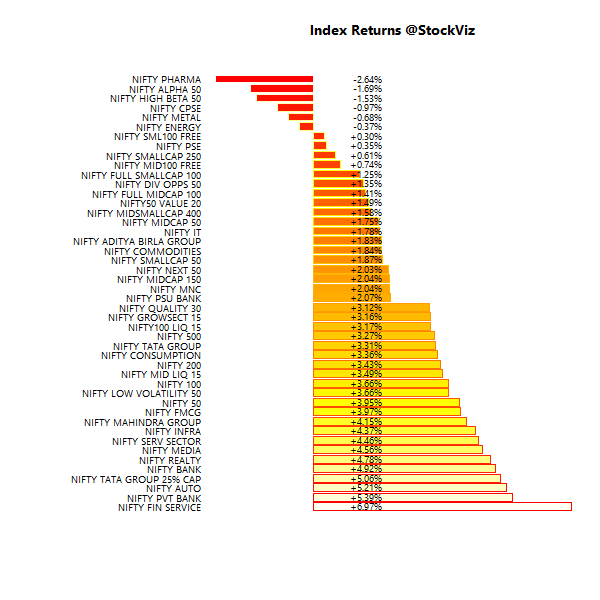
Index Returns

index.performance.2016-04-29.2016-05-31

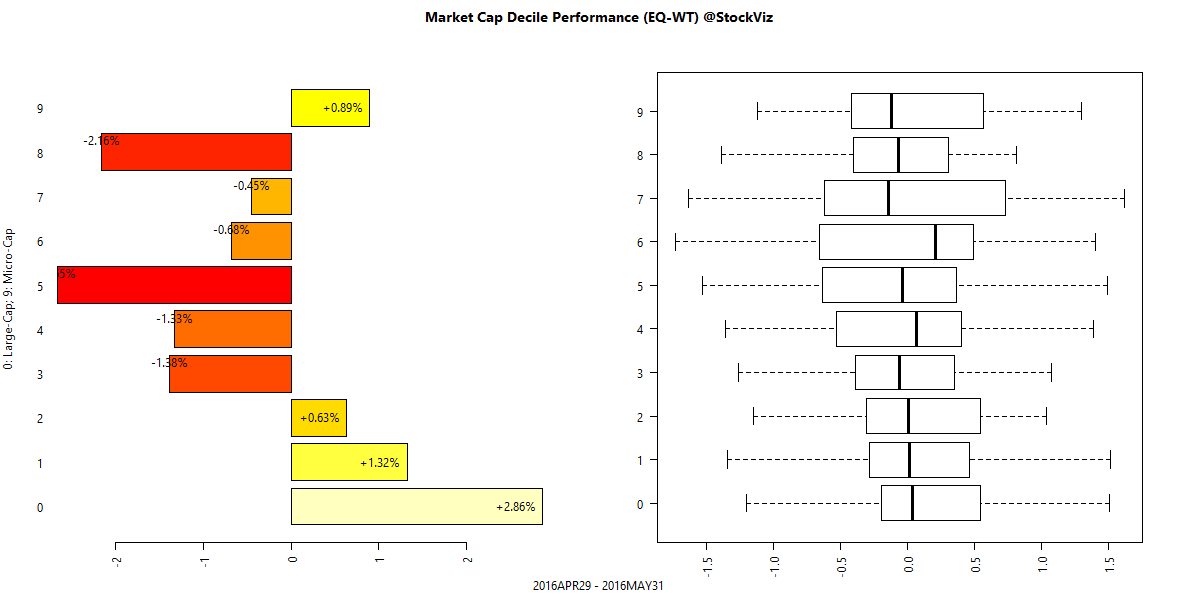
Market Cap Decile Performance

deciles.perf.2016-05-31

Top Winners and Losers

PIDILITIND +17.11%
LT +17.45%
SRTRANSFIN +25.19%
ADANIPORTS -19.33%
RCOM -16.46%
CIPLA -11.98%
Mirroring the performance of sector indices…

ETF Performance

INFRABEES +5.44%
BANKBEES +4.88%
NIFTYBEES +3.96%
JUNIORBEES +2.15%
PSUBNKBEES +0.93%
CPSEETF -1.09%
GOLDBEES -2.63%
Infrastructure caught a bid. But for how long?

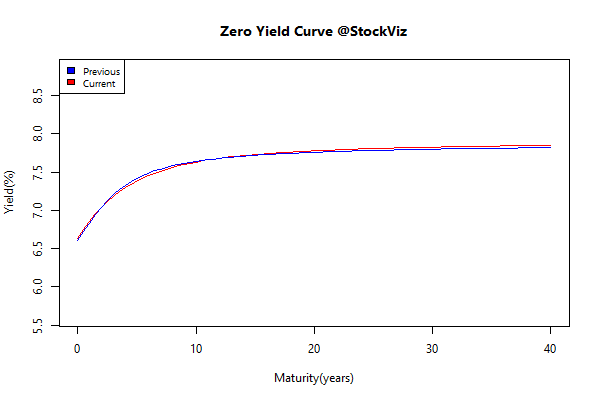
Yield Curve

yieldCurve.2016-04-29.2016-05-31

Bond Indices

Sub Index Change in YTM Total Return(%)
0 5 -0.03 +0.73%
5 10 -0.01 +0.73%
10 15 -0.10 +1.38%
15 20 -0.00 +0.71%
20 30 -0.01 +0.79%
Bonds put in a decent performance…

Investment Theme Performance

Low Beta/Volatility outperformed momentum…

Equity Mutual Funds

Bond Mutual Funds

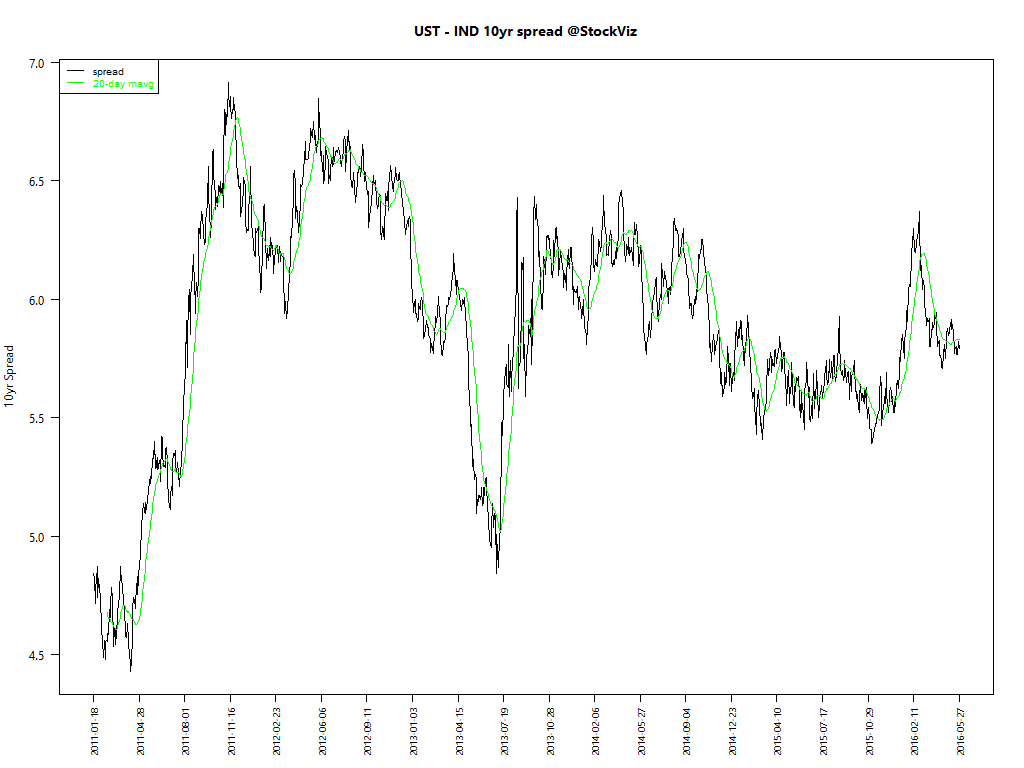
Indian bonds are cheap…

ust-ind-10yr-spread.2016-04-29

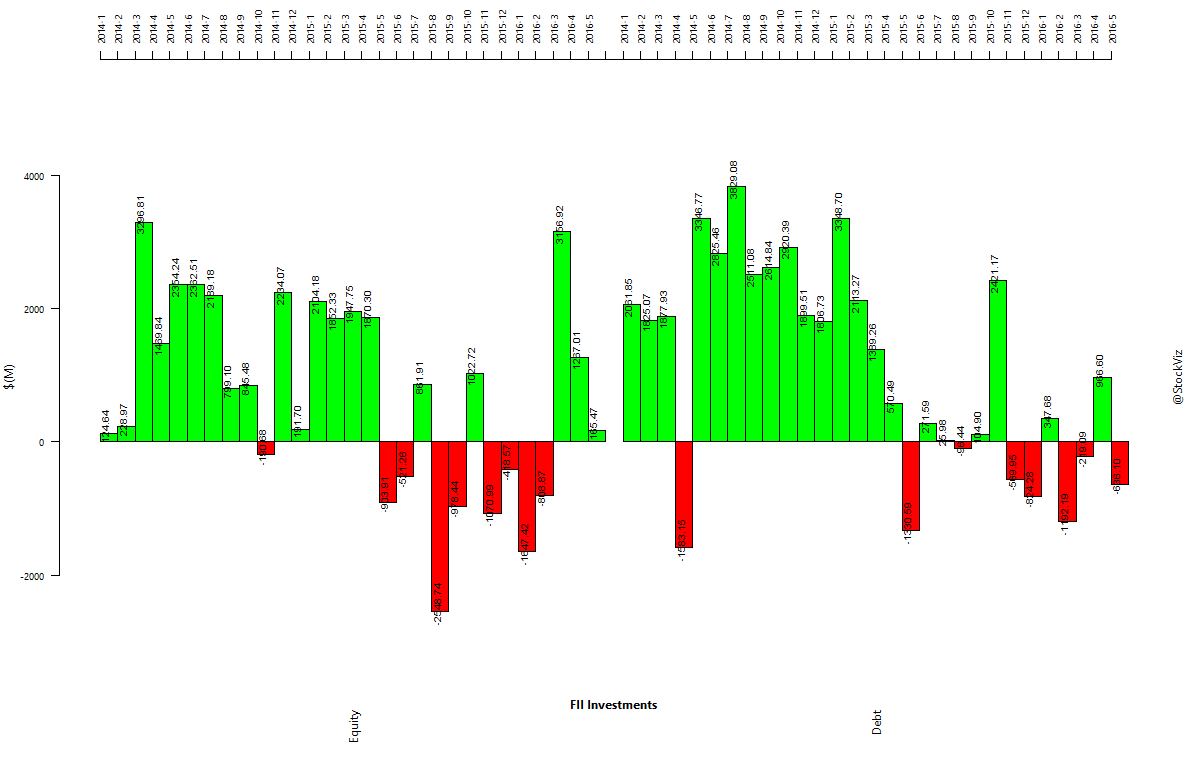
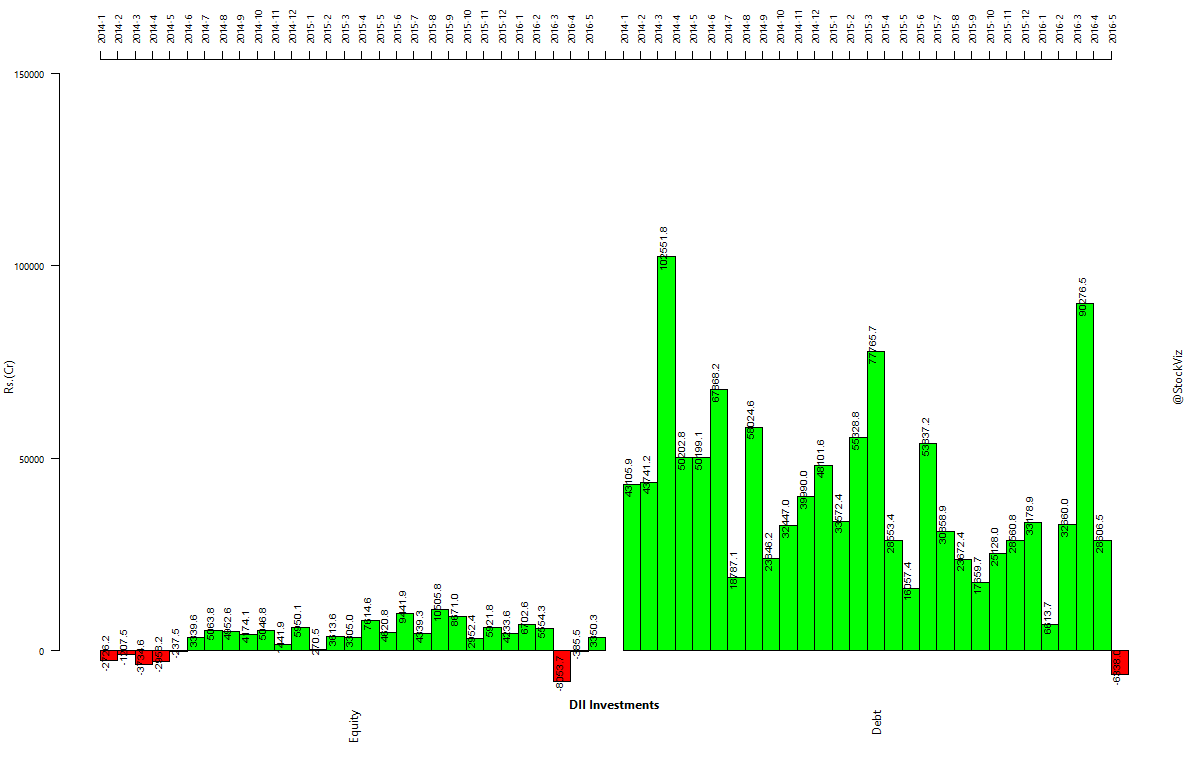
Institutional flows

fii-investments.2014-01-01.2016-05-31

dii-investments.2014-01-01.2016-05-31

Book of the Month

Everything is interpreted through the prism of our own experiences.

The Confidence Game: Why We Fall for It . . . Every Time

The Confidence Game: Why We Fall for It… Every Time by Maria Konnikova (Amazon)

Trading Day of Month Returns

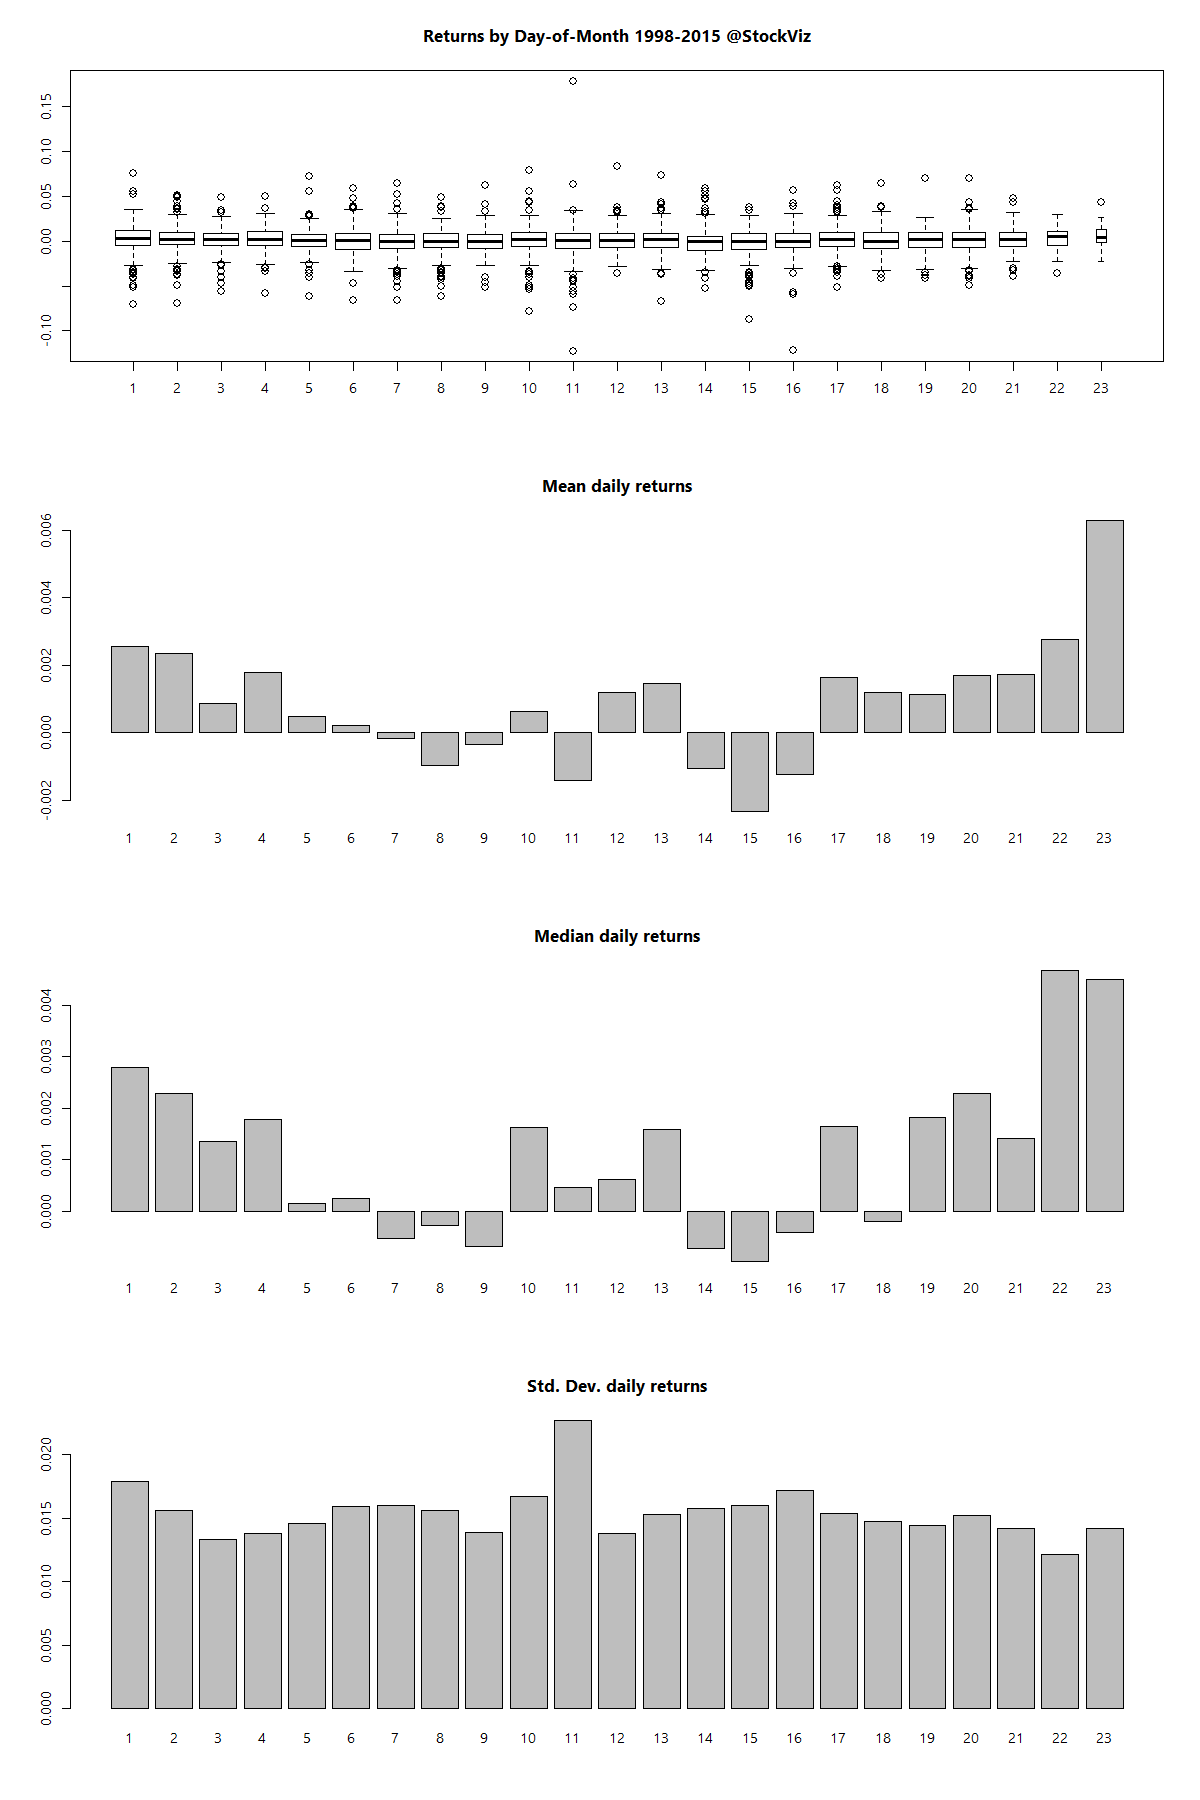
An analysis of daily returns of the NIFTY 50 index between 1998 and 2015 shows that:

  1. The first few and the last few trading days of a month are the best days to be long.
  2. Middle of the month returns are more volatile and, on an average, negative.
  3. Cumulative returns of a strategy that is long on the first 5 and the last 5 days of the month and short the others is 1,112.154% vs. 636.1821% of a buy and hold strategy.

day-of-month

Further reading: An Anatomy of Calendar Effects (SSRN)

A Brief Note on Monte Carlo

When we back-test a strategy against the historical prices of an instrument, say, the NIFTY 50 index, we have to keep in mind that historical values are just one path of the many paths that the instrument could have taken.

For example, 10 tosses of a fair coin can result in TTTTTFFFFF and TFTFTFTFTF with equal probability. If your strategy is path dependent (as most strategies are,) then just because it was successful in one trial (historical prices) doesn’t mean that it would have been successful in all (or majority) of them.

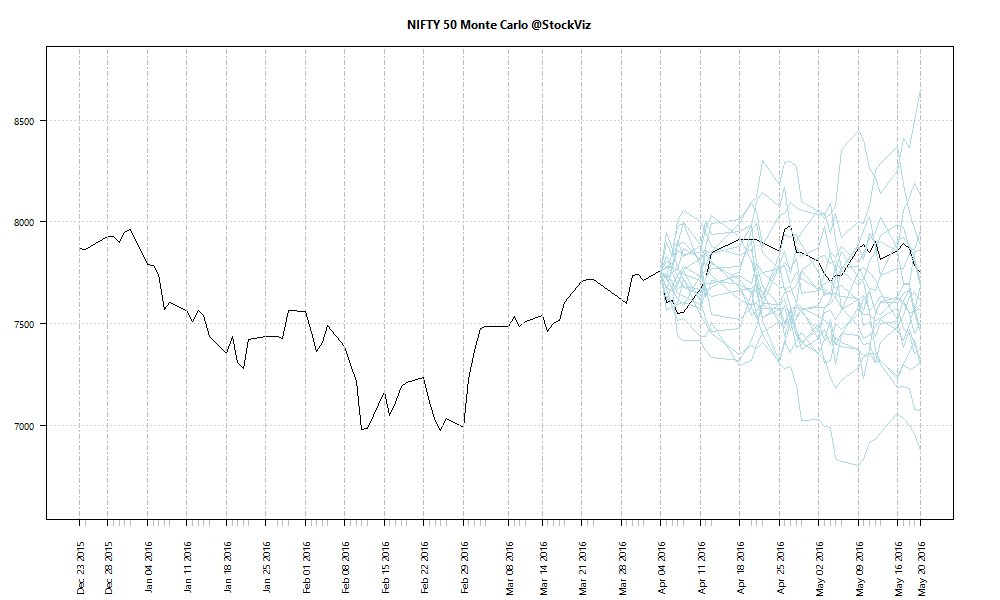
The simple thing to do after a successful back-test against historical prices is to run a Monte Carlo simulation to check if the strategy comes out ahead in most of them. This can be setup by assuming returns are normally distributed and running a simulation using the mean and standard deviation of the sample.

For instance, in the recent past, daily NIFTY 50 returns have exhibited a mean of -0.0003742873 and std. dev. of 0.01079387. When you run a simulation and plot the results over the actual closing prices of the index, you get the resulting chart:

monte-carlo.NIFTY

How many of these paths will result in a total equity wipeout of the back-tested strategy?

Theme: Low Volatility Update 09.05.2016

held since returns (%)
WIPRO
2014-May-02
+3.59
ACC
2015-Dec-31
+6.69
HDFCBANK
2015-Dec-31
+5.40
INDUSINDBK
2015-Dec-31
+8.78
CIPLA
2015-Dec-31
-14.43
PIDILITIND
2015-Dec-31
+7.10
COLPAL
2016-Feb-01
-1.47
CASTROLIND
2016-Feb-01
+2.75
CRISIL
2016-Mar-04
+11.96
HDFC
2016-Mar-04
+6.80
ASIANPAINT
2016-Mar-04
+5.00
HINDUNILVR
2016-Mar-04
-0.37
DABUR
2016-Mar-04
+14.18
POWERGRID
2016-Mar-04
+3.96
INFY
2016-Apr-05
-2.25
RELIANCE
2016-Apr-05
-4.65
HCLTECH
2016-Apr-05
-14.83
BIOCON
2016-Apr-05
+14.86
TATACHEM
2016-Apr-05
+11.53
OIL
2016-Apr-05
+5.43
Since the last rebalance on 2016-Apr-05 till 2016-May-06, this strategy has returned +3.97%

You can find more details about the Low Volatility Theme here.

Theme: HighIR Momentum Update 09.05.2016

held since returns (%)
KAJARIACER
2015-Dec-31
+8.49
HINDPETRO
2015-Dec-31
+0.26
RAJESHEXPO
2015-Dec-31
-15.97
ASHOKLEY
2015-Dec-31
+17.54
RELIANCE
2016-Feb-01
-4.52
TORNTPOWER
2016-Feb-01
-2.19
VAKRANGEE
2016-Feb-01
+0.83
NHPC
2016-Feb-01
+0.24
TATAELXSI
2016-Mar-04
-1.30
ASIANPAINT
2016-Mar-04
+5.01
WELSPUNIND
2016-Mar-04
+10.30
ZEEL
2016-Mar-04
+6.81
KANSAINER
2016-Mar-04
+4.08
GODREJCP
2016-Apr-05
+0.07
AUROPHARMA
2016-Apr-05
+7.56
RELINFRA
2016-Apr-05
+0.73
JUBILANT
2016-Apr-05
-3.16
TATASTEEL
2016-Apr-05
+5.07
APOLLOTYRE
2016-Apr-05
-5.70
TV18BRDCST
2016-Apr-05
-3.59
Since the last rebalance on 2016-Apr-05 till 2016-May-06, this strategy has returned -0.93%

You can find more details about the HighIR Momentum Theme here.