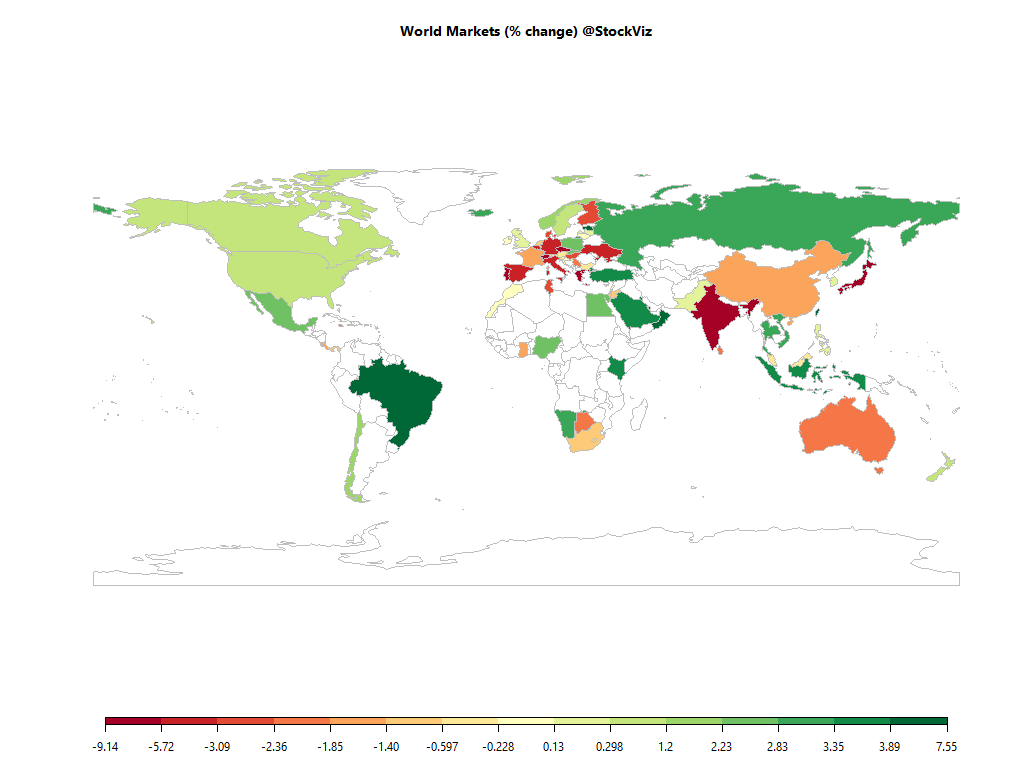
Equities
| MINTs | |
|---|---|
| JCI(IDN) | +3.52% |
| INMEX(MEX) | +2.41% |
| NGSEINDX(NGA) | +2.74% |
| XU030(TUR) | +3.56% |
| BRICS | |
|---|---|
| IBOV(BRA) | +6.39% |
| SHCOMP(CHN) | -1.50% |
| NIFTY(IND) | -7.62% |
| INDEXCF(RUS) | +3.10% |
| TOP40(ZAF) | -0.60% |
Commodities
| Energy | |
|---|---|
| Brent Crude Oil | +5.42% |
| RBOB Gasoline | +20.16% |
| WTI Crude Oil | +0.57% |
| Ethanol | -2.68% |
| Heating Oil | +3.61% |
| Natural Gas | -25.63% |
| Metals | |
|---|---|
| Copper | +1.94% |
| Palladium | +0.74% |
| Platinum | +7.21% |
| Gold 100oz | +11.54% |
| Silver 5000oz | +4.93% |
Currencies
| MINTs | |
|---|---|
| USDIDR(IDN) | -2.92% |
| USDMXN(MEX) | +0.11% |
| USDNGN(NGA) | +0.10% |
| USDTRY(TUR) | +0.22% |
| BRICS | |
|---|---|
| USDBRL(BRA) | +0.07% |
| USDCNY(CHN) | -0.53% |
| USDINR(IND) | +0.93% |
| USDRUB(RUS) | -0.89% |
| USDZAR(ZAF) | -0.25% |
| Agricultural | |
|---|---|
| Cattle | +3.18% |
| Feeder Cattle | +1.22% |
| Lean Hogs | +6.19% |
| White Sugar | +0.02% |
| Coffee (Robusta) | +0.51% |
| Corn | -4.78% |
| Lumber | +5.88% |
| Soybeans | -2.98% |
| Wheat | -6.37% |
| Cocoa | +10.09% |
| Cotton | -4.85% |
| Coffee (Arabica) | -3.26% |
| Orange Juice | -9.50% |
| Soybean Meal | -4.92% |
| Sugar #11 | +9.12% |
Credit Indices
| Index | Change |
|---|---|
| Markit CDX EM | +0.27% |
| Markit CDX NA HY | -0.58% |
| Markit CDX NA IG | +7.19% |
| Markit iTraxx Asia ex-Japan IG | +5.66% |
| Markit iTraxx Australia | +15.41% |
| Markit iTraxx Europe | +9.54% |
| Markit iTraxx Europe Crossover | +45.82% |
| Markit iTraxx Japan | +12.00% |
| Markit MCDX (Municipal CDS) | +3.25% |
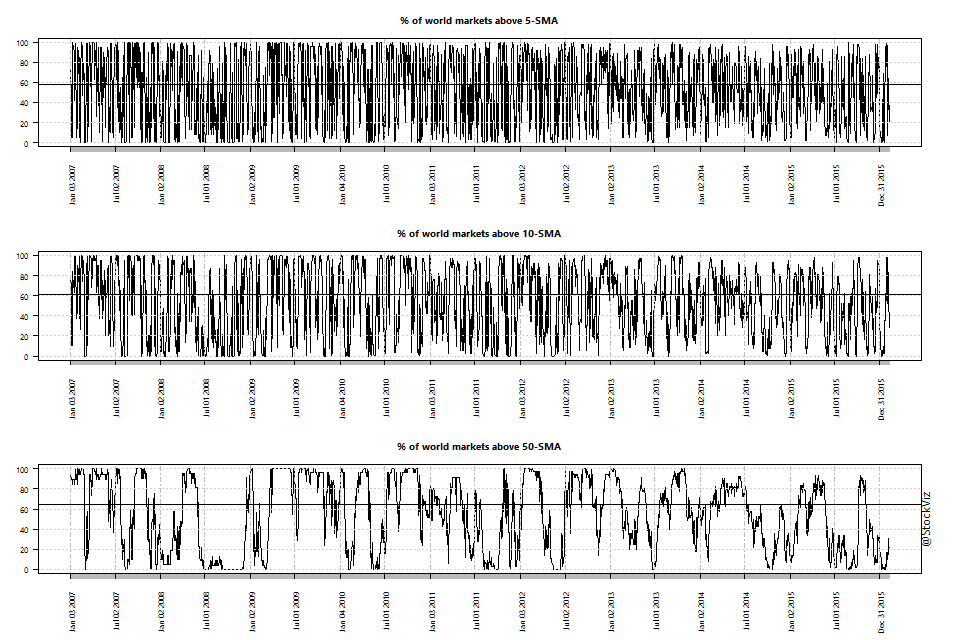
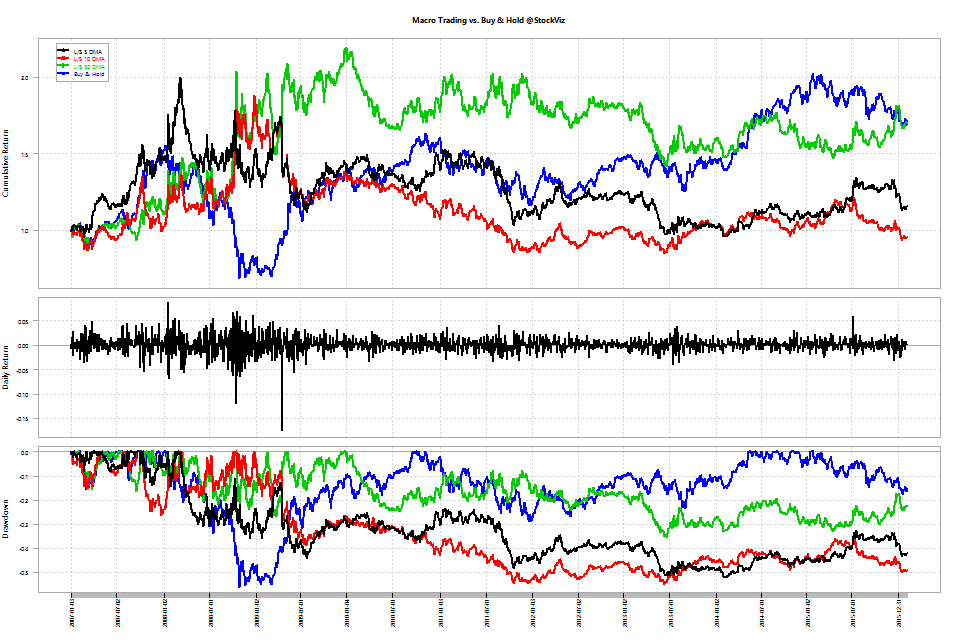
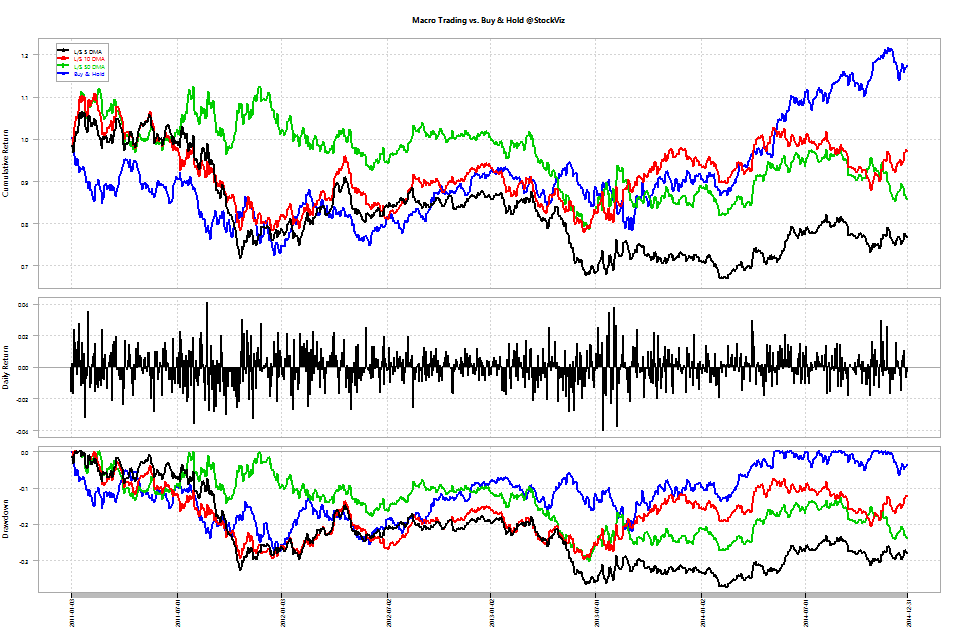
Jan and Feb saw a wave of volatility hit pretty much every asset class. Diversification provided scant protection in wave-after-wave of selling across world markets and asset classes. Hopefully the great purge is done and we can look forward to better days ahead…
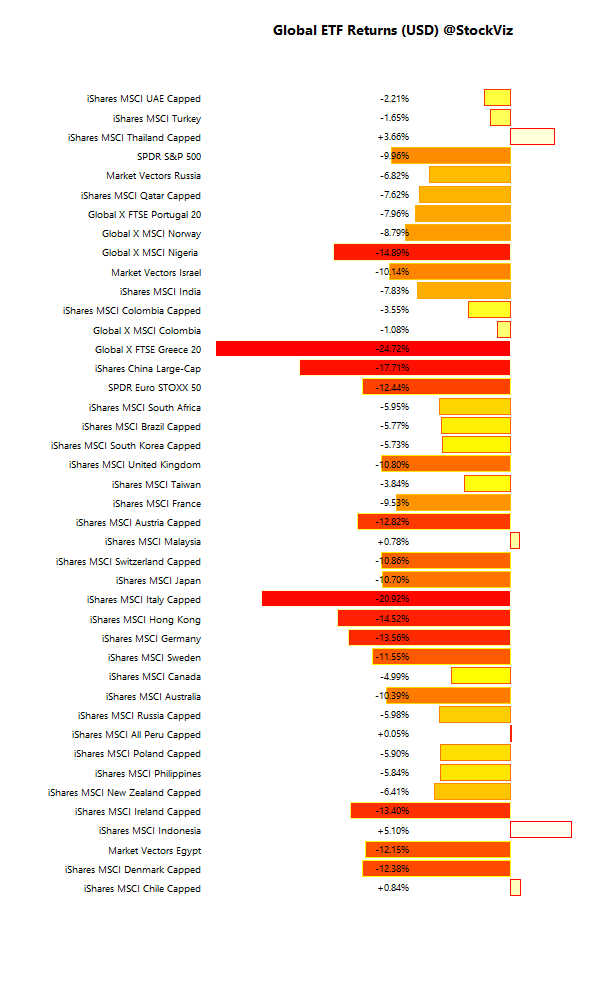
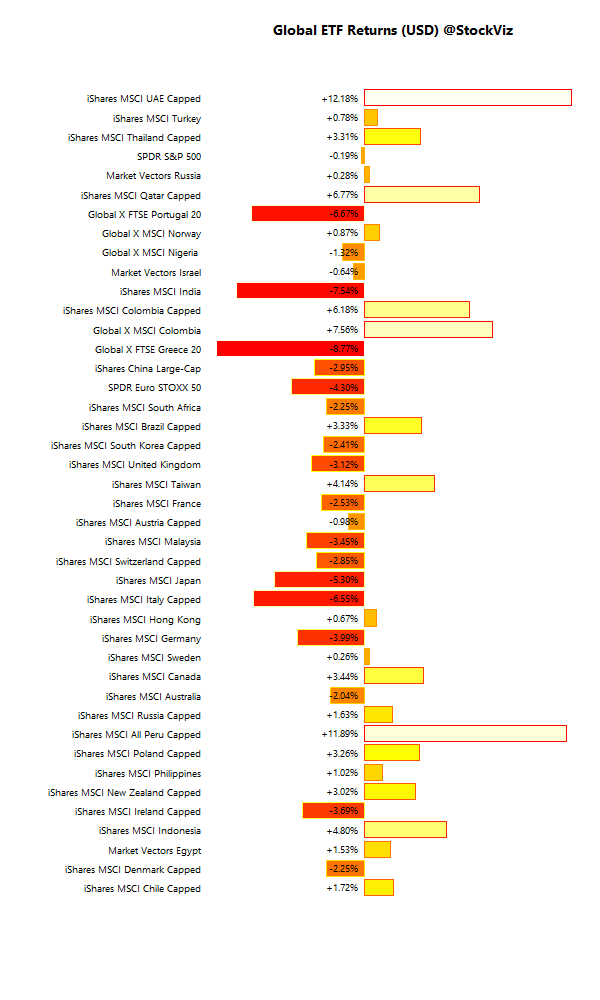
International ETFs (USD)
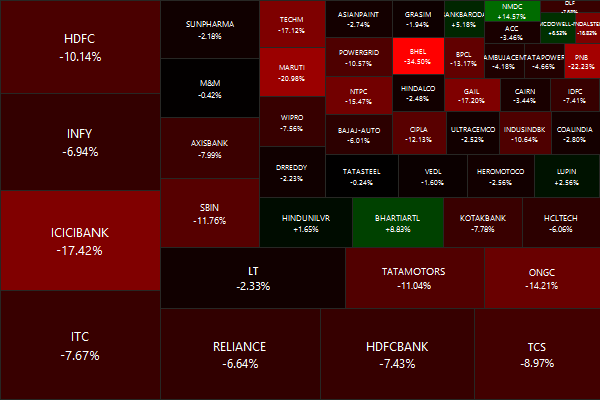
Nifty Heatmap
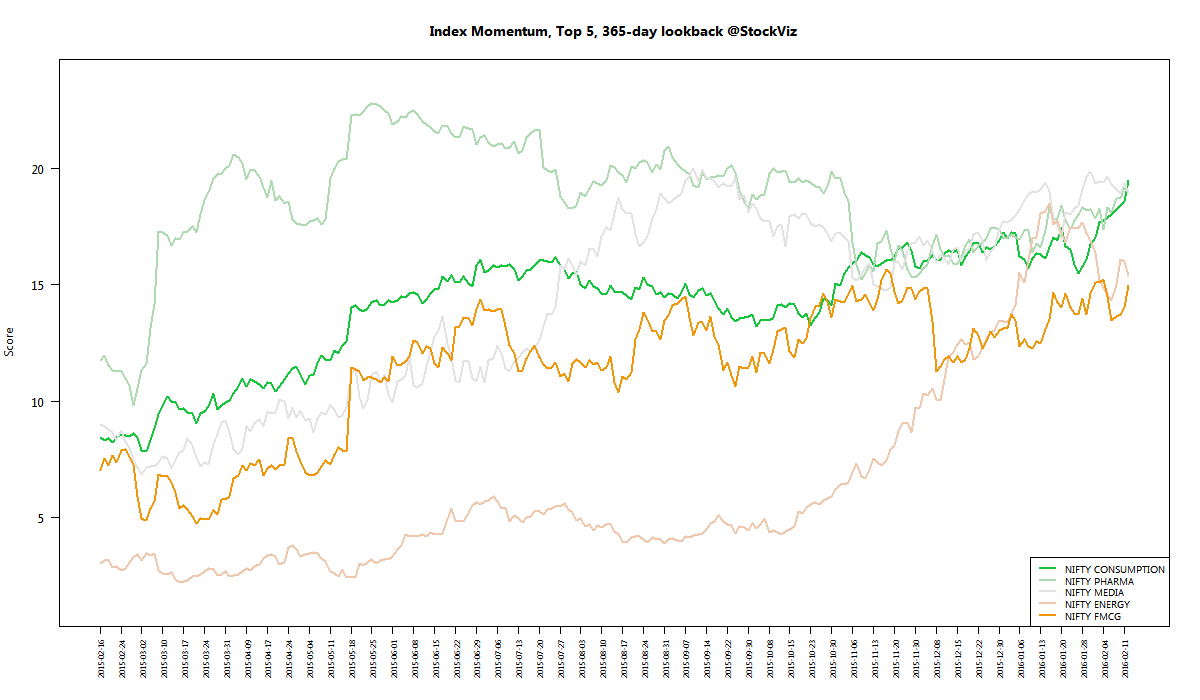
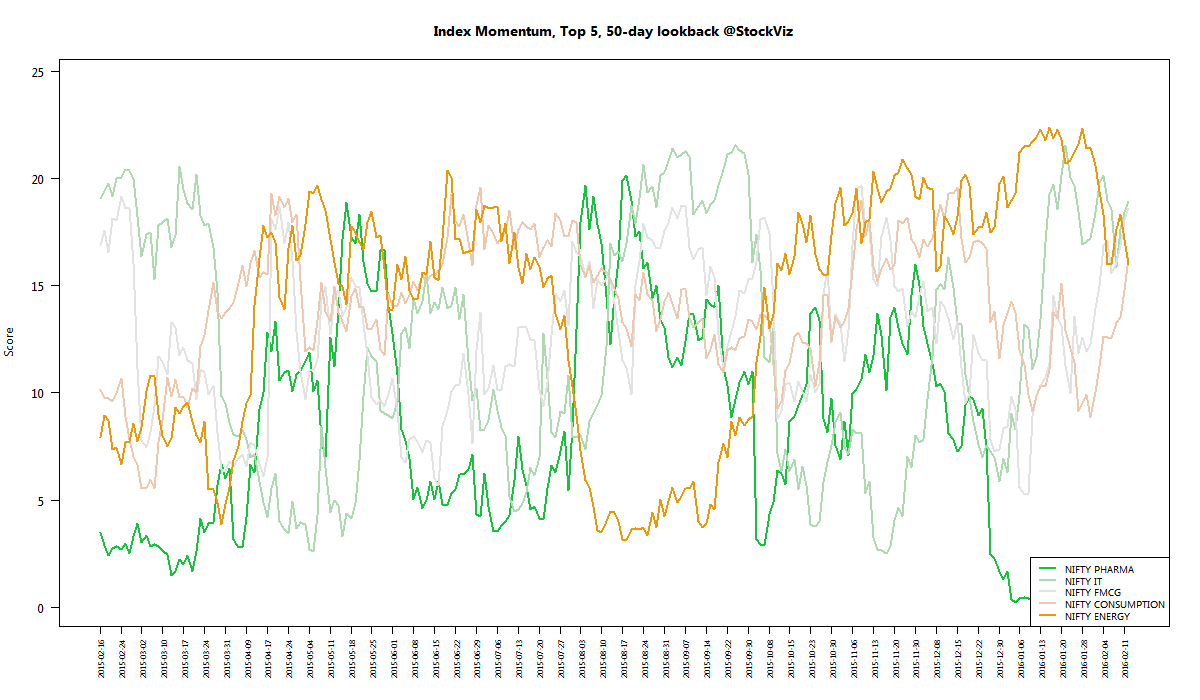
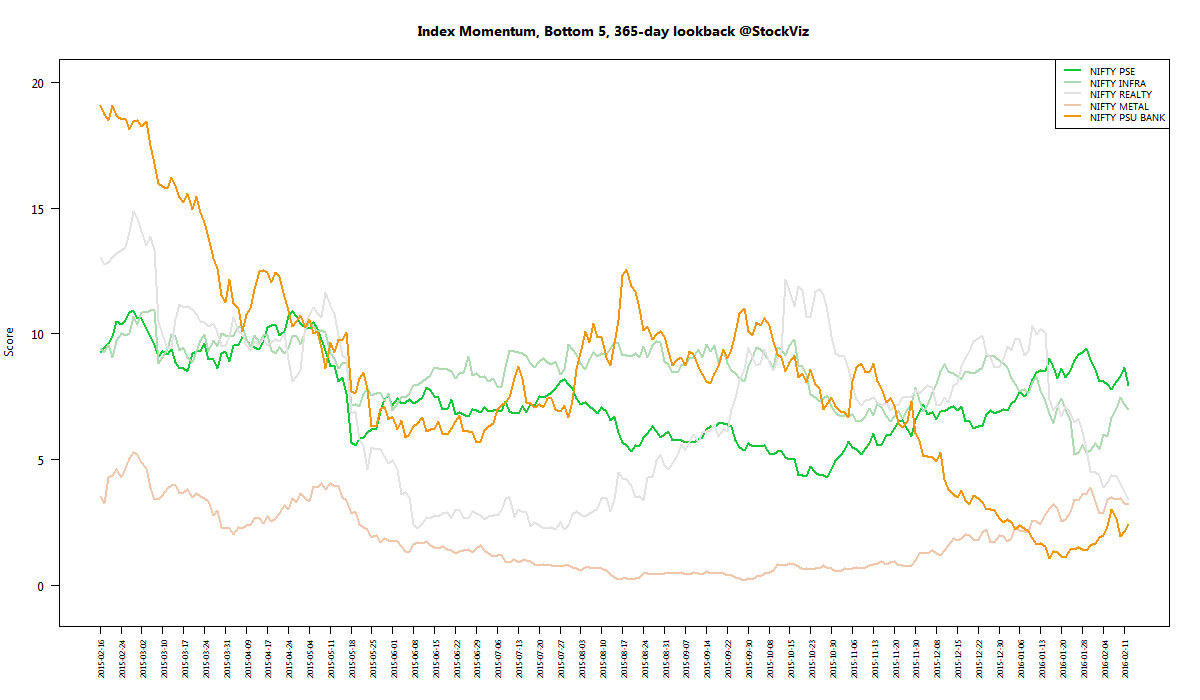
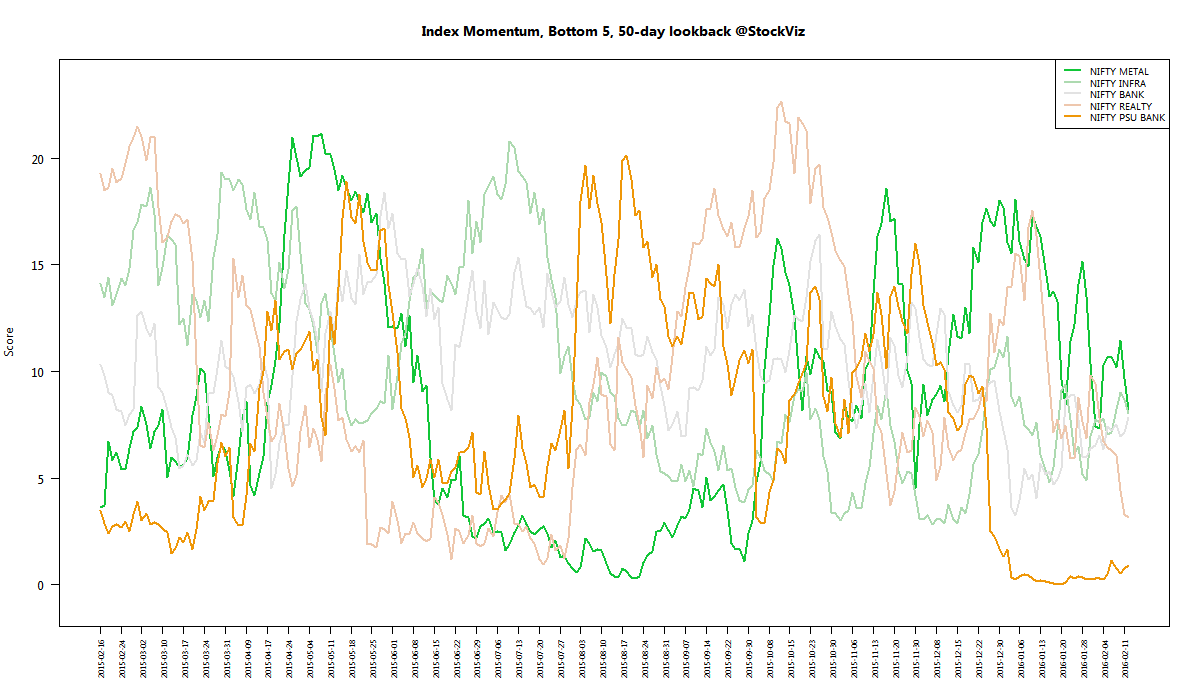
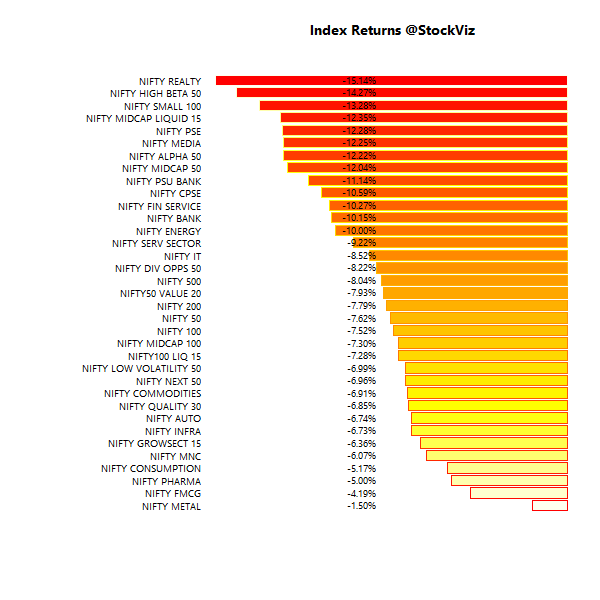
Index Returns
Market Cap Decile Performance
| Decile | Mkt. Cap. | Adv/Decl |
|---|---|---|
| 1 (micro) | -22.65% | 46/80 |
| 2 | -19.11% | 29/96 |
| 3 | -20.26% | 31/95 |
| 4 | -17.46% | 30/95 |
| 5 | -16.40% | 31/95 |
| 6 | -15.09% | 37/88 |
| 7 | -12.49% | 42/84 |
| 8 | -12.19% | 34/91 |
| 9 | -11.15% | 50/76 |
| 10 (mega) | -6.23% | 63/63 |
Mid- small- and micro-caps bore the brunt…
Top Winners and Losers
| MARICO | +6.81% |
| BHARTIARTL | +8.83% |
| EICHERMOT | +14.23% |
| BHEL | -34.50% |
| PNB | -22.23% |
| AUROPHARMA | -21.41% |
Eicher Motors emerged a big winner…
ETF Performance
| GOLDBEES | +9.31% |
| JUNIORBEES | -6.73% |
| INFRABEES | -6.80% |
| NIFTYBEES | -7.07% |
| CPSEETF | -9.72% |
| BANKBEES | -9.83% |
| PSUBNKBEES | -11.21% |
Gold. Enuf said.
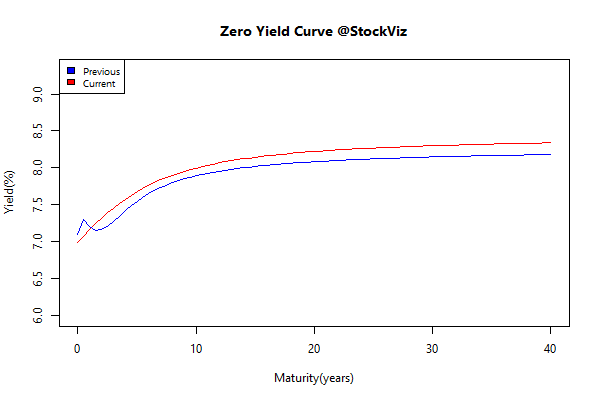
Yield Curve
Bond Indices
| Sub Index | Change in YTM | Total Return(%) |
|---|---|---|
| 0 5 | +0.14 | +0.28% |
| 5 10 | +0.12 | +0.02% |
| 10 15 | +0.15 | -0.42% |
| 15 20 | +0.12 | -0.41% |
| 20 30 | +0.11 | -0.38% |
Long bonds got shellacked…
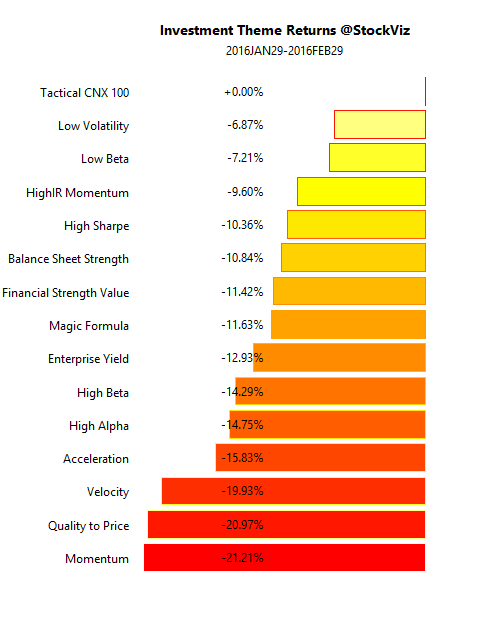
Investment Theme Performance
| Tactical CNX 100 | +0.00% |
| Low Volatility | -6.87% |
| Low Beta | -7.21% |
| HighIR Momentum | -9.60% |
| High Sharpe | -10.36% |
| Balance Sheet Strength | -10.84% |
| Financial Strength Value | -11.42% |
| Magic Formula | -11.63% |
| Enterprise Yield | -12.93% |
| High Beta | -14.29% |
| High Alpha | -14.75% |
| Acceleration | -15.83% |
| Velocity | -19.93% |
| Quality to Price | -20.97% |
| Momentum | -21.21% |
Equity Mutual Funds
| Worst | |
|---|---|
| HDFC Core and Satellite Fund – GROWTH | -13.71% |
| Reliance Small Cap Fund – Growth Plan – Growth Option | -13.79% |
| Sahara Star Value Fund-Growth Option | -13.83% |
| Sundaram S.M.I.L.E.Fund-iNST Growth | -14.80% |
| Sundaram S.M.I.L.E.Fund-Growth | -14.82% |
| HDFC INFRASTRUCTURE FUND-GROWTH OPTION | -15.01% |
| Edelweiss Emerging Leaders Fund – Growth | -17.20% |
Bond Mutual Funds
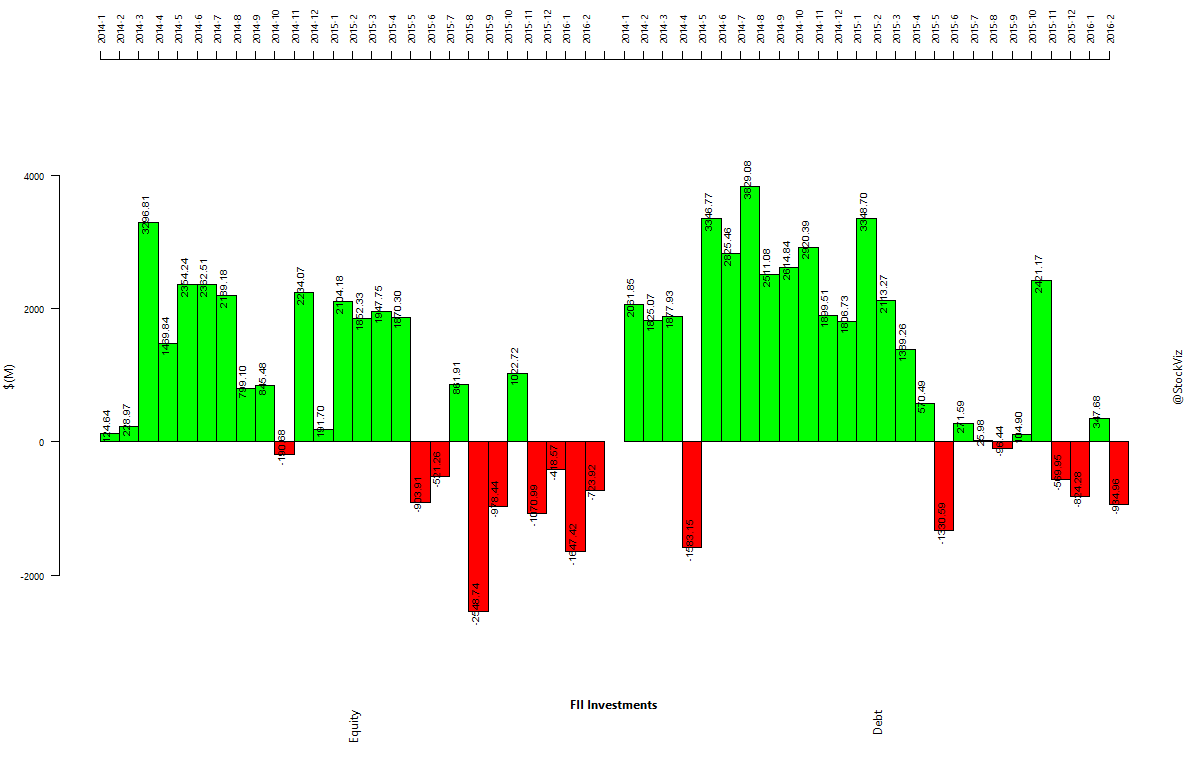
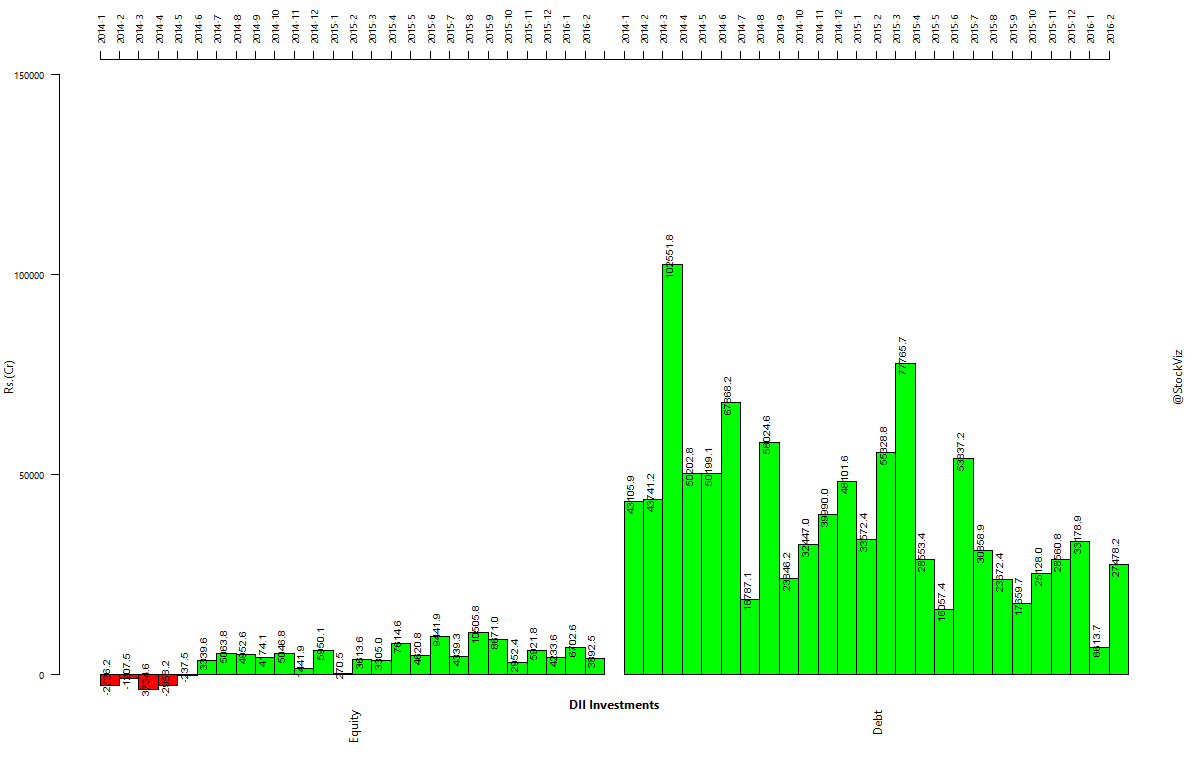
Fund flows
FIIs sold out of both equities and bonds…
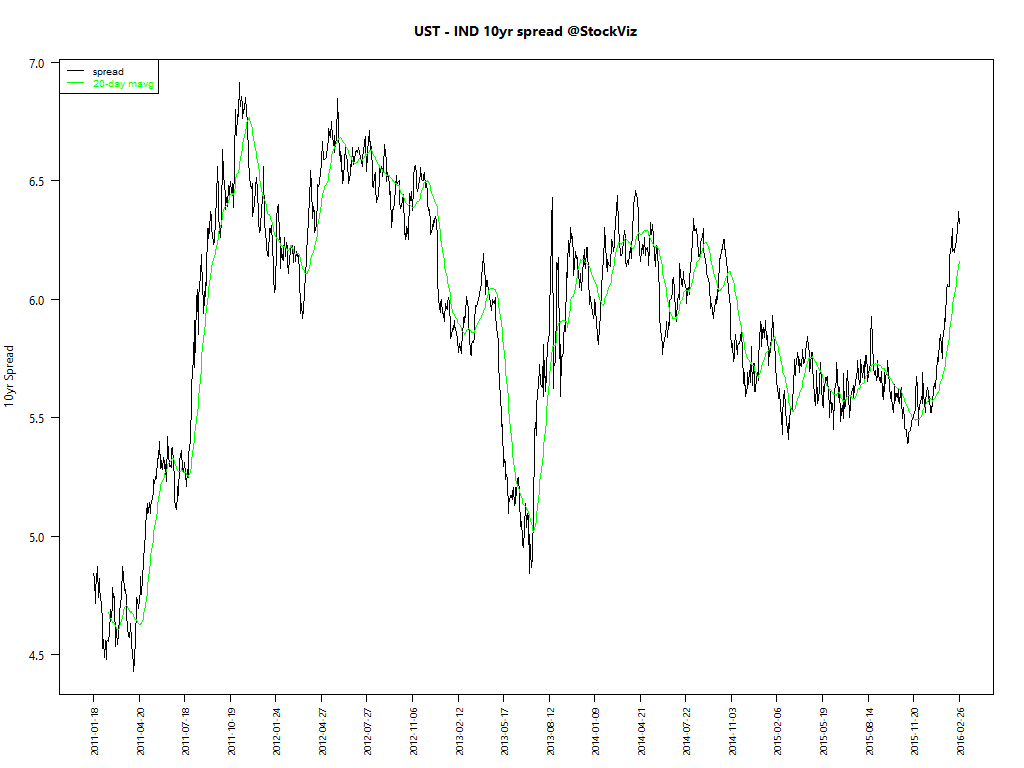
Bonds
The spread between 10-year US treasuries and Indian gilts are at levels seen in late 2013…
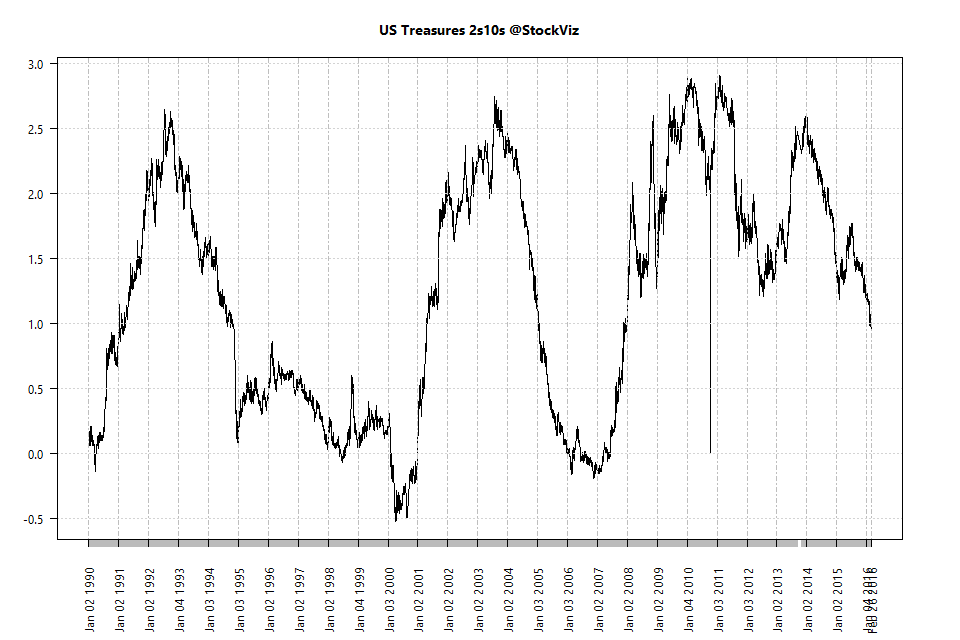
… and all is not hunky-dory in the US bond markets either. The spread between 10yrs and 2yrs are at their lowest since 2008…
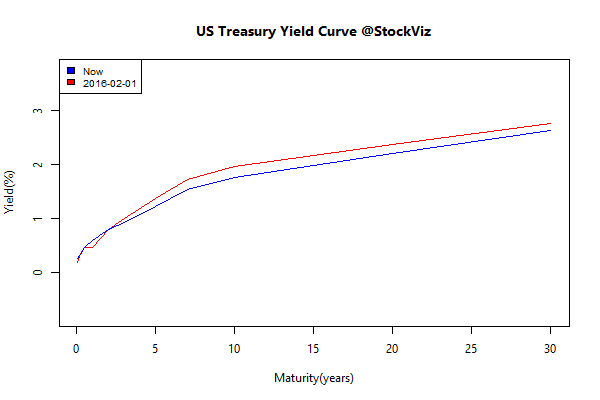
… and the whole yield curve shifted down in February.
Thoughts
As we hit ‘publish’ on this article, Indian markets are enjoying a post-budget rally. Did markets find a bottom in February? Or is more pain to come? Bring on the March madness!