More returns for less risk
Our previous post on Momentum highlighted the inherent cliff-risk in the “buy-high, sell-higher” strategy. But even before Fama French published their 3-Factor paper, researchers had found that the “high risk = high reward” relationship is quite fragile. In 1972, Haugen, Robert A., and A. James Heins, studying the period from 1926 to 1971, came out with a working paper – On the Evidence Supporting the Existence of Risk Premiums in the Capital Market (ssrn) – that concluded that over the long run stock portfolios with lesser variance in monthly returns have experienced greater average returns than their ‘riskier’ counterparts (wikipedia).
Basically, a portfolio of low-volatility stocks will out-perform the market. More returns for less risk.
What Explains the Anomaly?
There are two main trains of thought on why this anomaly persists.
It is difficult to short high-beta stocks and buy low-beta stocks. Because, if it were easy, one could construct a zero-beta portfolio with positive expected returns… and this anomaly would vanish.
Stocks of companies with predictable earnings exhibit low-volatility. So, low-volatility is essentially high-quality – a known investment factor.
Historical Performance
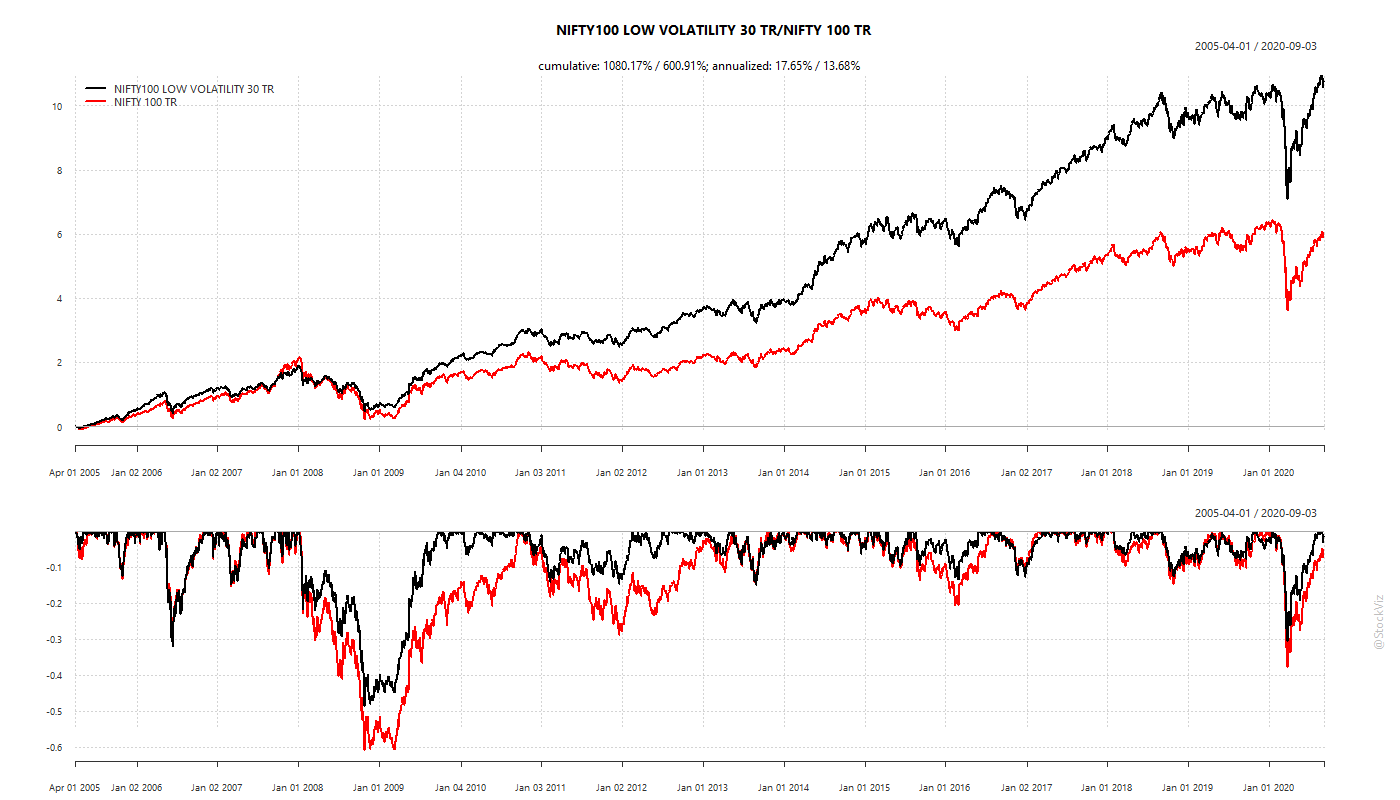
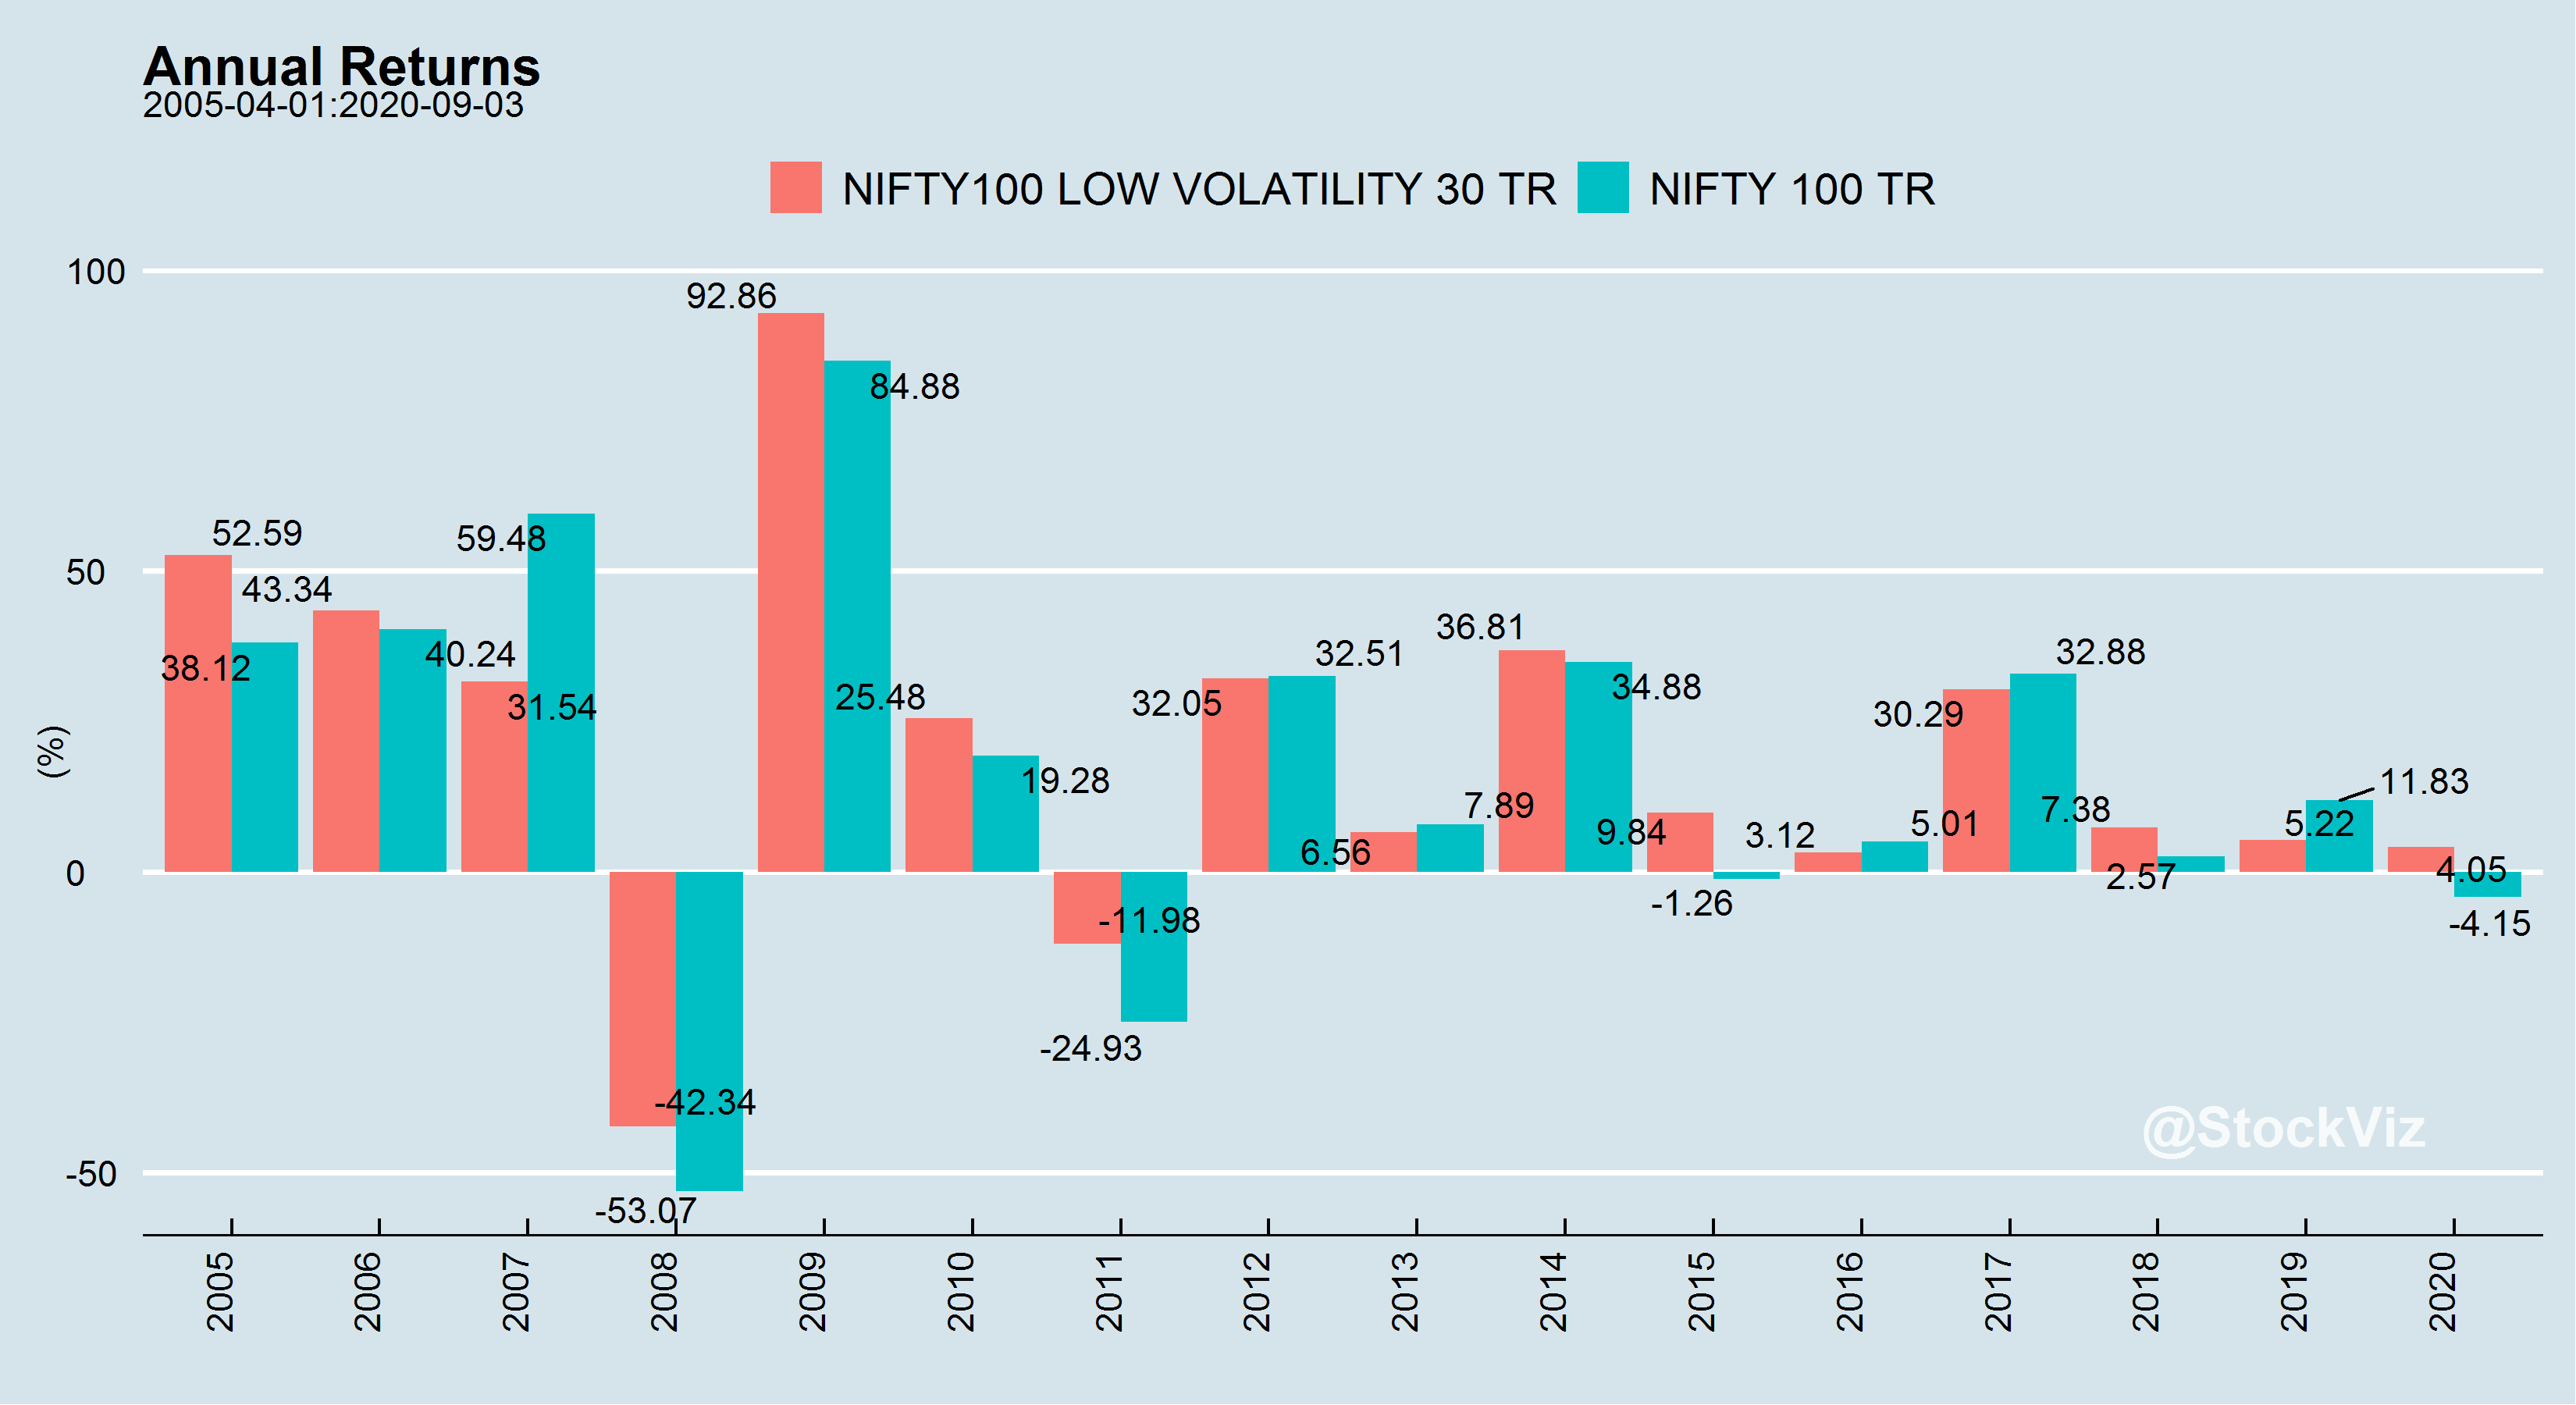
While low-volatility has out-performed market indices, it is magic wand that makes drawdowns disappear.
India
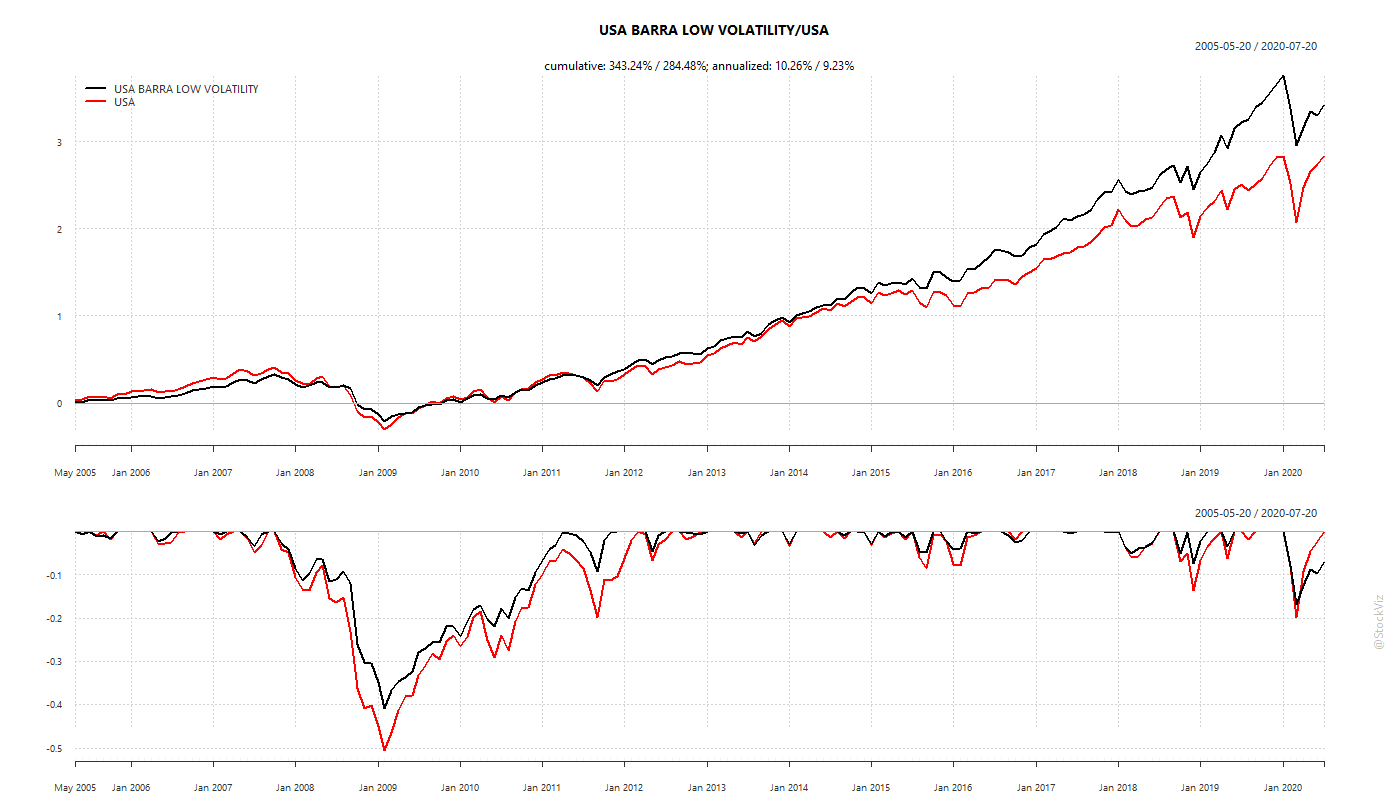
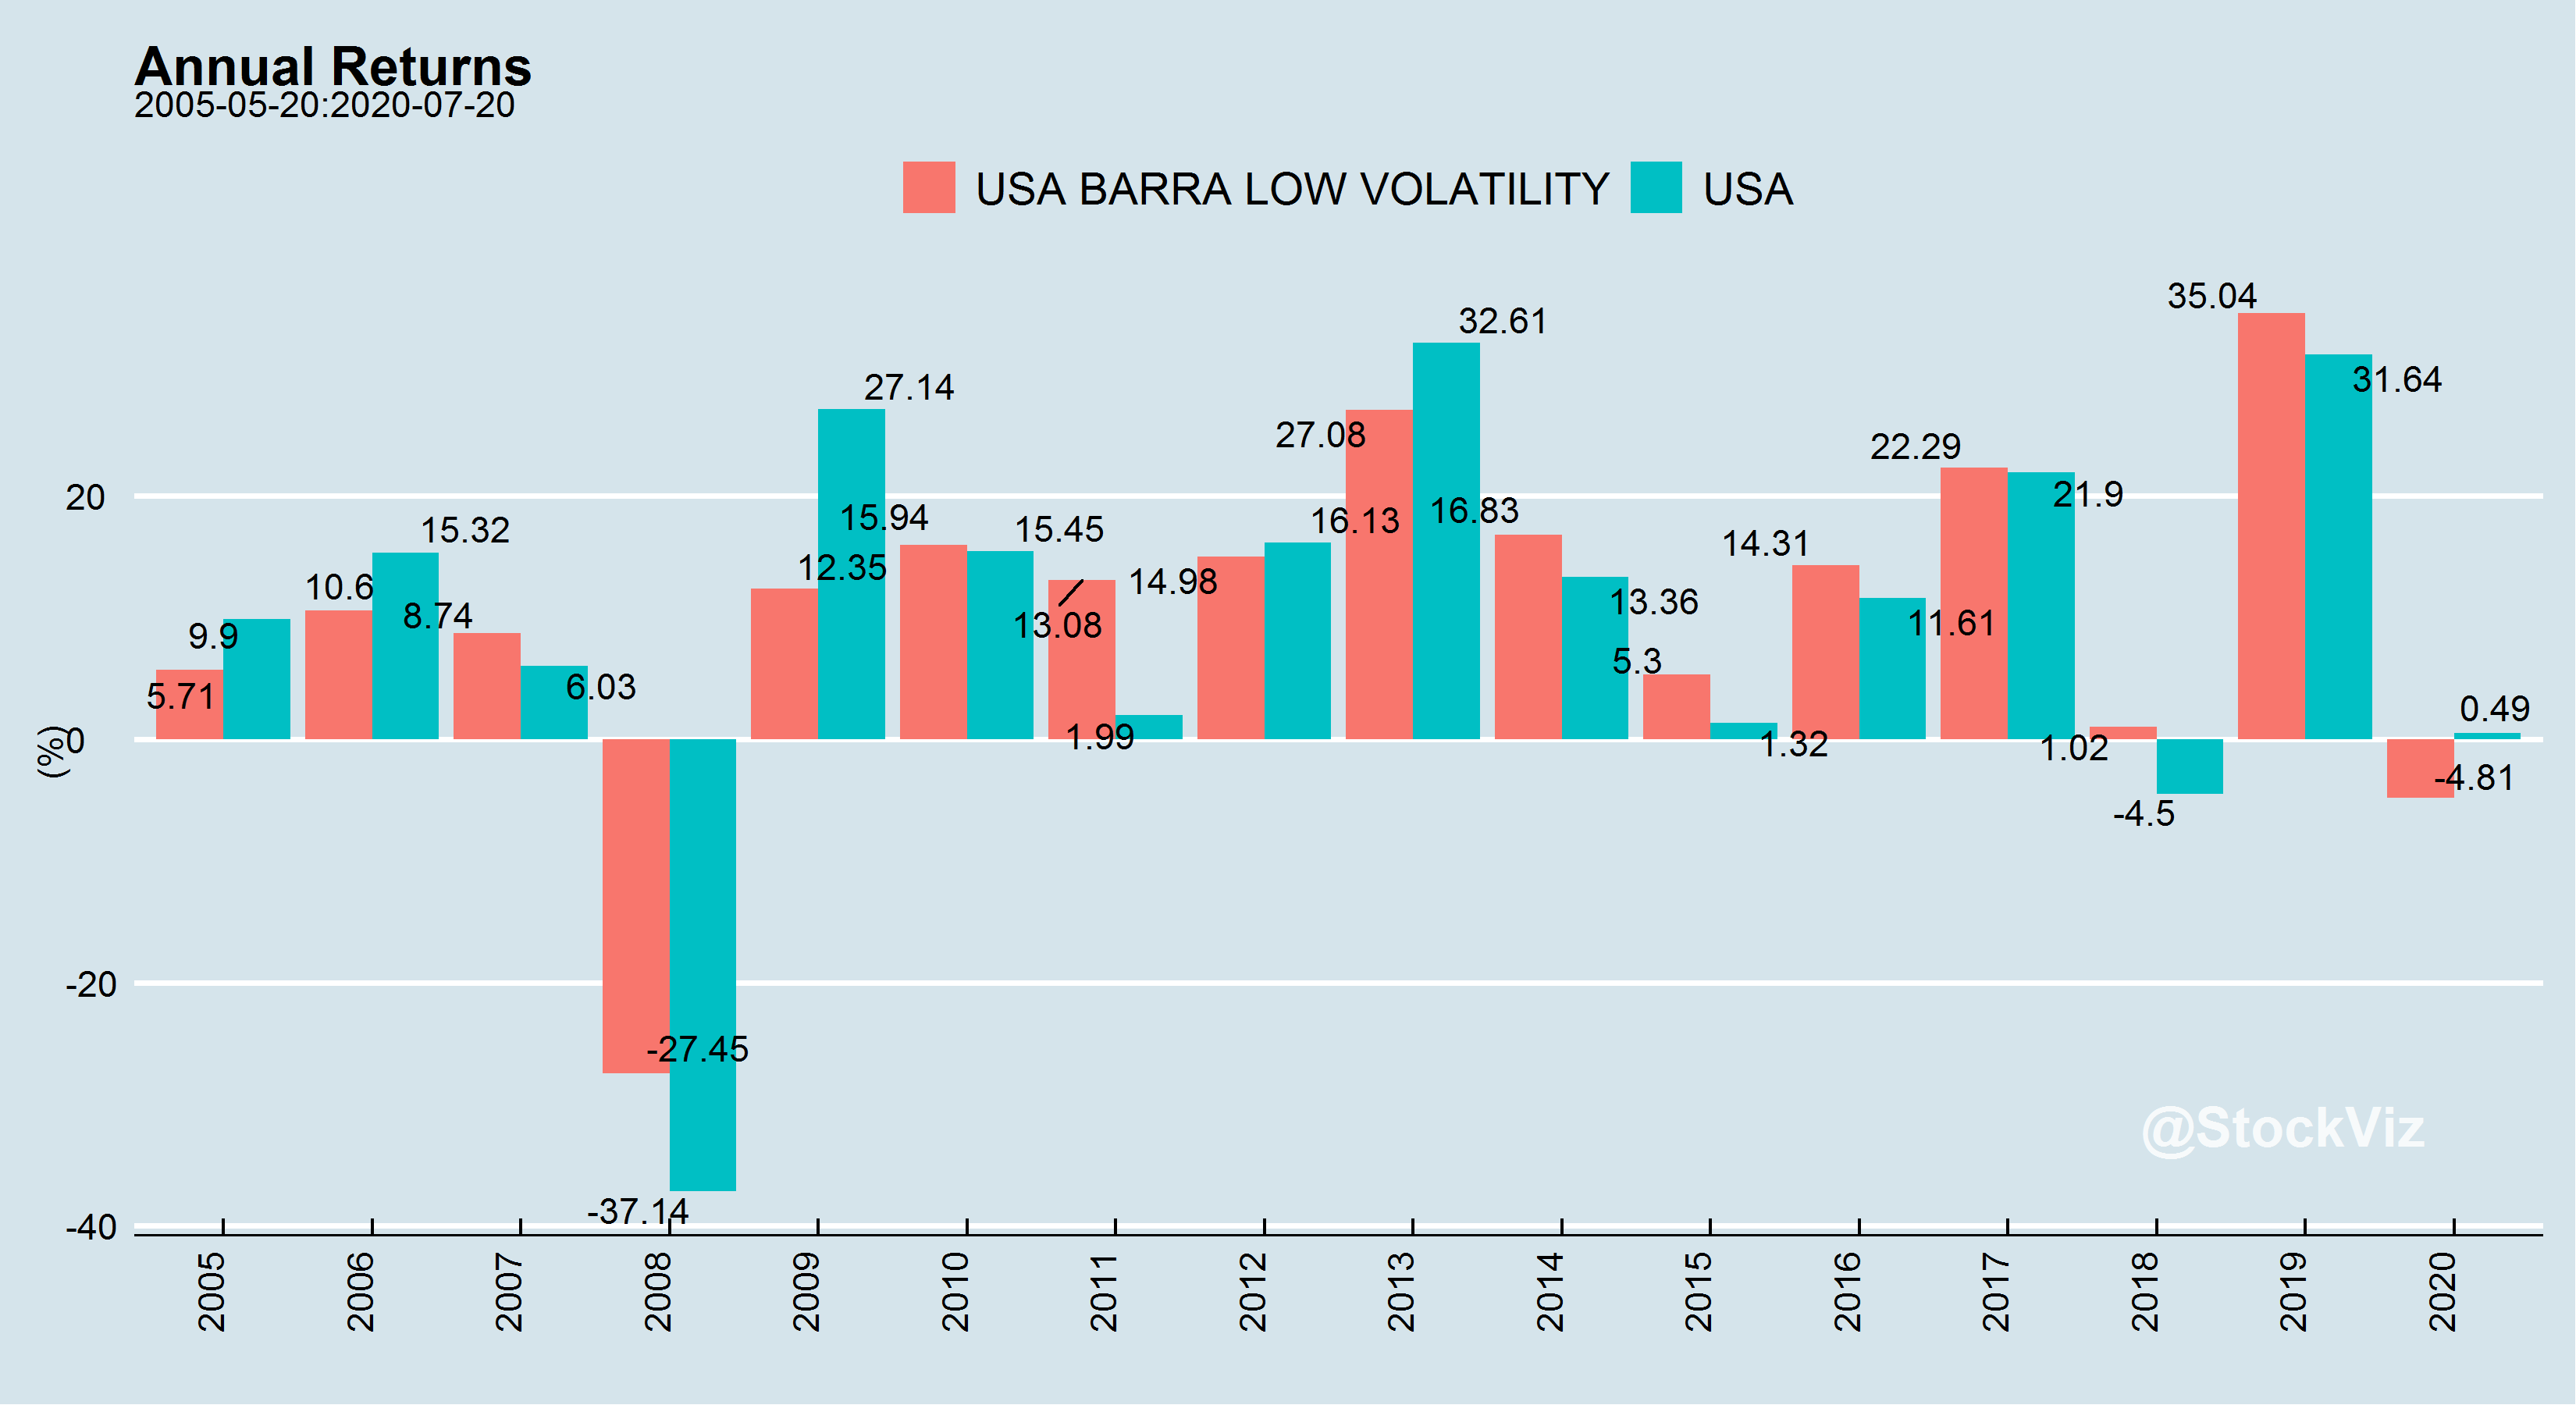
US
Risks
The biggest risk in a portfolio of low-volatility stocks is that a large proportion of it could be held by weak hands – investors who are drawn to it primarily because of its low-volatility. And when faced with a drawdown that is steeper than historical experience, they can simultaneously head for the exits, resulting in a cascading drop in price. The triggers could be a missed earnings estimate, an industrial accident, etc. While momentum investors are used to being routinely hit in the head, a small shove can push low-volatility investors down a cliff.
Portfolio Construction
A portfolio of low-volatility stocks vs. a low-volatility portfolio of stocks.
While initial research focused on stocks that had low-volatility, a collection of low-volatility stocks can result in a portfolio with high-volatility if the correlations among them are high. To illustrate, consider two low-volatility stocks who’s volatility varies through time like this:
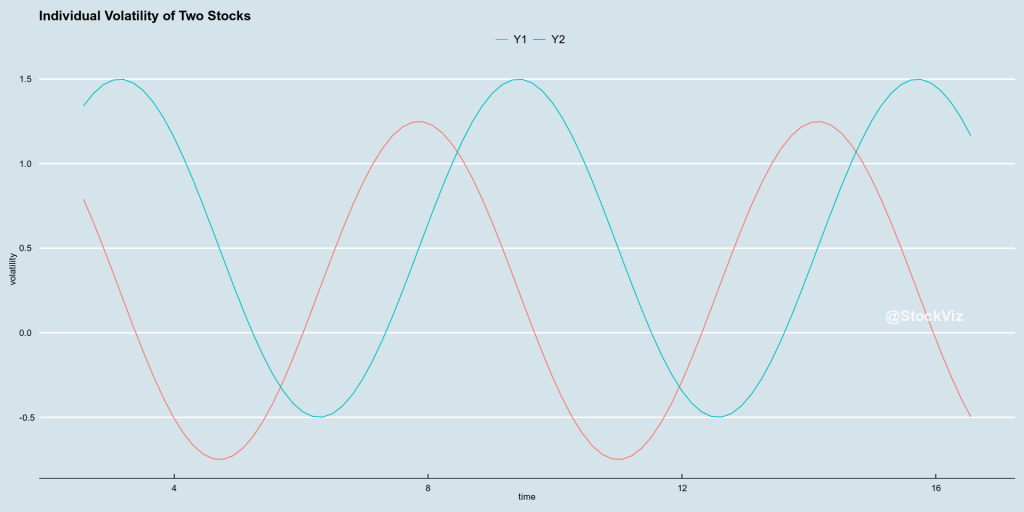
If you put them in the same portfolio, what happens to the portfolio volatility?
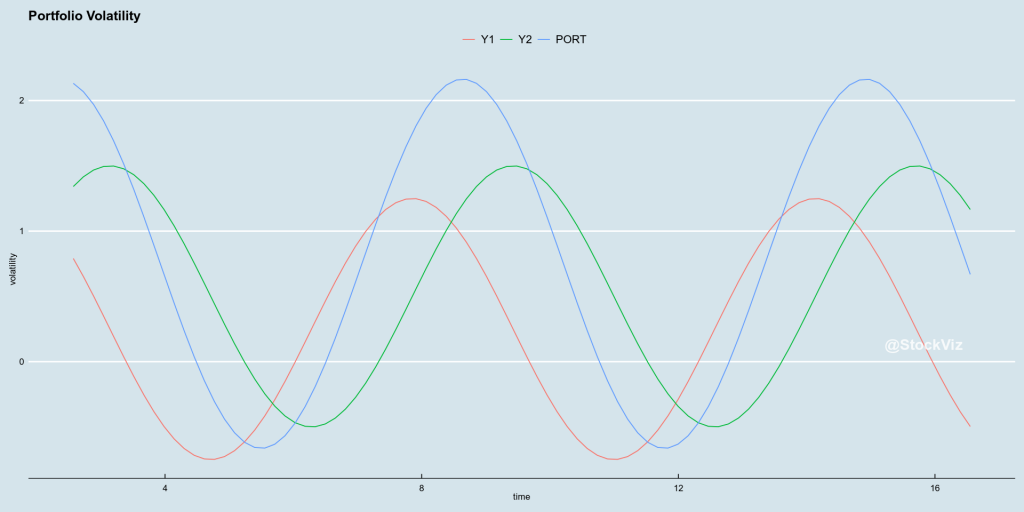
Now, what if you picked two stocks whose volatility were inversely correlate? In theory, you can mix to high-volatility stocks and get a low-volatility portfolio.
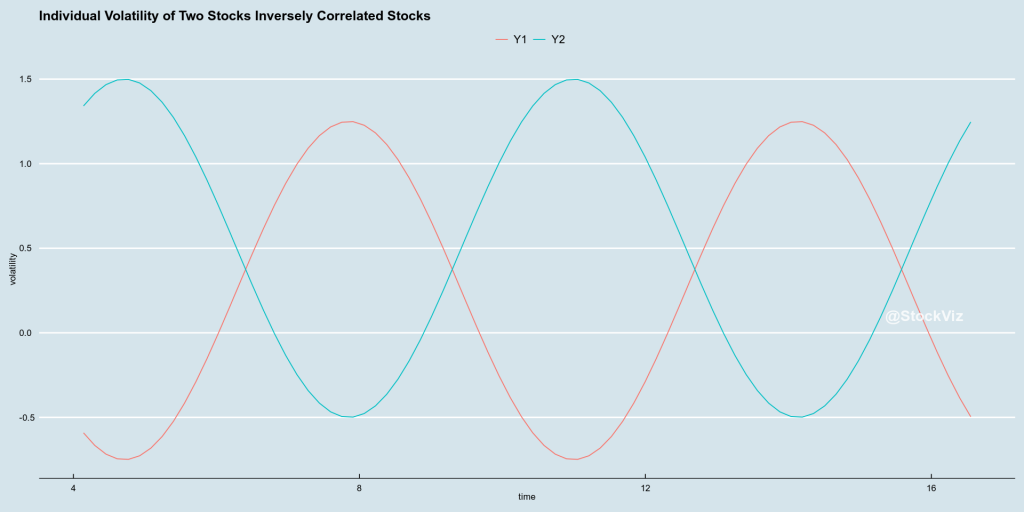
Resulting in:
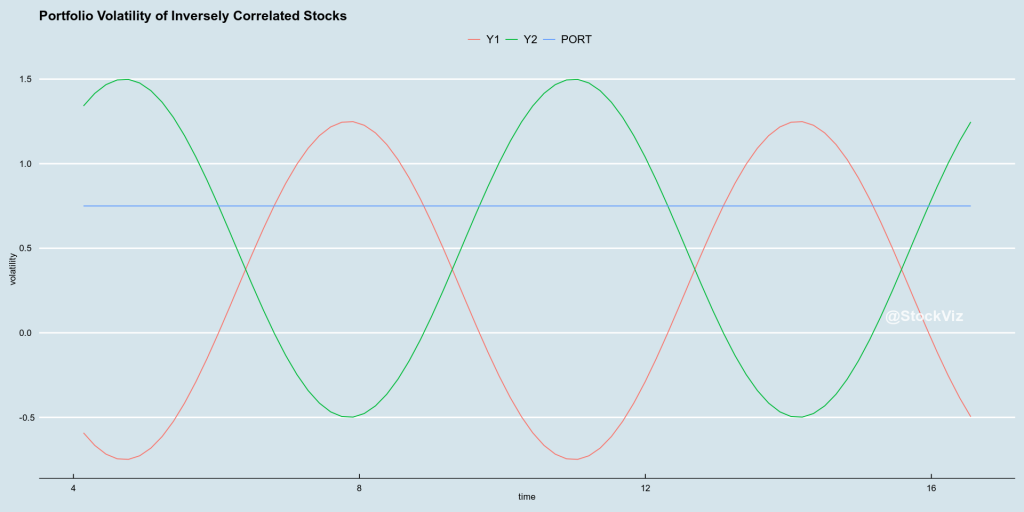
Source: Low Volatility: Stock vs. Portfolio, StockViz
Min-Vol vs. Low-Vol
A Min-Vol portfolio tries to optimize the overall portfolio volatility. A completely different approach to having a portfolio of Low-Vol stocks. In the US, there are two large ETFs that track these different approaches: USMV – the iShares Edge MSCI Min Vol USA ETF, and SPLV – the Invesco S&P 500 Low Volatility ETF.
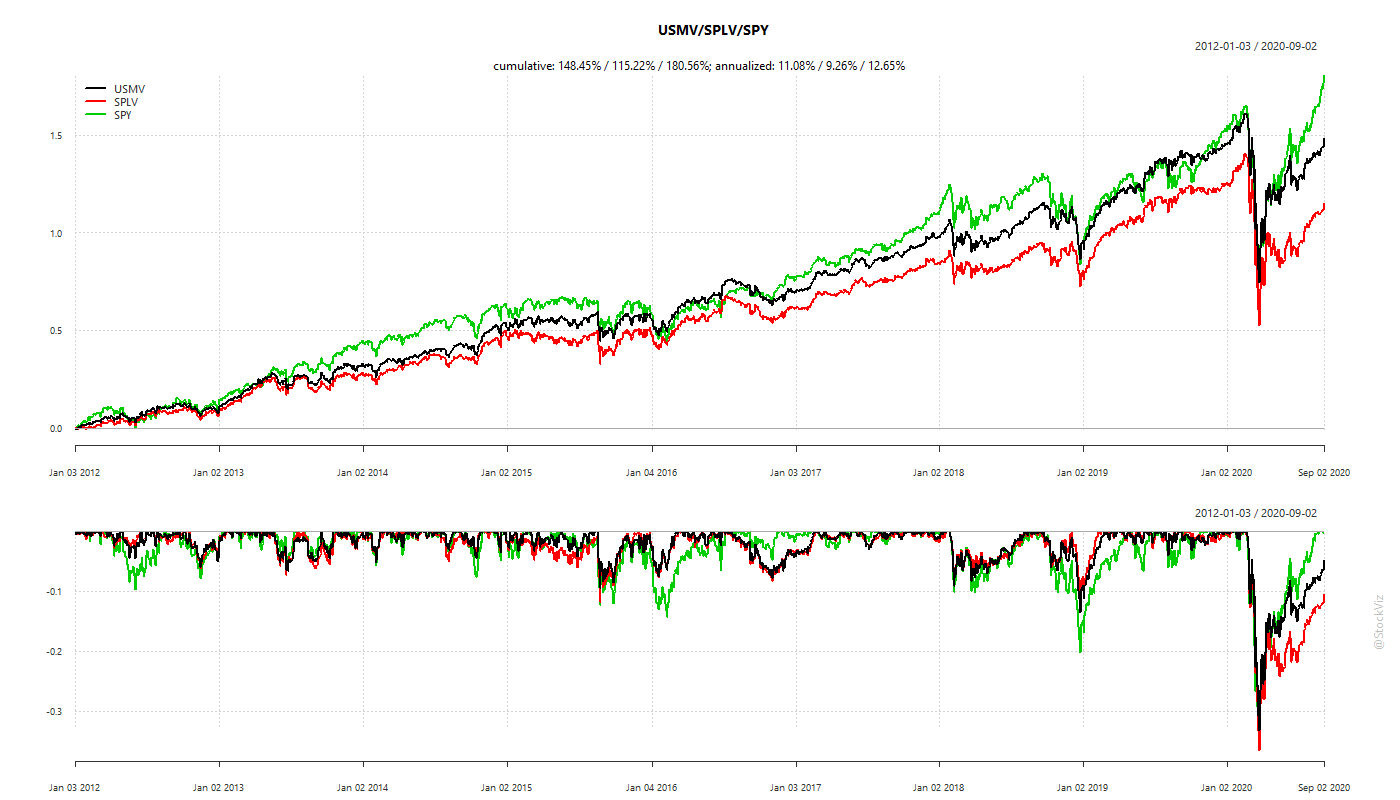
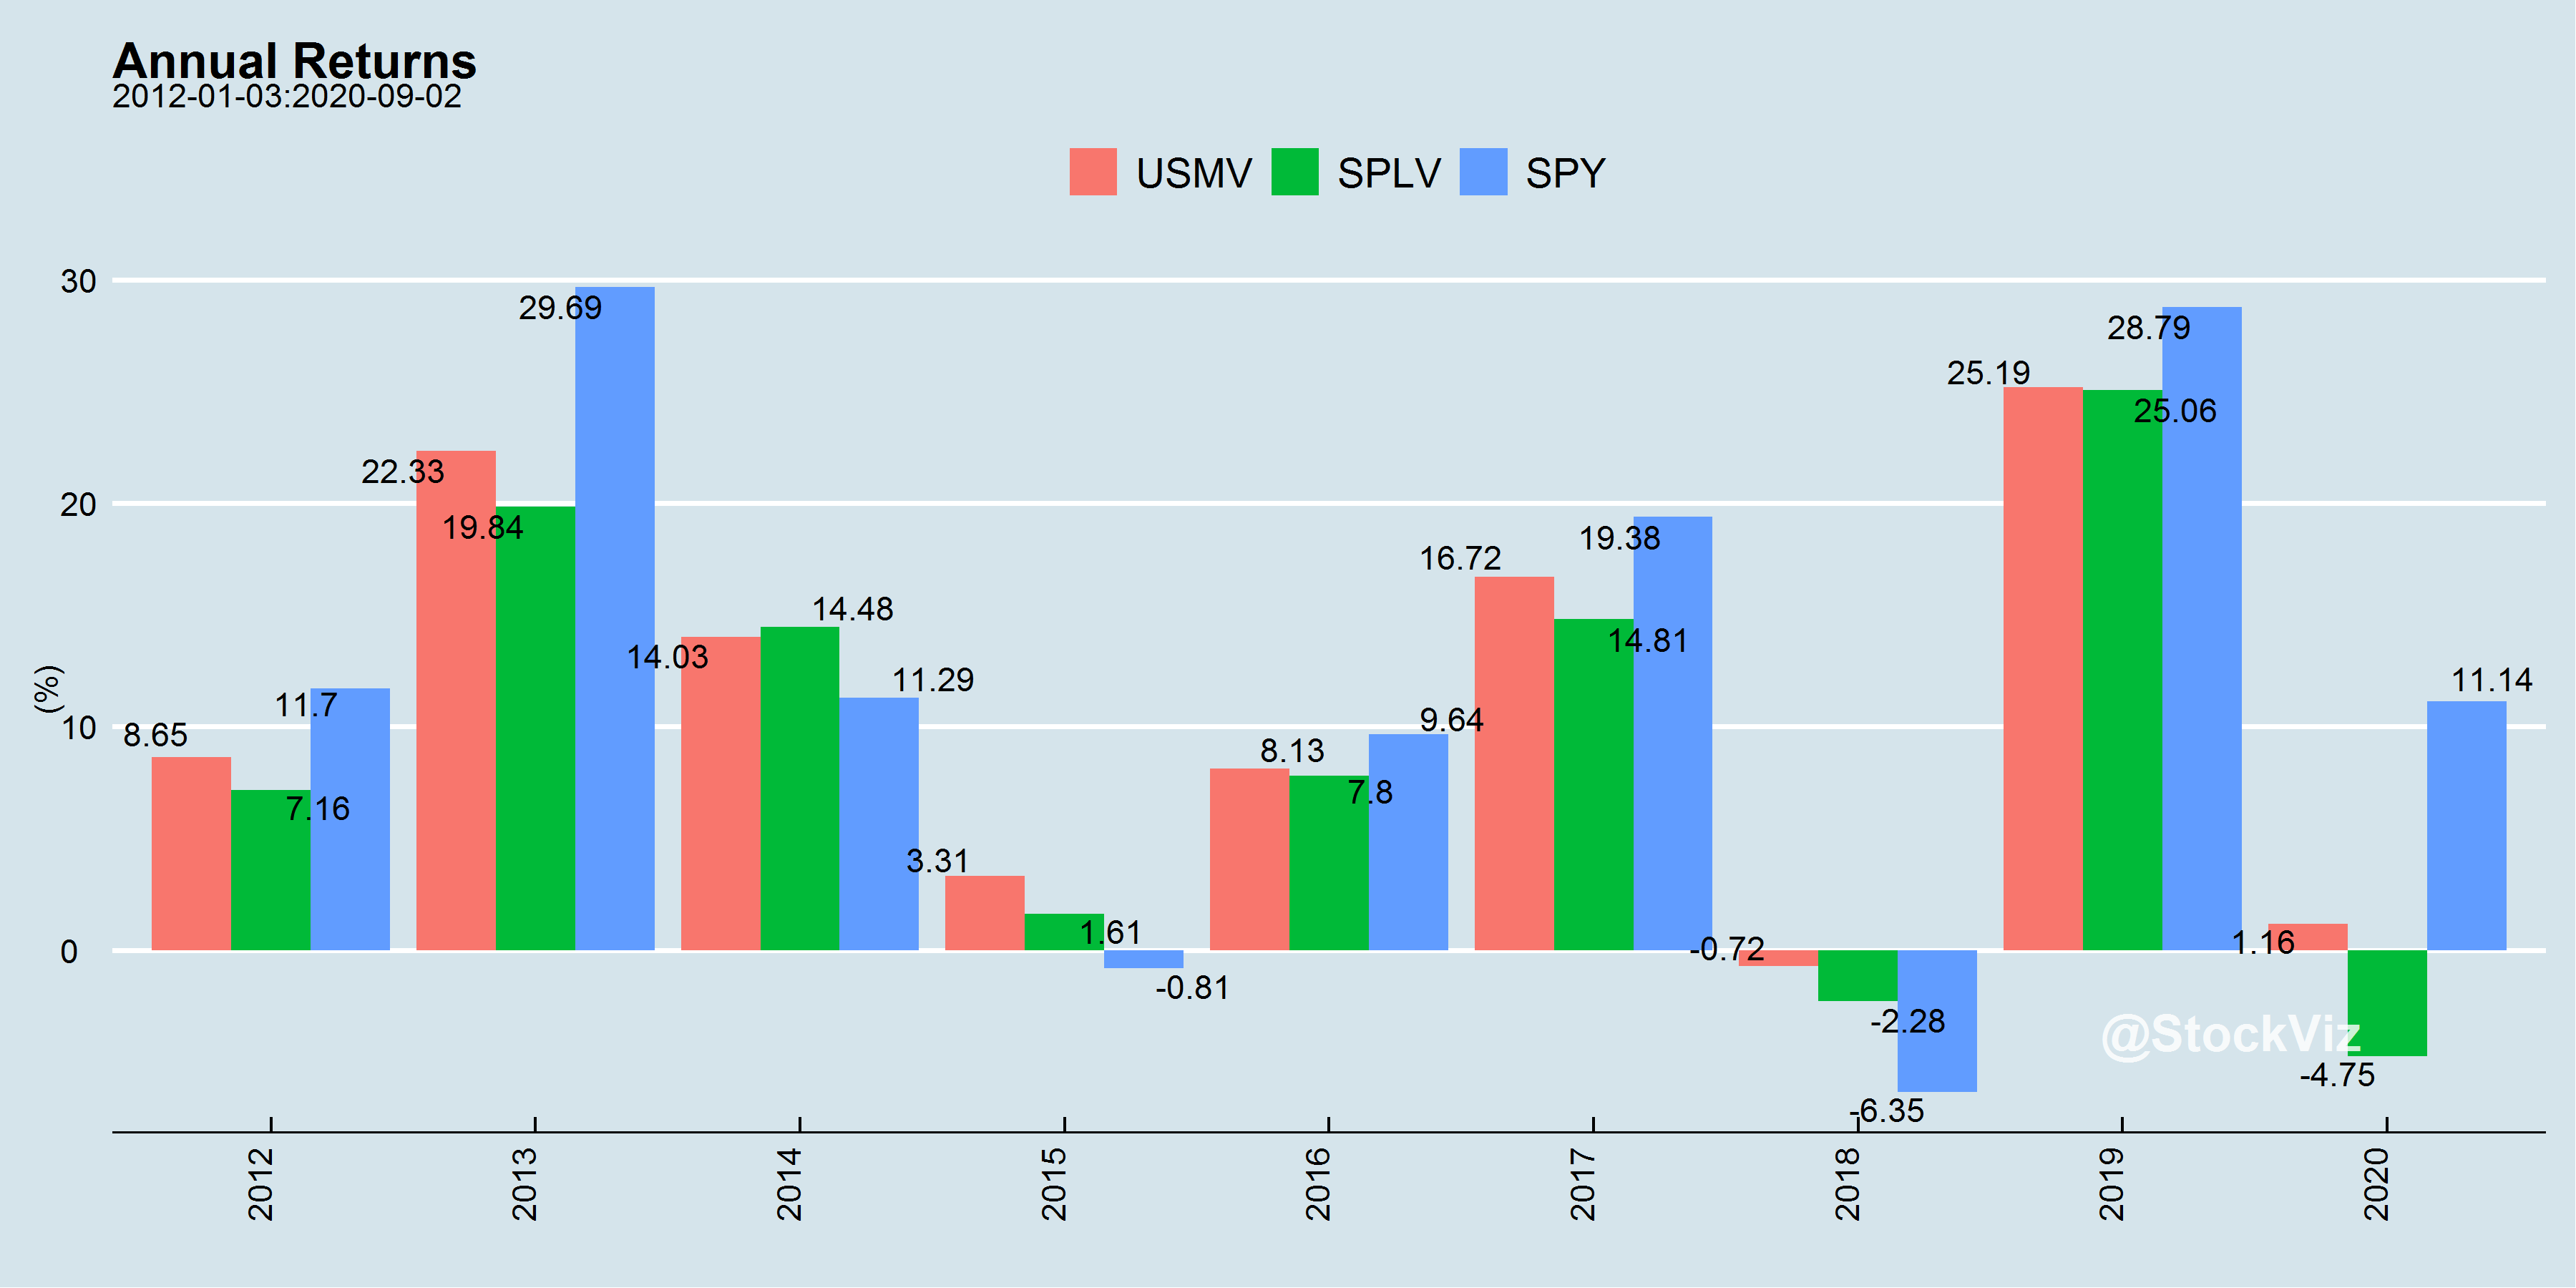
It appears that Min-Vol has an edge over Low-Vol in most scenarios.
Conclusion
While Momentum of Min/Low Volatility can appear to be diametrically different strategies, there are ways to mix them up in the same portfolio to achieve a lower-volatility momentum or a higher-return-low-vol outcomes.
However, at the end of the day, retail investors will forever be at the mercy of market beta. So, irrespective of which flavor of jam you like, the kind of bread you eat makes the biggest difference!
Enjoy the discussion: