Author: Abhishek

Analysis: ITC

This week’s pick is [stockquote]ITC[/stockquote]. Trading at 52 week high of Rs. 280, the stock has a return of close to 40% over the last 12 month period. The stock has been in a consistent uptrend for the last year, a small correction happened close to Rs. 250, but a pullback was seen from the Rs. 227 levels with affirming volumes. 

imageimage

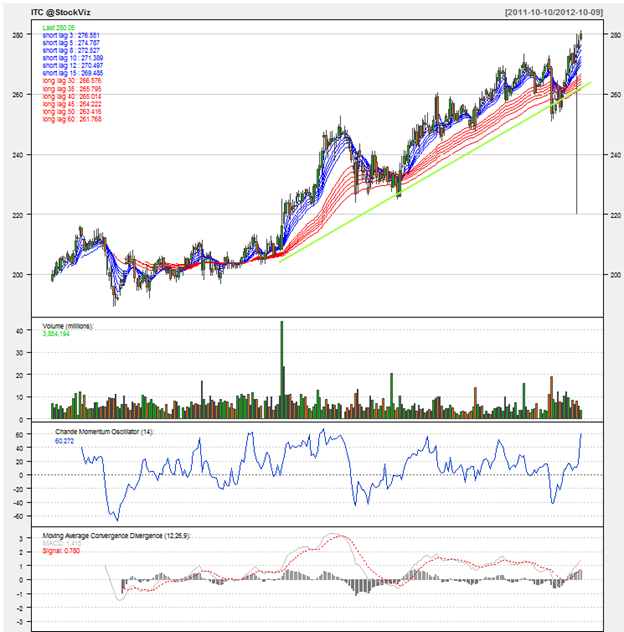
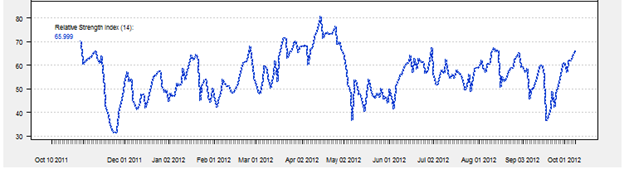
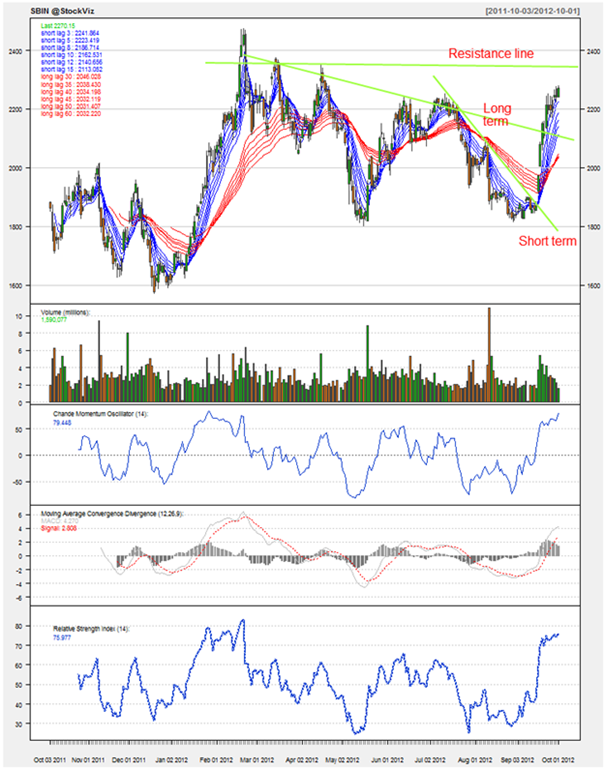
Oscillators like RSI and CMO are at currently at the levels of 66 and 60. At this high level, there surely can be a correction in the short term. Although looking at the previous highs of RSI, the stock can see an up move till RSI reaches 80. MACD line and signal line are drifting apart from each other and histogram levels are on a rise. Not suggesting any corrections.

Looking at GMMA for a medium to long term outlook is not giving a lot of indication. The long term lines are moving away from each other (signaling a continuation of the previous trend). The increasing separation in the short term lines also suggests a positive outlook for the near term. The stock seems to be on a roll. It is a long term green flag for this stock.

image

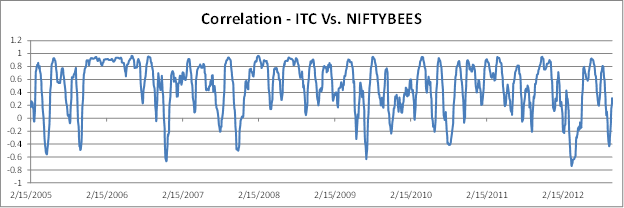
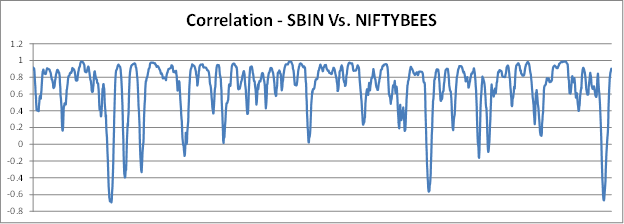
ITC’s average correlation of 0.49 with the [stockquote]NIFTYBEES[/stockquote] suggests that the correlation is strong and positive, Although the movements will not be of the same magnitude as Niftybees.

image

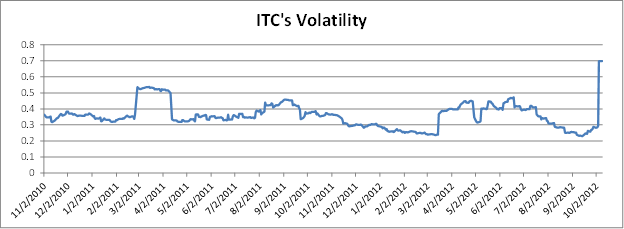
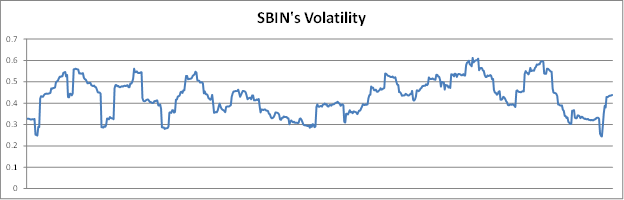
ITC has volatility in the range of 0.4 to 0.6 for the most part (except for the high regions during 2010) which is not a very big range. The volatility is currently at 0.70, higher compared to the recent past. A constant eye is required on the scrip in case it makes a sudden move.

The up-trend is quite prominent. For a short term until the RSI levels start to decrease it is suggested to hold the scrip. And for the long term we do not have any standard to measure if it has any resistance at any levels. This stock can just be another example to prove the proverb “the trend is your friend” true.

Enhanced by Zemanta

Analysis: SBIN

image

This week’s pick is [stockquote]SBIN[/stockquote]. Trading somewhere close to its 52 week high of 2475, the return over the last 12 month period is about 21%. In the last few months, the scrip has tested the 1800 levels a few times, but a strong support is visible because of the pullbacks with higher volumes.

Oscillators like RSI and CMO are at currently at the levels of 76 and 79. At this high level, there surely can be a correction for a short while. MACD line and signal line are distant apart from each other and you can also pinpoint the decrease in the histogram levels. The histograms can be an early warning sign of a correction again.

Looking at GMMA for a medium to long term outlook is not giving a lot of indication. The long term lines are holding up very close to each other (signaling an upcoming change in the previous trend). Although the increasing separation in the short term lines does suggests a positive outlook for the near term. To wait and see how the long term lines wind out is what can be done best for the outlook.

image

SBIN’s average correlation of 0.7 with the [stockquote]NIFTYBEES[/stockquote] suggests that the correlation is strong and positive, Although the movements will not be of the same magnitude as NIFTYBEES.

image

SBIN has a volatility in the range of 0.3 to 0.6, which is not a very big range. And hence a close above and below this volatility range can act as a good selling or buying signal.

Looking at the trend-line we can say that it is on an uptrend. Also, the stock has tested 2380 levels thrice during the last 4 quarters, which has acted as a strong resistance for the up-move. With the current up-trend (both long term and short term) the scrip can move up to the same level and test it again. For a short term until the RSI and CMO levels decrease it is suggested to keep out / Sell the scrip. And for the long term we might want to look at the long term lines of GMMA and also the resistance levels at 2380 to take a stand.

Enhanced by Zemanta

Analysis: ACC

image

This week’s pick is [stockquote]ACC[/stockquote] limited. Trading somewhere close to it’s 52 week high, the return over the last 9 month period is about 16%. Recently, the stock saw a close below the level of 1300, but picked up quite strongly the next day, signaling a support at those levels.

Currently oscillators like RSI and CMO are at 59 and 39, which is in the mid zone for this particular scrip. It has still got some time to reach the overbought/oversold signals and hence they don’t suggest much. MACD line and signal line are moving very close to each other and hence again are not giving any signal currently.

Looking at GMMA for a medium to long term outlook proves to be quite positive. The long term lines are holding quite distinctly and are separated from each other (signaling a continuing long term trend). Also the increasing separation in the short term lines backs up the positive outlook given by the long term lines for the near term. It would be suggested to hold your breath and be long the stock until you come across the squeezing long term lines following the overlaps in the short term lines.

Looking at the trend-line we can say that it is in the right place. Also, the stock has tested 1400 levels quite many times during the last 3 quarters. It can act as a strong resistance for the up-move, but a breakout above this level might prove to be a real deal for the portfolios. So this stock currently is a hold from our side and can continue the current uptrend if it closes successfully above 1400 levels.

Time to Deboard KFA

We caught a glimpse of the falling knife and also identified the good times during the last 3 weeks time. In this period [stockquote]KFA[/stockquote] has seen a low of Rs. 9.10 to the recent intraday high of Rs. 14.15 with a close of Rs. 13.45 awarding a whopping 48% return. 

image

Well in the past 3 – 4 trading days , the stock has seen many drops. It has also developed a short term resistance around Rs. 13.9. The technicals like CMO, MACD and RSI are identifying a reversal of the past weeks trend.

You can wait for a break-out of the resistance level, or can use this opportunity to book your profits and alight the flight of KFA while it is still flying.

Options Strategies – Making you “Oprah rich”

The options strategy trades that we put on earlier this month have been total rock stars! Initially surfaced by Stockviz algos, the portfolio is now rolling deep in the green.  

image

image

These option strategies have produced a whopping 350% returns of 58K with the initial investment of 16K.

Our Pro subscribers made out like gangsters. You are welcome!

Login to StockViz by clicking on image and Go Algo!