Author: Abhishek

Oil vs. Sensex

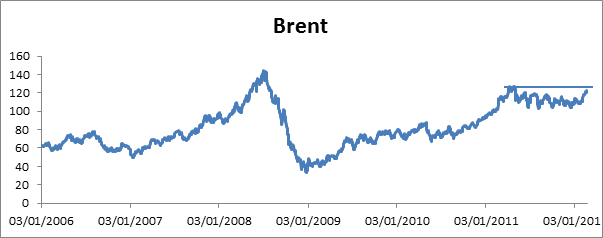
Oil is a very important natural resource, and one deciding outcome for a lot of economic activity as well. In case of US, rising crude has always preceded the next stock market slowdown. It happened recently in 2008, when oil touched its all time high nearing $150/barrel. Oil just tested the high marks of 2011 highs of $124. We will have to be concerned if it breaks the resistance. We might be up against a sudden rise of Brent and in turn a fall in the markets.

image

Well, India imports most of oil from Iran. Iran’s 9% of the export comes to India, and according to US, India needs to stop depending on Iran for the oil needs.

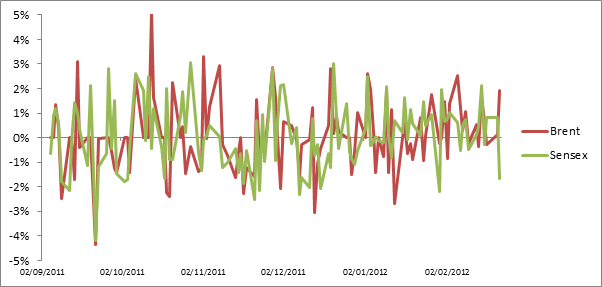
Coming onto the impact that we see on Indian market, it is no different. An increasing crude price was accompanied by falling stock market, a four day falling streak in the near past. Although as crude started falling, we did see buying happening in the markets, which pulled up the stocks back.

image

While tensions in Iran are escalating, there is no looking behind for the oil to fall to the 110$ levels any soon (Average price for the oil during the Sep – Dec period). Looking at how the oil producing and marketing companies are performing in contrast to the Brent.

image

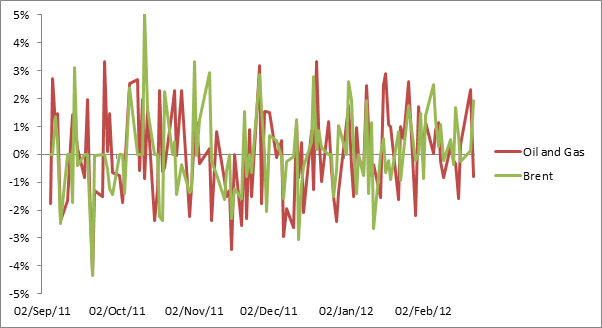
We, see here that the oil and gas index has a bit of a preceding nature of the prices when compared to the Brent. A fall in Brent is preceded by the oil and gas index (Can be because of the delayed opening of the commodity markets in the west).

To make trades in the market, we will have to wait and watch where the oil goes from here. As far as I am concern, would be shorting till the oil is rising but would buy if it stagnates around $115 as well for the next couple of weeks.

China to overtake India in one more thing

National emblem of the People's Republic of China

Image via Wikipedia

Warren Buffet may not like gold that much, but apparently Indians and Chinese haven’t received his latest newsletter. And not only that, China is set to overtake India as the world’s largest consumer of gold. Chinese demand has more than tripled from 2010.

Given that both growth and inflation remain high in China, it appears that gold is being seen as a hedge against inflation. Also, Beijing has encouraged gold consumption, announcing in 2010 measures to promote and regulate the local gold market, including expanding the number of banks allowed to import bullion.

After completely dominating the copper market (China accounts for 40% of global copper demand), it appears that China is about to wade into the bullion shop.

Investors looking to get exposure to gold via ETFs can look towards GOLDBEES or KOTAKGOLD.

Source: FT

Top 5 Investing Mistakes

1903 stock certificate of the Baltimore and Oh...

Image via Wikipedia

I missed the rally in TATAMOTORS today. When a stock that you don’t own takes off (+11% since yesterday), you are filled with blinding rage. I made the #1 mistake of letting my individual preference interfere with my investment decision. I never liked Tata cars – I feel that they fall apart in a year and their interiors are sub-par. But turns out I missed the wood for the trees. So I sat down and wrote up a list of 5 mistakes that investors should avoid:

  1. Getting confused between the company’s product and its stock. Very often, you may love the product the company makes. You may love the XUV 500, but that’s not a good reason in itself to own M&M. You may hate Airtel’s service, but that’s not a good reason in itself not to own BHARTIARTL.
  2. Getting caught up in a fad without thinking through the economics. The market goes through periods where everybody is talking up one sector. I have seen infatuation with infrastructure stocks, real estate, FMCG, oil & gas all come and go. The only thing that is guaranteed with infatuation is a nasty hangover. Don’t only focus on the sector du jour. Focus on revenue growth, profitability and valuation of companies across sectors.
  3. Hanging on to your losers. We all make mistakes. But hoping for a miracle that will somehow turn a position that is down 10% is stupidity. You should have a stop-loss, or better yet, a trailing stop. Let the losers go.
  4. Letting go of your winners. This is the corollary to #3. Why sell a stock that’s on a hot streak. Own it till the rally exhausts itself. If you have a trailing stop setup, the exit automatically takes care of itself.
  5. Getting confused between trading and investing. My sincerest advice is to leave intra-day trading to computers. High Frequency Trading (HFT) has pretty much taken over most exchanges in the world, driving down holding periods to seconds (on an average, the holding period of a stock in the US is around 22 seconds.) You cannot compete with the machines. Your “short term” should at least be a month. This allows you to do your homework and focus on the total return of your portfolio.

And for those who owned TATAMOTORS before the results, good job!

Questions? Email me: abhi@stockviz.biz

Risk Adjusted Returns

Mutual fund

Image via Wikipedia

In my intro to calculating returns I had touched upon how to compare returns on different investments, you need to first adjust it for risk. There are three such measures that I consider important: alpha, beta and the Sharpe Ratio.

Alpha measures the ability of an investor to beat the market, thereby generating returns in excess of what might be possible by taking the same amount of risk. Essentially, an investment manager should not only avoid losing money for the client and should make a certain amount of money, but in fact should make more money than the passive strategy of investing in everything equally. Basically, you are paying your mutual fund for the alpha, compared to just buying the Nifty50 ETF.

Beta is similar to correlation (see: The Reliance on Correlation.) An asset has a Beta of zero if its returns change independently of changes in the market’s returns. A positive beta means that the asset’s returns generally follow the market’s returns. By definition, the market itself has a beta of 1.0. A stock whose returns vary more than the market’s returns has a beta whose absolute value is greater than 1. A stock whose returns vary less than the market’s returns has a beta with an absolute value less than 1.

And finally, the Sharpe ratio. The Sharpe ratio tells us whether a portfolio’s returns are due to smart investment decisions or a result of excess risk. This measurement is very useful because although one portfolio or fund can reap higher returns than its peers, it is only a good investment if those higher returns do not come with too much additional risk. The greater a portfolio’s Sharpe ratio, the better its risk-adjusted performance has been. A negative Sharpe ratio indicates that a risk-less asset would perform better than the security being analyzed.

Read More:
Sharpe: http://www.investopedia.com/terms/s/sharperatio.asp#ixzz1lmQd5BEB
Beta: http://en.wikipedia.org/wiki/Beta_(finance)
Alpha: http://en.wikipedia.org/wiki/Alpha_(investment)

Questions? Email me: abhi@stockviz.biz

Real vs. Nominal Returns

The One Rupee Banknote.

Image via Wikipedia

In my previous post about calculating returns, I briefly touched upon the notion of “risk adjusting” any projected returns to see if it makes sense compared to different investment options available. Today I’m going to discuss the biggest unavoidable risk of all: inflation.

Inflation is the erosion of value of money over time. i.e., as time progresses, the same Rupee buys less goods or services. We have all seen its effects first hand – I can’t think of single thing that has become cheaper over the years in India. So how does inflation affect investment decisions?

If you just took all your money and kept it in a vault, over a period of a year, you’ll get only 90% of it back. Where did the 10% go? Inflation took it (assuming a 10% annual inflation rate). Now imagine what happens if you socked away your money in a vault over a period of 10 years? How much will you get back then?

The rate of inflation plays a crucial role in calculating returns on investments. So important, in fact, that the way we calculated returns yesterday is called “nominal returns”. When you adjust nominal returns for inflation over the same period of time, you get “real returns.”

There are various measures of inflation depending on who it affects, but the most popular of them is the CPI – the Consumer Price Index. A good rule of thumb is to subtract nominal returns with the CPI to see how much you really end up making.

Different investments react differently to changes in inflation. For example, real assets, like real estate are supposed to be immune to inflation since their value is expected to rise along with it. Bonds perform poorly in an inflationary scenario because you get a fixed return. Stocks fall somewhere in between.

So its almost always a poor investment to keep cash in a vault. At the very least, your returns should at least match the rate of inflation.