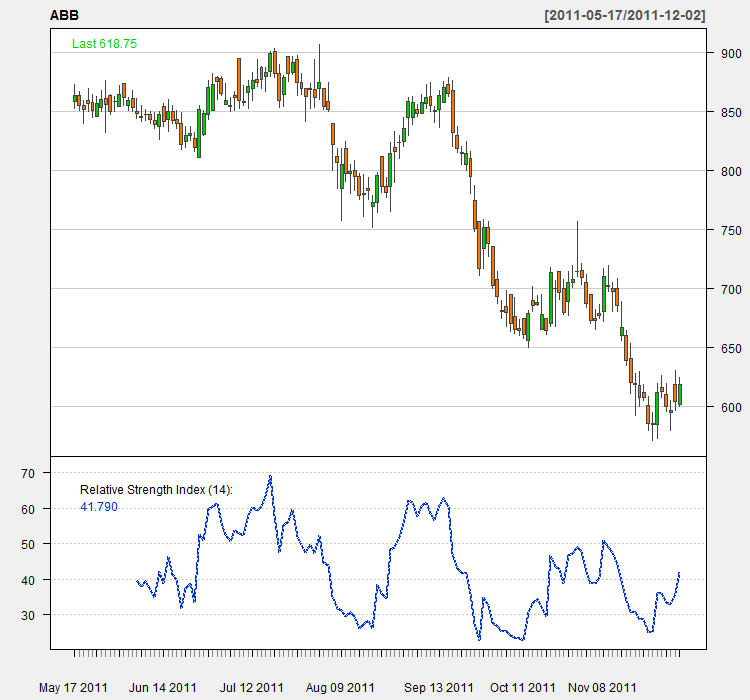
Relative Strength Index
The Relative Strength Index (RSI) is a momentum oscillator that measures the speed and change of price movements. It oscillates between zero and 100.
It can be used to identify:
- overbought (>70) and oversold (<30) conditions,
- divergences: A bullish divergence occurs when the underlying security makes a lower low and RSI forms a higher low. RSI does not confirm the lower low and this shows strengthening momentum. A bearish divergence forms when the security records a higher high and RSI forms a lower high. RSI does not confirm the new high and this shows weakening momentum.
- failure swings: A bullish failure swing forms when RSI moves below 30 (oversold), bounces above 30, pulls back, holds above 30 and then breaks its prior high.A bearish failure swing forms when RSI moves above 70, pulls back, bounces, fails to exceed 70 and then breaks its prior low. It is basically a move to overbought levels and then a lower high below overbought levels.
