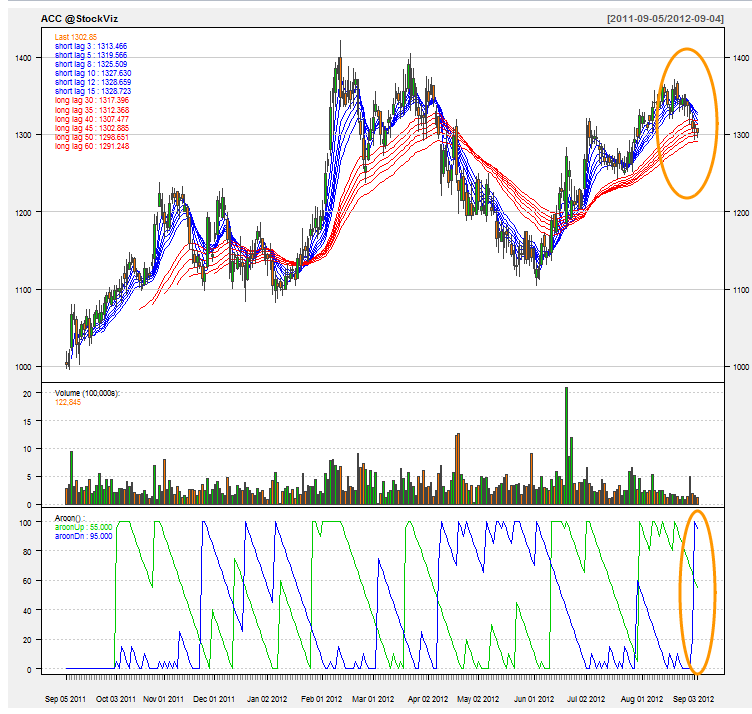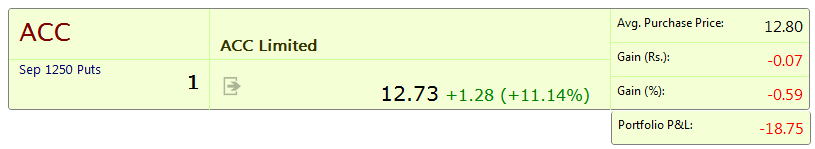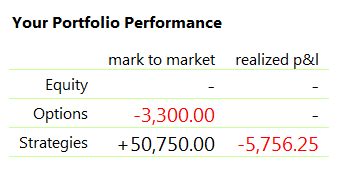
Not bad for a few days for work! Intuition + Algorithms = Profit
Invest Without Emotions
Not bad for a few days for work! Intuition + Algorithms = Profit
Now that the earnings season is over and Europe is on vacation, volatility in the NIFTY has dropped off. Here’s a historical chart to put things in perspective:

With the August expirations right around the corner, you should be looking at putting on Sep 5300/5400 Long Strangle on the NIFTY or if you are feeling brave, buy the Sep 5000 NIFTY Puts outright.

With the Strangle, you’ll have some protection against melt-ups. If you look at the pay-off at expiry, you are protected if Europe gets its act together or if the domestic situation improves. With break-evens at 5,118 on the downside and 5,581 on the up, a move outside of any one of these goalposts will make you money.
Whatever your strategy is, volatility seems too low at this point. So make sure you put some “reversion to the mean” trade on.

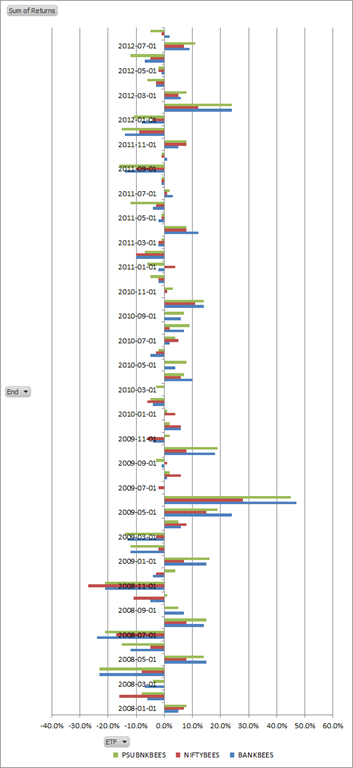
PSU banks [stockquote]PSUBNKBEES[/stockquote] have under-performed the market this year, up just 7% vs. the sector’s [stockquote]BANKBEES[/stockquote] 22% and the market’s [stockquote]NIFTYBEES[/stockquote] 9%. 2011 was not kind to the dinosaurs either, -42% vs. the Nifty’s not so great -16%.
In fact, the only time the PSUs outperformed by a meaningful measure was during the panic of 2008, where they tanked less than the rest of the market.
The gloom and doom scenario includes rising NPAs, pension provisions and rising costs leading to more capital raises. Besides, given the experience of minority shareholders in the government owned Coal India [stockquote]COALINDIA[/stockquote], FIIs have been fleeing from public sector companies in general.
PSU banks are overexposed to bankrupt state electricity boards, with no glimmer of hope in the horizon. And given the weak monsoon, the direct exposure these banks have to the agriculture sector might land a double whammy in 2012.
But given the 35% drop since 2011, this sector is worth a second look. The Finance Minister is making the right noises regarding the deficit. The monsoon may not turn out to be all that bad after all. NPAs are getting worked through and it looks like banks will be exiting 2012 with a decent balance sheet. Besides, the yield curve is positive, so the banks don’t have to try too hard to make money. The 2012 budget has sanctioned Rs. 15,888 crore to be provided for capitalization of public sector banks and financial institutions to get them Basel III compliant, so the capital situation is not that bad.

Currently the PSU Bank ETF looks like its resting on a weak support at Rs. 300 and the near-term upside seems limited. However, if it heads towards Rs. 250, be prepared to pull the trigger.
PSU banks should on every investors radar. Remember Warren Buffett: “Buy what everybody hates”

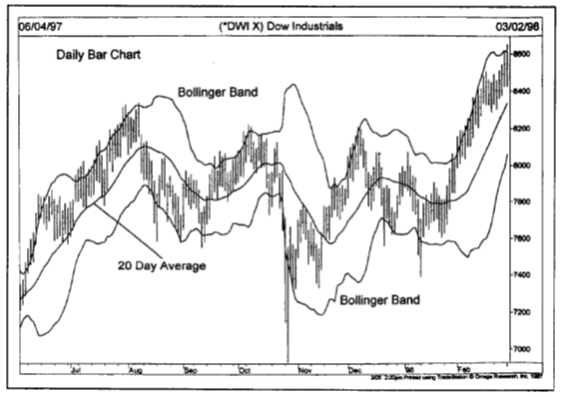
Bollinger Bands is one of the most widely used volatility indicators. The band is developed by John Bollinger and as the name suggests these are bands (ranges) above and below the price movements. The bands widen when the volatility increases and narrow when volatility decreases. They can be used to identify M tops and W bottoms or to determine the strength of the underlying trend.
The band uses 20 day SMA’s for the calculation of the middle band and for the upper and lower band, SMA plus or minus 2 standard deviations of the past 20 days prices. A simple moving average is used because the standard deviation formula also uses a simple moving average. 95% of the price data should fall between the two bands. The prices are considered to be overextended on the upside (overbought) when they touch the upper band. They are considered to be overextended on the downside (oversold) when they touch the lower band.
Arthur Merrill developed 16 patterns with a basic W shape. A W bottom forms in a downward and involves two reaction lows. In particular you should look for W bottoms where the second low is lower than the first, but holds above the lower band. There are a four steps to confirm a W bottom with Bollinger bands.
According to Bollinger, tops are usually more complicated and drawn out than bottoms. M top is very similar to a double top, though the highs might not always be equal. The second high can be lower or higher than the first high, but Bollinger suggests looking for a sign of non-confirmation when a security is making new highs. A non confirmation occurs with three steps:
The inability of 2nd set of price to reach the upper band shows waning movement, which can foreshadow a trend reversal. Final confirmation comes with a support break or bearish indicator signal.
Moves above or below are not signals per se, but rather act as tags. A move to the upper band shows strength while a move towards the lower band shows weakness. According to the momentum oscillators overbought and oversold signals do not necessarily provide a bullish or bearish signal. Hence the prices can actually walk the band with numerous touches during a strong uptrend and not face the trend reversals.
During this period, prices won’t close above upper band if in a downtrend or won’t close below the lower band if in an uptrend. Such a pattern of the prices staying within the bands (in sync with the underlying trend is called walking the trend.
Let us now look at an example of the above 3 signals and understand how it looks like when it is happening.

In the above chart you can see how we have the W bottoms and the M tops at work. With the top you can see the pullback move (the 3rd spike) and how it was unable to cross the last high and also the upper band.
In the above chart you can see how in the walking the bands for the underlying uptrend the prices are not able to close past the lower band, and hence they keep under the band all this time. 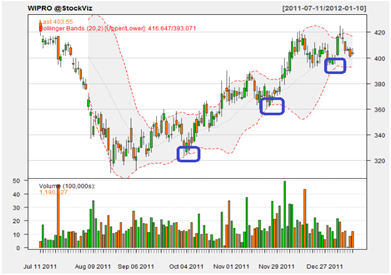
In your trades, Bollinger bands can be of great help in understanding the price moves. According to Bollinger, the prices for 89 – 90% of the time should be within the bands, the rest can act as your cue for next move.
Utilize them to see how volatile the last 20 days have been to make an informed judgment about your scrip.
Bollinger Bands can be used to decide on option trades as well. Narrowing Bollingers indicate that volatility is falling. If the bands have narrowed significantly over their 2-3 month average, it could be time to buy volatility on that stock. Compression of Bollinger Bands is usually signal of a coming volatility surge.