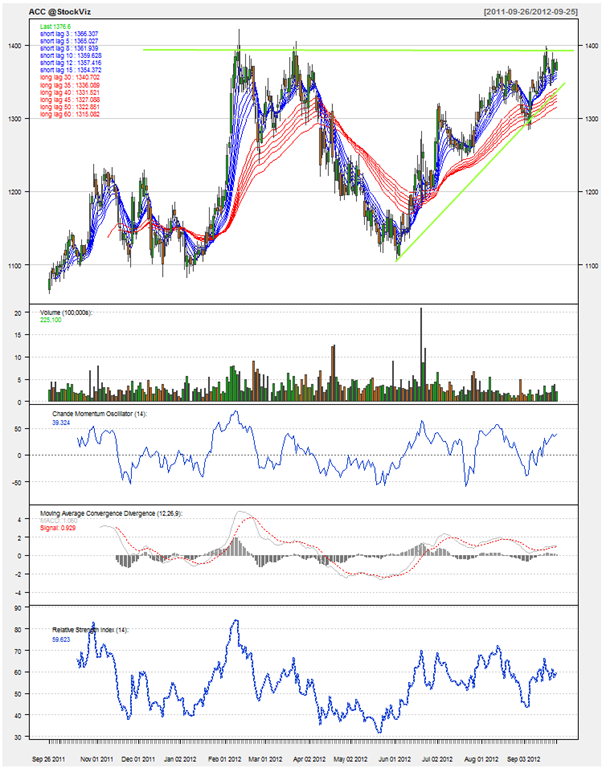
This week’s pick is [stockquote]ACC[/stockquote] limited. Trading somewhere close to it’s 52 week high, the return over the last 9 month period is about 16%. Recently, the stock saw a close below the level of 1300, but picked up quite strongly the next day, signaling a support at those levels.
Currently oscillators like RSI and CMO are at 59 and 39, which is in the mid zone for this particular scrip. It has still got some time to reach the overbought/oversold signals and hence they don’t suggest much. MACD line and signal line are moving very close to each other and hence again are not giving any signal currently.
Looking at GMMA for a medium to long term outlook proves to be quite positive. The long term lines are holding quite distinctly and are separated from each other (signaling a continuing long term trend). Also the increasing separation in the short term lines backs up the positive outlook given by the long term lines for the near term. It would be suggested to hold your breath and be long the stock until you come across the squeezing long term lines following the overlaps in the short term lines.
Looking at the trend-line we can say that it is in the right place. Also, the stock has tested 1400 levels quite many times during the last 3 quarters. It can act as a strong resistance for the up-move, but a breakout above this level might prove to be a real deal for the portfolios. So this stock currently is a hold from our side and can continue the current uptrend if it closes successfully above 1400 levels.
Comments are closed, but trackbacks and pingbacks are open.