Author: Abhishek

Weekly Recap

NIFTY.2012-11-5.2012-11-9

The NIFTY ended tepid, moving just -0.43% for the week.
Biggest losers were IDFC (-5.70%), TATAPOWER (-5.07%) and HINDALCO (-3.74%).
And the biggest winners were ASIANPAINT (+5.41%), CIPLA (+4.35%) and TATAMOTORS (+3.91%).
Decliners eclipsed advancers 26 vs 24

fii.2012-11-5.2012-11-9Gold: +3.01%, Banks: +0.31%. Infrastructure: -0.05%,
Net FII flows for the week: $402.02 mm (Equity) and $234.39 mm (Debt)
Net domestic institutional flows for the week: $447.50 mm (Equity) and $1,991.40 mm (Debt)
Daily news summaries are here.

Analysis: PANTALOONR

Today’s pick is [stockquote]PANTALOONR[/stockquote]. The stock is currently trading around the same price where it was year ago – range bound between 130 to 220 levels for almost a year. However, it recently zipped past its resistance at 200 on higher volumes. In the last three month period, the stock is up 30% vs. 7% for Nifty.

image

Oscillators RSI and CMO are currently at 62 and 18 and are closing towards over-bought territory.

MACD line has just crossed the signal line from below signaling a bullish movement for the coming days.

Long term set of GMMA lines are fanning out – which is a bullish for the long term. Due to the recent down-trend in the stock prices the short-term lines are constricted and are not signaling any movement.

In addition to these technicals, the stock seems to have some momentum behind it with 4 cross 9 and 9 cross 18 EMA bullish crossovers seen in the past week.

image

PANTALOONR’s average correlation of 0.60 with the Nifty is positive and strong. The stock will replicate the movements of Nifty closely. [stockquote]NIFTYBEES[/stockquote]

image

PANTALOONR had a historical volatility in the range of 0.6 to 1.6. Currently the stock’s volatility is towards the lower side of the range.

Looking at these technicals a short-term buy is suggested. For the long-term, the GMMA lines are giving a bullish signal for the stock and a break-out above the 220 levels will confirm the signal.

Enhanced by Zemanta

Analysis: LT

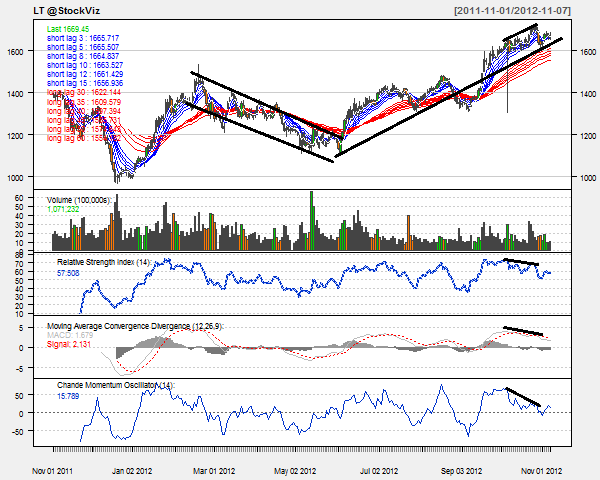
Today’s pick is [stockquote]LT[/stockquote]. The up-trend in place since December last year was punctuated by a correction in March through May. The stock has since resumed its upward trajectory to reach a 52 week high of 1700 recently. In the last three month period, the stock is up 18% vs. 8% for Nifty.

image

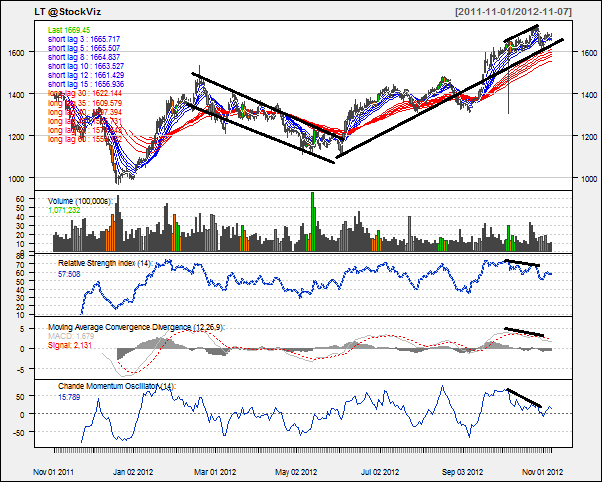
Oscillators RSI and CMO are currently at 57 and 16 and in no man’s land.

MACD line and the signal line are moving very close to each other with the histogram levels steady. They are not signaling any directional movement.

Long term set of GMMA lines are fanning out – which is a bullish for the long term. Due to the recent down-trend in the stock prices the short-term lines are constricting, giving a bearish signal for the short-term.

Added to all the current technical levels, we can see a divergence in RSI, CMO and MACD levels. The higher highs in the prices are accompanied with the lower highs of the technicals which is a near-term bearish sign for the stock.

image

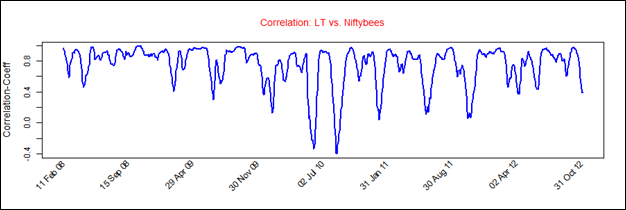
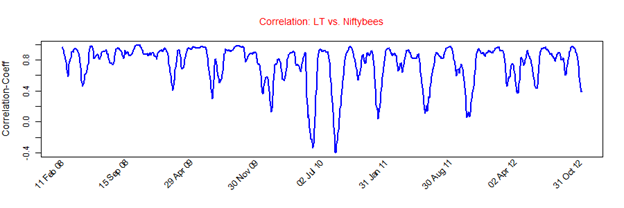
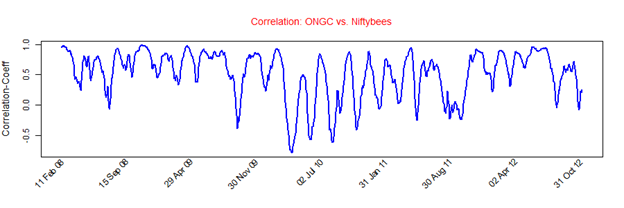
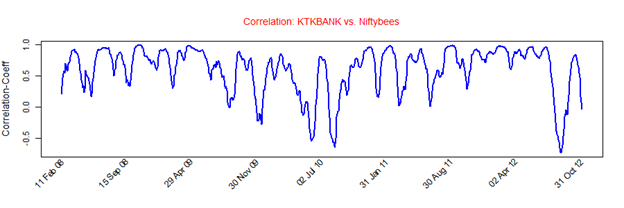
LT’s average correlation of 0.75 with the Nifty is positive and quite strong. The stock will replicate the movements of Nifty closely. [stockquote]NIFTYBEES[/stockquote]

image

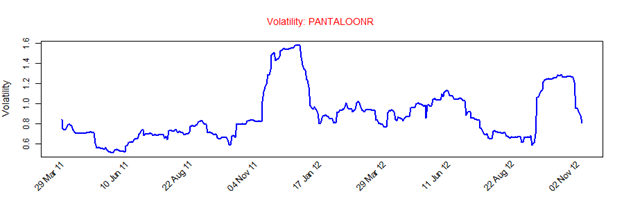
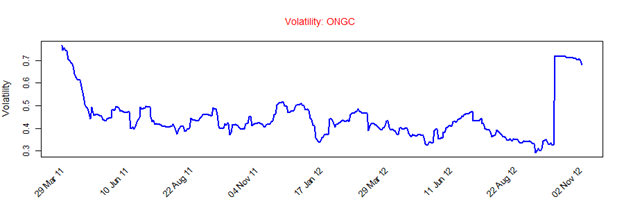
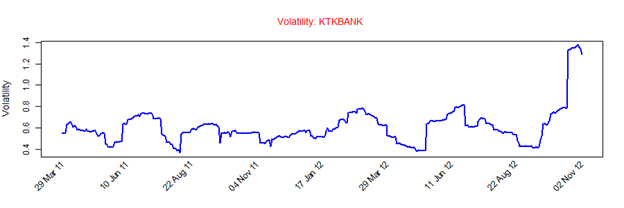
LT had a historical volatility in the range of 0.3 to 0.8. Current volatility of the stock should not be sign of panic for the traders.

In a couple of insider trading instances between 25th through 29th Oct, right around when the stock was making its 52 week highs, the Chairman, Mr. Naik, sold a total of Rs. 10.1 Cr worth of shares.

Looking at these technicals a short-term hold is suggested. Although for the long-term, the GMMA lines are giving a bullish signal for the stock.

Enhanced by Zemanta

Analysis: ONGC

Today’s pick is [stockquote]ONGC[/stockquote]. The last year saw the stock trading in a 225 to 300 range and the stock was range-bound for the longest time since July. However, it broke-down the range a week ago. During the last three month period, the stock was -5% vs. the +8% of the Nifty.

image

Oscillators RSI and CMO are currently at 36 and -56 and are close to the over-sold territory.

MACD line and the signal line are at distant but the histogram levels are steady – this can be the early sign of a short-term up-trend.

The GMMA chart is not giving any signal as both long-term and short-term lines are tightly packed.

image

ONGC’s average correlation of 0.51 with the Nifty is positive. The stock will not replicate the movements of Nifty closely. [stockquote]NIFTYBEES[/stockquote]

image

ONGC had a historical volatility in the range of 0.3 to 0.7. Current high volatility can be attributed to the Emkay disaster.

The decline in the price can also be attributed to the withdrawal of the much awaited FPO issue for the stock. With the stock trading at a 12% discount to where LIC bailed it out in March, it looks like its not so nirmal anand after all.

Looking at these technicals a short-term buy is suggested if the stock picks up from the 260 support levels. Although for the long-term, a decisive breakout from the current trading range will suggest a direction.

Enhanced by Zemanta

Analysis: KTKBANK

Today’s pick is [stockquote]KTKBANK[/stockquote]. The last year saw the stock trading in a 60 to 140 range and the stock is in an up-trend since its Jan lows; The stock just saw 52-week highs at 140 levels. In the last three month period, the stock is up 42% vs. the Nifty’s 8%. 

image

Oscillators RSI and CMO are currently at 69 and 36 and are close to the over-bought territory.

MACD line and the signal line are moving very close to each other and the histogram levels are steady – signaling a short-term consolidation in progress.

The GMMA chart shows both long-term and short-term lines fanning out. This is an extremely bullish signal for the stock.

image

KTKBANK’s average correlation of 0.6 with the Nifty is positive and strong. The stock will replicate the movements of Nifty closely. [stockquote]NIFTYBEES[/stockquote]

image

KTKBANK had a historical volatility in the range of 0.4 to 0.8 till Sep 12, after which we see a rise in the volatility. This high volatility asks for a cautious outlook for the stock.

Looking at these technicals a short-term hold is suggested. Although, the spreading GMMA lines are giving a strong long-term buy signal for the stock.

Enhanced by Zemanta