Author: Abhishek

Analysis: ICICIBANK (IBN)

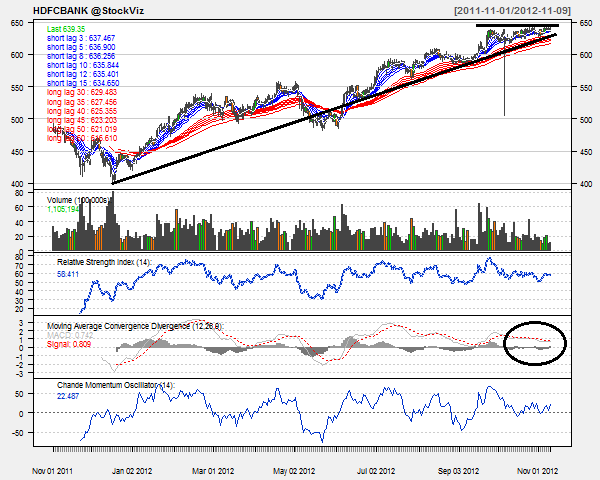
Today’s pick is [stockquote]ICICIBANK[/stockquote]. The stock has been in an up-trend since lows of last December. However, the last one and a half month has seen a range bound movement for the stock. In the last three month period, the stock was up 6% Vs. Nifty’s 4%.

image

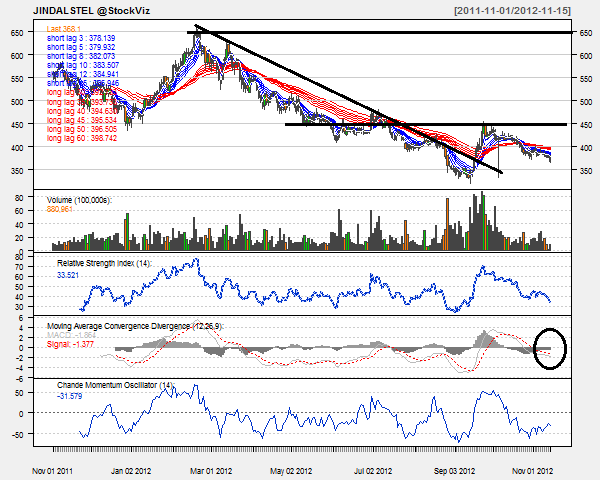
Oscillators RSI and CMO are at currently at 40 and -33 are hovering around the over-sold territory but are not suggesting any direction.

MACD line and the signal line are moving away from each other and are not suggesting any trend. The 18X9 cross-over is currently bearish.

Every technical chart currently is showing a divergence with the price chart. This is not a very good sign for the near-term.

The GMMA long-term lines were running parallel to each other but are closing in because of the range-bound movement in the recent past. This is a bearish sign for the stock.

image

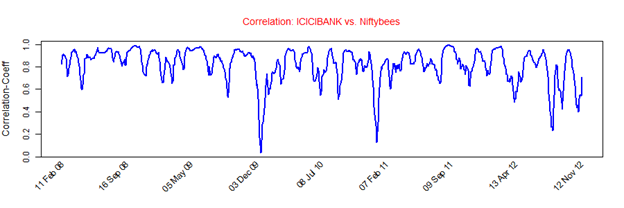
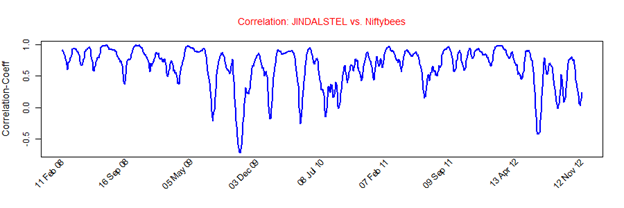
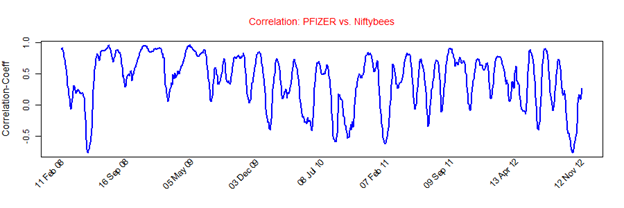
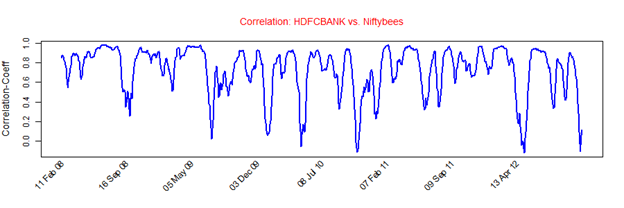
ICICIBANK’s average correlation of 0.82 with the Nifty is positive and quite strong. The stock will replicate the movements of Nifty closely because of the high co-efficient. [stockquote]NIFTYBEES[/stockquote]

image

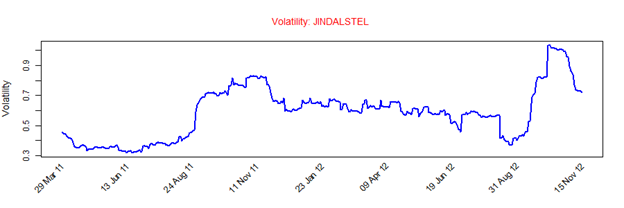
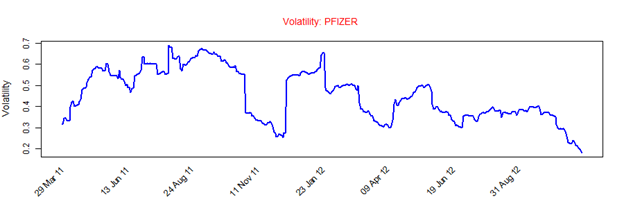
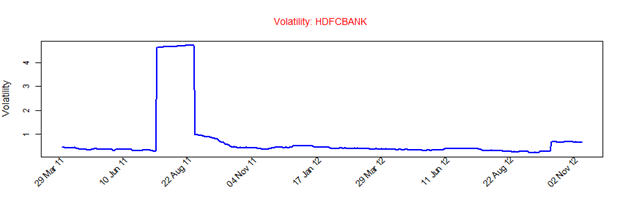
ICICIBANK has a historical volatility in the range of 0.3 to 0.8. The scrip’s volatility is currently towards the higher side of the range.

Analysts have mixed expectations regarding this stock. Next set of earnings can help bring a different picture on the charts.

Looking at these technicals, keep off this scrip for the short-term. A break-out of the flag in either direction will trigger a longer-term call.

Enhanced by Zemanta

Weekly Recap

NIFTY.2012-11-12.2012-11-16

The NIFTY ended on a bearish note, melting down -1.84% for the week.
Biggest losers were TATAMOTORS (-5.56%), GRASIM (-5.42%) and ULTRACEMCO (-5.36%).
And the biggest winners were BHARTIARTL (+9.28%), COALINDIA (+1.31%) and AXISBANK (+0.92%).
Decliners eclipsed advancers 42 vs 8

fii.2012-11-12.2012-11-16
Gold: -1.18%, Banks: -1.65%. Infrastructure: +0.34%,
Net FII flows for the week: $48.79 mm (Equity) and $302.83 mm (Debt)

Daily news summaries are here.

Analysis: JINDALSTEL

Today’s pick is [stockquote]JINDALSTEL[/stockquote]. The stock has been in a down-trend for the most part since Feb this year. However, there was a slight up-move in Sep, but it gave up by start of Oct. Since then the stock has been in a down-trend again. In the last three month period, the stock moved -11% Vs +5% as that of Nifty’s.

image

Oscillators RSI and CMO are at currently at 33 and –31, and are hovering around the over-sold territory but are not suggesting any direction.

MACD line and the signal line are moving very close to each other and the Histogram is showing a decreasing levels. This can be an early indicator of an upcoming up-trend.

The GMMA chart is not suggesting any direction for either the short-term or the long-term as well.

image

JINDALSTEL’s average correlation of 0.65 with the Nifty is positive and strong. The stock will replicate the movements of Nifty closely because of the co-efficient. [stockquote]NIFTYBEES[/stockquote]

image

JINDALSTEL has a historical volatility in the range of 0.3 to 1.0. The scrip’s volatility is currently in the middle of the range and hence is not a concern.

Looking at these technicals a short-term buy is suggested upon a decisive MACD cross-over. A break-out of the near term resistance at 450 will trigger a longer-term up-trend.

Enhanced by Zemanta

Analysis: PFIZER

Today’s pick is [stockquote]PFIZER[/stockquote]. The stock has been range-bound between the 1100 to 1350 levels since last December. The stock is currently trading close to its 52 weeks low of 1100. In the last three month period, the stock moved -10% Vs + 5% as that of Nifty’s.

image

Oscillators RSI and CMO are at currently at 37 and -27 are hovering around the over-sold territory but are not suggesting any direction.

MACD line and the signal line are moving very close to each other since a long time and are not suggesting any trend.

The GMMA chart is not suggesting any up-move in the long term as well.

image

PFIZER’s average correlation of 0.40 with the Nifty is positive. The stock will not replicate the movements of Nifty closely because of the low co-efficient. [stockquote]NIFTYBEES[/stockquote]

image

PFIZER has a historical volatility in the range of 0.2 to 0.7. The scrip’s volatility is currently at the lowest point of the range and hence should not be a concern.

Looking at these technicals a short-term buy is suggested upon a decisive MACD cross-over. A break-out of the range in either direction will trigger a longer-term call.

Enhanced by Zemanta

Analysis: HDFCBANK (HDB)

Today’s pick is [stockquote]HDFCBANK[/stockquote]. The stock has been in an up-trend since lows of last December. However, the last one and a half month has seen a range bound movement for the stock. In the last three month period, the stock was up 7% same as that of Nifty’s return. The stock is currently trading around its 52-week high at 645 levels.

image

Oscillators RSI and CMO are at currently at 58 and 22 are hovering around the over-bought territory but are not suggesting any direction.

MACD line and the signal line are moving very close to each other since a long time and are not suggesting any trend. The short-term technicals are looking pretty good: both the 4×9 Cross-Over and 4×18 Cross-Over are bullish.

The GMMA chart shows that long-term lines are parallel to each other which is a bullish sign for the stock. The short-term lines are entangled because of the last months range bound movement.

image

HDFCBANK’s average correlation of 0.73 with the Nifty is positive and quite strong. The stock will replicate the movements of Nifty closely because of the high co-efficient. [stockquote]NIFTYBEES[/stockquote]

image

HDFCBANK has a historical volatility in the range of 0.4 to 4 which is a very big range. The scrip’s volatility is currently in the lower side of the range and hence should not be a concern.

Analysts have mixed expectations regarding this stock. Next set of earnings can help bring a different picture on the charts. Also, the magnitude of buys and sells from insiders crossed each other out.

Looking at these technicals a short-term buy is suggested. A break-out of the pennant in either direction will trigger a longer-term call.

Enhanced by Zemanta