Author: Abhishek

Analysis: INFY

Today’s pick is [stockquote]INFY[/stockquote]. The stock has been in a down-trend since highs of Feb. However, since late August, the stock has seen a pennant formation. In the last three month period, the stock was up 2% Vs. 4% as that of Nifty’s return.

We had issued a short-term buy last month that didn’t quite pan out as we expected – the stock is basically flat since then, stuck in a narrow range.

stock

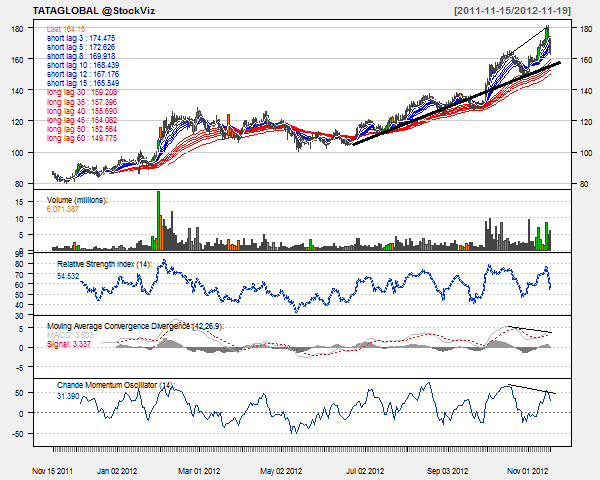
Oscillators RSI and CMO are at currently at 50 and -3 are in no men’s land.

MACD line and the signal line are moving very close to each other and are not suggesting any trend.

The GMMA long-term as well as short-term lines are running very close to each other and are not able to suggest any direction.

cor

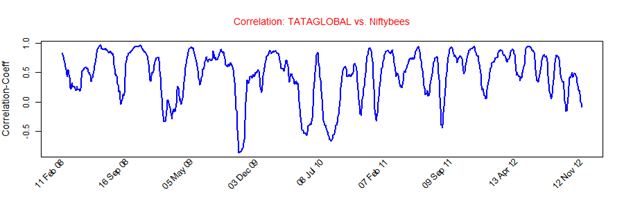
INFY’s average correlation of 0.52 with the Nifty is positive and strong. The stock will replicate the movements of Nifty because of the co-efficient. [stockquote]NIFTYBEES[/stockquote]

vol

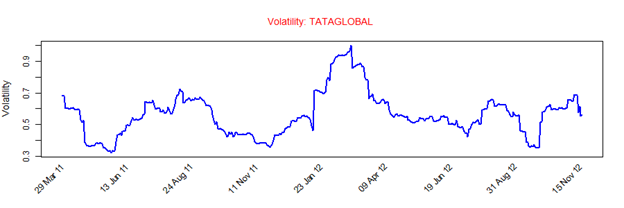
INFY has a historical volatility in the range of 0.2 to 0.7. The scrip’s volatility is currently towards the lower side of the range.

analyst


Analysts have quite a high expectation regarding the stock. A drift in the earnings compared to the analysts expectation might pull the stock down. The stock saw stock selling by an insider worth Rs. 1 Cr. a couple of weeks ago.

Looking at these technicals we suggest that investors keep off this scrip for the short-term. A break-out of the pennant in either direction will trigger a longer-term call.

Enhanced by Zemanta

Analysis: MARUTI

Today’s pick is [stockquote]MARUTI[/stockquote]. The stock has been on an uptrend since Jan this year. It underwent a correction period between may to August, and then continued with the up-ward movement. It is currently trading near the 52-weeks high. In the last three months, the stock moved 28% against 4% as that of Nifty’s.

stock

Oscillators RSI and CMO are at currently at 66 and 17 are close to the over-bought territory. But, looking at the history of the stock, they still have some buffer to reach the over-bought side.  

MACD line and signal line are running very close to each other.

The long-term GMMA lines are fanning out giving out a bullish signal, with a synchronized behavior of the short-term lines. A continued trend like this is extremely bullish for the stock.

The stock just saw a 4X9 bullish cross-over.

cor


MARUTI’s average correlation of 0.48 with the Nifty is positive. The stock will not be able to replicate the movements of Nifty. [stockquote]NIFTYBEES[/stockquote]

vol

MARUTI has a historical volatility in the range of 0.3 to 0.7. The scrip’s volatility is currently in the lower end of the range and hence is not a concern.

Looking at these technicals a short-term buy is suggested. The GMMA lines are also suggesting a longer-term buy which could be confirmed after a decisive testing of the up-trend line in place.


Enhanced by Zemanta

Analysis: IDEA

Today’s pick is [stockquote]IDEA[/stockquote]. The stock has been range-bound between the levels of 75 and 100 for most part of the year. However, since September the stock is moving in an uptrend after testing the support levels. In the last three months, the stock moved 21% against 3% as that of Nifty’s.

stock

Oscillators RSI and CMO are at currently at 64 and 40 are close to the over-bought territory.

MACD line has just crossed signal line from above signaling a bearish move.

The long-term GMMA lines are fanning out giving out a bullish signal, with a synchronized behavior of the short-term lines. A continued trend like this is a bullish sign for the stock.

cor

IDEA’s average correlation of 0.40 with the Nifty is positive. The stock will not be able to replicate the movements of Nifty. [stockquote]NIFTYBEES[/stockquote]

vol

IDEA has a historical volatility in the range of 0.4 to 0.9. The scrip’s volatility is currently in the lower end of the range and hence is not a concern.

Looking at these technicals a short-term sell is suggested. A longer-term buy call could be made after a decisive testing of the up-trend line in place.

Enhanced by Zemanta

Analysis: SIEMENS

Today’s pick is [stockquote]SIEMENS[/stockquote]. The stock was in an up-trend in the starting of this year until mid-April, after which it started declining to find support at the long term 650 levels. However, since June it has been range-bound between the 650 and 750 levels. In the last three months, the stock moved 2% Vs 4% as that of Nifty’s.

stock

Oscillators RSI and CMO are at currently at 38 and -16 are close to the over-sold territory but are not suggesting any direction.

MACD line and signal line are moving close to each other but are not indicating of any directional move.

The long-term GMMA chart is very tightly packed with short-term lines are starting to move up, directing a short-term upward movement.

The stock saw a bearish 9X18 crossover a week ago.

cor

SIEMENS’s average correlation of 0.60 with the Nifty is positive. The stock will replicate the movements of Nifty. [stockquote]NIFTYBEES[/stockquote] 

vol

SIEMENS has a historical volatility in the range of 0.3 to 0.9. The scrip’s volatility is currently in the middle of the range and hence is not a concern.

Looking at these technicals a short-term buy is suggested if a pullback from the 650 levels is seen on higher volumes. A longer-term call could be made after a decisive break-out of the range in either direction.

Enhanced by Zemanta

Analysis: TATAGLOBAL

Today’s pick is [stockquote]TATAGLOBAL[/stockquote]. The stock has been in a up-trend for the most part since Feb this year. In the last three month period, the stock moved 21% Vs. 4% of Nifty’s.The stock is currently trading near its 52 weeks high.

image

Oscillators RSI and CMO are currently at 54 and 31, and are close to the over-bought territory but are not suggesting any direction.

MACD line has just crossed the signal line from above, giving a bearish signal. This can be an early indicator of an upcoming down-trend.

The long-term GMMA chart is suggesting an upward direction with the fanning out of the lines.

The technicals are also in the divergence mode with the current price action, which is a short term bearish sign for the stock.

image

TATAGLOBAL’s average correlation of 0.46 with the Nifty is positive. The stock will replicate the movements of Nifty. [stockquote]NIFTYBEES[/stockquote]

image

TATAGLOBAL has a historical volatility in the range of 0.3 to 0.9. The scrip’s volatility is currently in the middle of the range and hence is not a concern.

Looking at these technicals a short-term sell is suggested. A correction to the long-term trend-line will see a continuation of the longer-term up-trend.

Enhanced by Zemanta