Category: Your Money

India VIX vs. SPX VIX

The VIX index is considered a gauge of fear in the markets. A high VIX entails high option implied volatility and occurs when traders bid up options. Given the recent market turbulence where pretty much all asset classes and equity markets across the board tanked, we wanted to check if VIX indices across markets had any relationship with each other.

VIX since 2009

The India VIX index was introduced only in 2009. Let’s start by plotting it vs. the S&P 500 (SPX) Vix to see if it passes a visual sniff test.

vix.historical

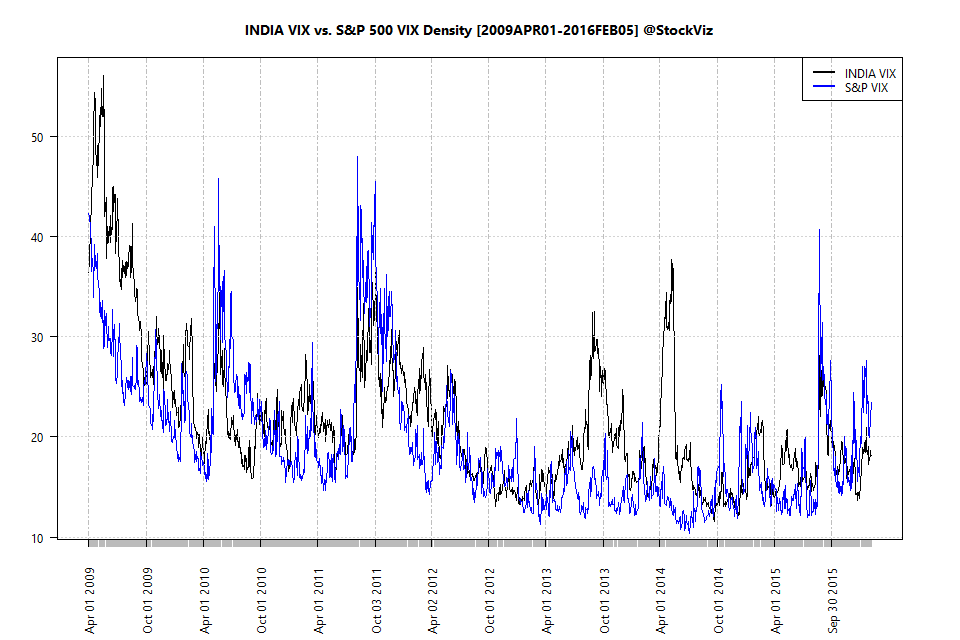
We can see at least five instances where India Vix popped without a corresponding move by SPX VIX.

Distribution

The problem with trying to nail down a relationship between the two indices is that, as one would expect, India VIX is way more dispersed than its SPX counterpart. Here’s the density plot.

india vix - spx vix density plot

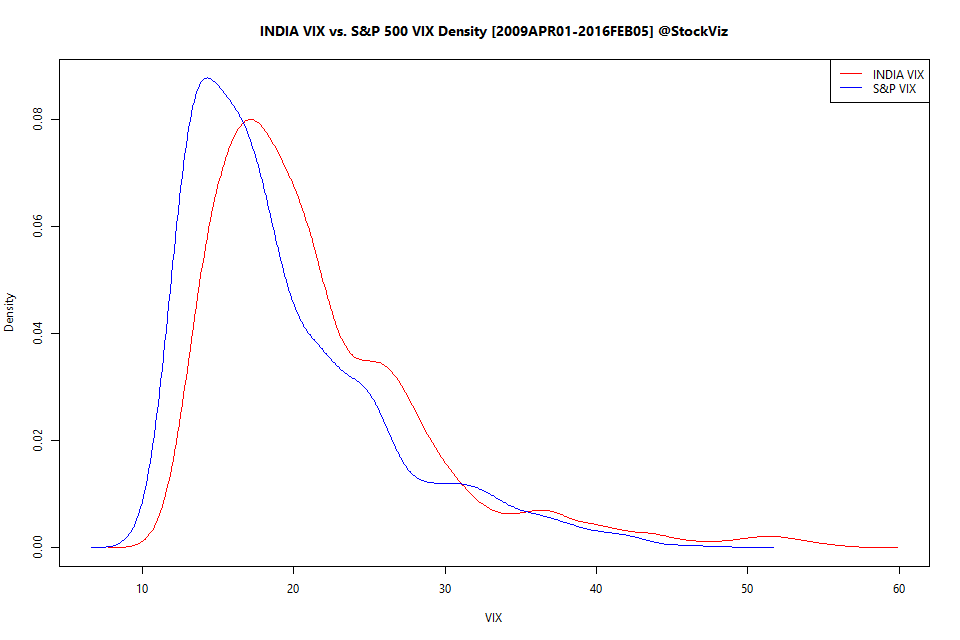
India vs. spx vix density plot by year.

They might share the same suffix, but they are two completely different beasts.

Cross-correlation

The plots above look at VIX levels. Maybe we should check if the changes in VIX are related. Here’s the cross-correlation plot.

india vix and spx vix cross-correlation plot

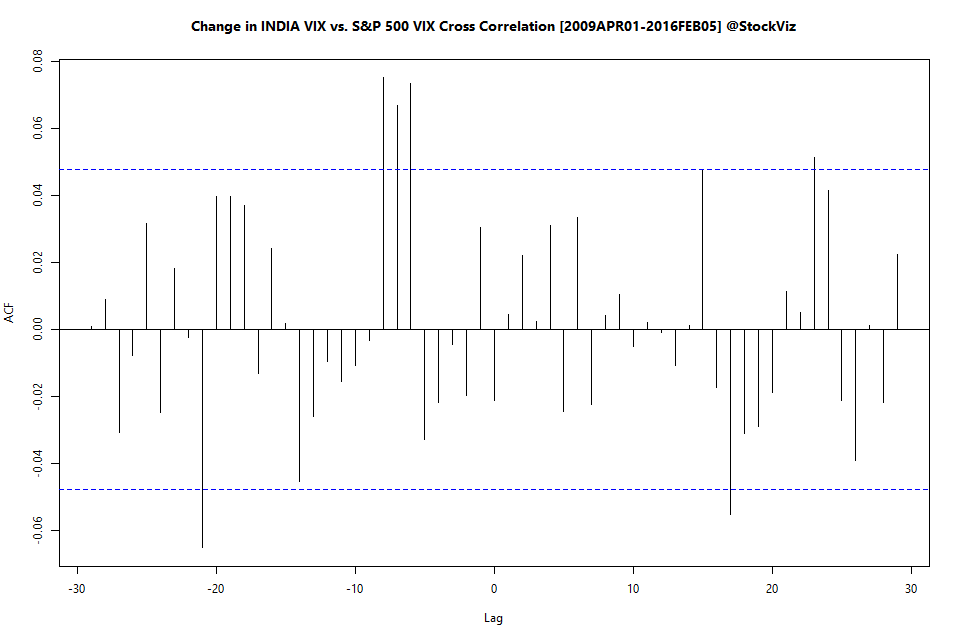
India vix and spx vix cross correlation by year.

Conclusion

We cannot really use the two Vix indices to predict each other’s moves.

Index Update 06.02.2016

MOMENTUM

We run our proprietary momentum scoring algorithm on indices just like we do on stocks. You can use the momentum scores of sub-indices to get a sense for which sectors have the wind on their backs and those that are facing headwinds.

Traders can pick their longs in sectors with high short-term momentum and their shorts in sectors with low momentum. Investors can use the longer lookback scores to position themselves using our re-factored index Themes.

You can see how the momentum algorithm has performed on individual stocks here.

Here are the best and the worst sub-indices:

index momentum best 365 2016-02-05 png

index momentum best 50 2016-02-05 png

index momentum worst 365 2016-02-05 png

index momentum worst 50 2016-02-05 png

Relative Strength Spread

NIFTY_500 relative-spread-index 50 2016-02-05 png

Refactored Index Performance

50-day performance, from November 26, 2015 through February 05, 2016:

Trend Model Summary

Index Signal % From Peak Day of Peak
NIFTY AUTO SHORT
17.62
2015-Jan-27
NIFTY BANK SHORT
26.24
2015-Jan-27
NIFTY COMMODITIES SHORT
38.78
2008-Jan-04
NIFTY CONSUMPTION SHORT
10.38
2015-Aug-05
NIFTY ENERGY LONG
32.92
2008-Jan-14
NIFTY FIN SERVICE SHORT
22.73
2015-Jan-28
NIFTY FMCG LONG
12.69
2015-Feb-25
NIFTY INFRA SHORT
61.52
2008-Jan-09
NIFTY IT LONG
88.24
2000-Feb-21
NIFTY MEDIA SHORT
18.97
2008-Jan-04
NIFTY METAL SHORT
70.09
2008-Jan-04
NIFTY MNC SHORT
18.01
2015-Aug-10
NIFTY PHARMA SHORT
15.75
2015-Apr-08
NIFTY PSE SHORT
38.71
2008-Jan-04
NIFTY PSU BANK LONG
59.05
2010-Nov-05
NIFTY REALTY SHORT
92.16
2008-Jan-14
NIFTY SERV SECTOR SHORT
17.71
2015-Mar-03
The only bright spot was FMCG – probably aided by a flight to safety. It is brutal out there…

Theme: Acceleration Update 02.02.2016

held since returns (%)
RUSHIL
2015-Nov-19
-18.69
ESTER
2015-Nov-19
-23.34
GUFICBIO
2015-Nov-19
-10.58
TRIVENI
2015-Dec-01
+28.74
MRO-TEK
2015-Dec-01
+43.11
JETAIRWAYS
2016-Jan-01
-17.11
VIVIMEDLAB
2016-Jan-01
-4.38
JUBILANT
2016-Jan-01
-14.31
KPIT
2016-Jan-01
-15.96
LYPSAGEMS
2016-Jan-01
-17.07
RJL
2016-Jan-01
-5.44
TVSELECT
2016-Jan-01
-23.33
TRIGYN
2016-Jan-01
-13.49
GULFPETRO
2016-Jan-01
-15.56
CORDSCABLE
2016-Jan-01
-0.09
WINDMACHIN
2016-Jan-01
-21.26
JAGSNPHARM
2016-Jan-01
-7.40
GSS
2016-Jan-01
-13.89
MOREPENLAB
2016-Jan-01
-8.11
VIKASECO
2016-Jan-01
-1.23
Since the last rebalance on 2016-Jan-01 till 2016-Feb-01, this strategy has returned -13.90%.

You can find more details about the Acceleration Theme here.

Theme: Velocity Update 02.02.2016

held since returns (%)
GAYAPROJ
2015-Sep-04
+53.42
SANGAMIND
2015-Sep-04
+23.27
RUSHIL
2015-Sep-04
+44.92
8KMILES
2015-Oct-06
+18.58
LYKALABS
2015-Oct-06
+12.11
DEEPIND
2015-Nov-02
-1.23
EMMBI
2015-Nov-02
+12.66
RAJESHEXPO
2015-Dec-01
+2.87
COSMOFILMS
2015-Dec-01
+3.45
JUBLINDS
2015-Dec-01
-17.27
TIRUMALCHM
2015-Dec-01
-8.17
TVSELECT
2015-Dec-01
+1.51
ESTER
2015-Dec-01
-27.63
NILKAMAL
2016-Jan-01
+9.01
DENORA
2016-Jan-01
-7.11
NCLIND
2016-Jan-01
-32.55
CTE
2016-Jan-01
+0.17
KWALITY
2016-Jan-01
-19.60
GUFICBIO
2016-Jan-01
-18.11
MIC
2016-Jan-01
-8.07
Since the last rebalance on 2016-Jan-01 till 2016-Feb-01, this strategy has returned -12.67%.

You can find more details about the Velocity Theme here.

Theme: Momentum Update 02.02.2016

held since returns (%)
CAPLIPOINT
2015-Sep-07
-15.17
GAYAPROJ
2015-Sep-07
+49.98
SANGAMIND
2015-Sep-07
+27.71
JUBILANT
2015-Oct-06
-10.63
NCLIND
2015-Oct-06
-2.06
SRIPIPES
2015-Nov-02
-20.27
LYKALABS
2015-Nov-02
-15.86
EMMBI
2015-Nov-02
+12.77
NAVINFLUOR
2015-Dec-01
-17.11
8KMILES
2015-Dec-01
+18.23
RAJESHEXPO
2015-Dec-01
+2.84
ISFT
2015-Dec-01
-33.23
RUSHIL
2015-Dec-01
-22.11
ESTER
2015-Dec-01
-28.98
RPGLIFE
2016-Jan-01
-26.21
KWALITY
2016-Jan-01
-18.51
IZMO
2016-Jan-01
-27.03
ELAND
2016-Jan-01
-28.97
GUFICBIO
2016-Jan-01
-16.34
MOREPENLAB
2016-Jan-01
-8.36
Since the last rebalance on 2016-Jan-01 till 2016-Feb-01, this strategy has returned -18.59%.

You can find more details about the Momentum Theme here.