MOMENTUM
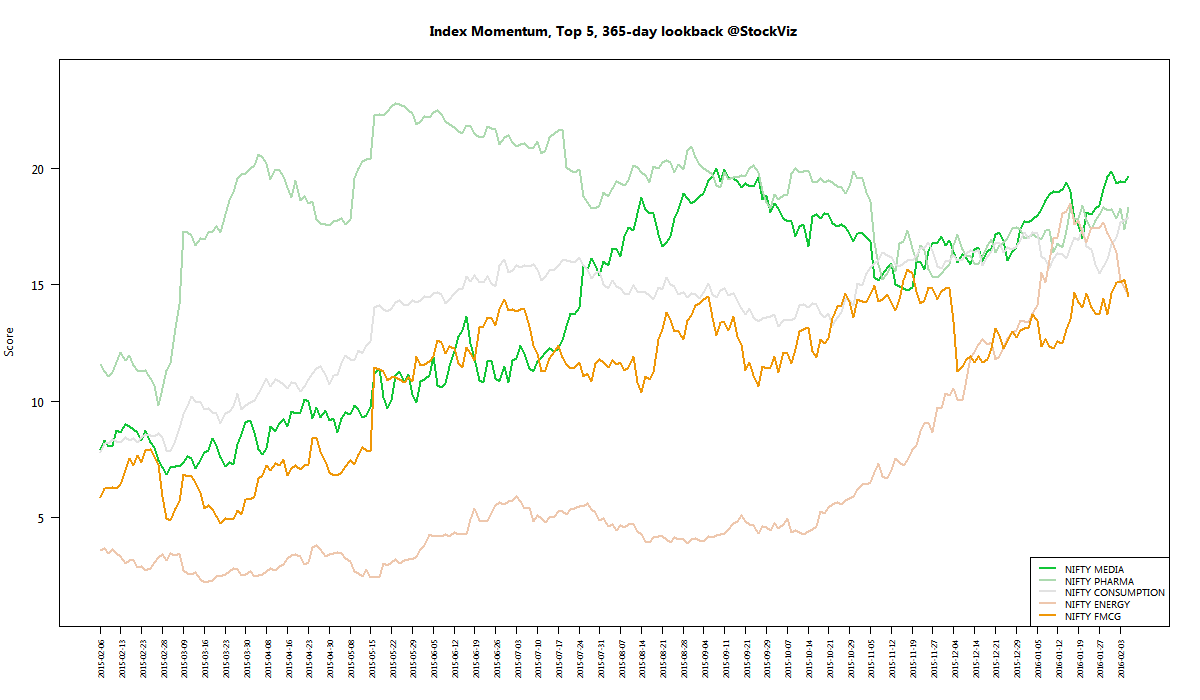
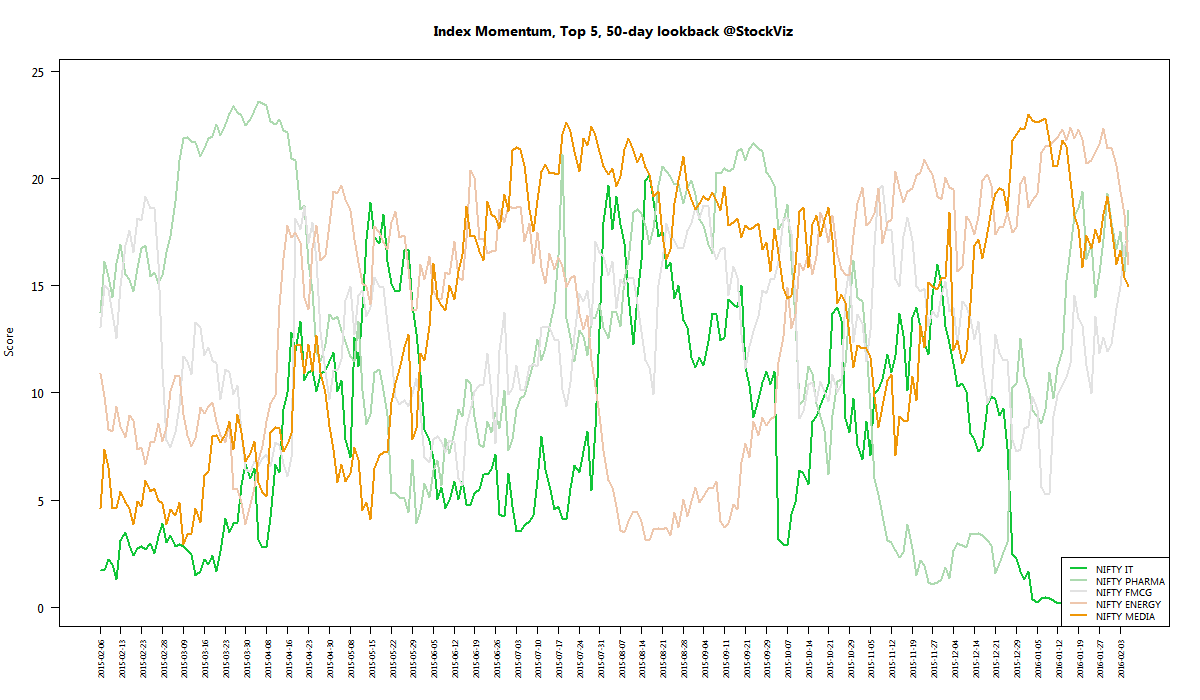
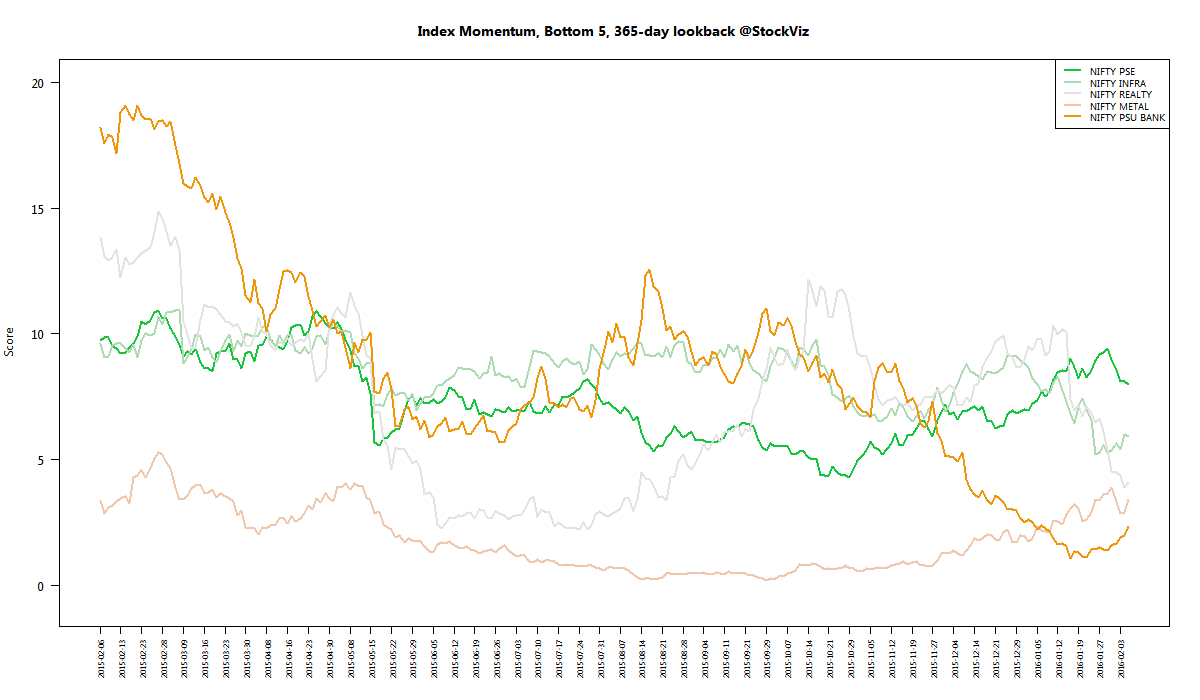
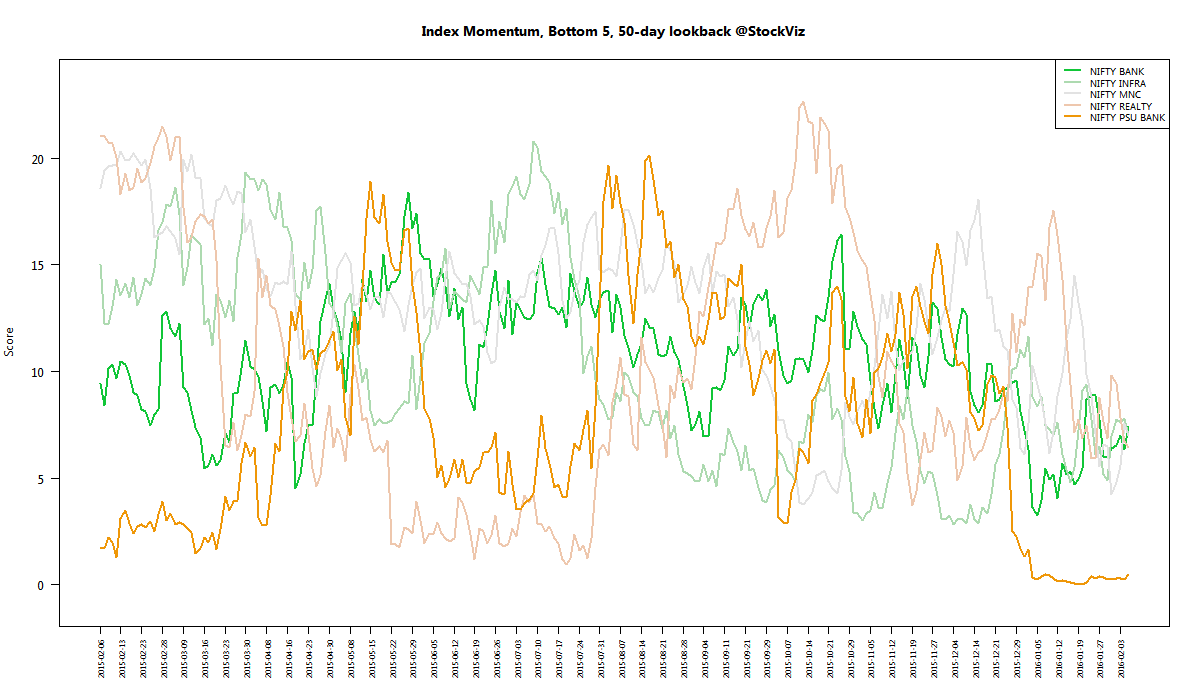
We run our proprietary momentum scoring algorithm on indices just like we do on stocks. You can use the momentum scores of sub-indices to get a sense for which sectors have the wind on their backs and those that are facing headwinds.
Traders can pick their longs in sectors with high short-term momentum and their shorts in sectors with low momentum. Investors can use the longer lookback scores to position themselves using our re-factored index Themes.
You can see how the momentum algorithm has performed on individual stocks here.
Here are the best and the worst sub-indices:
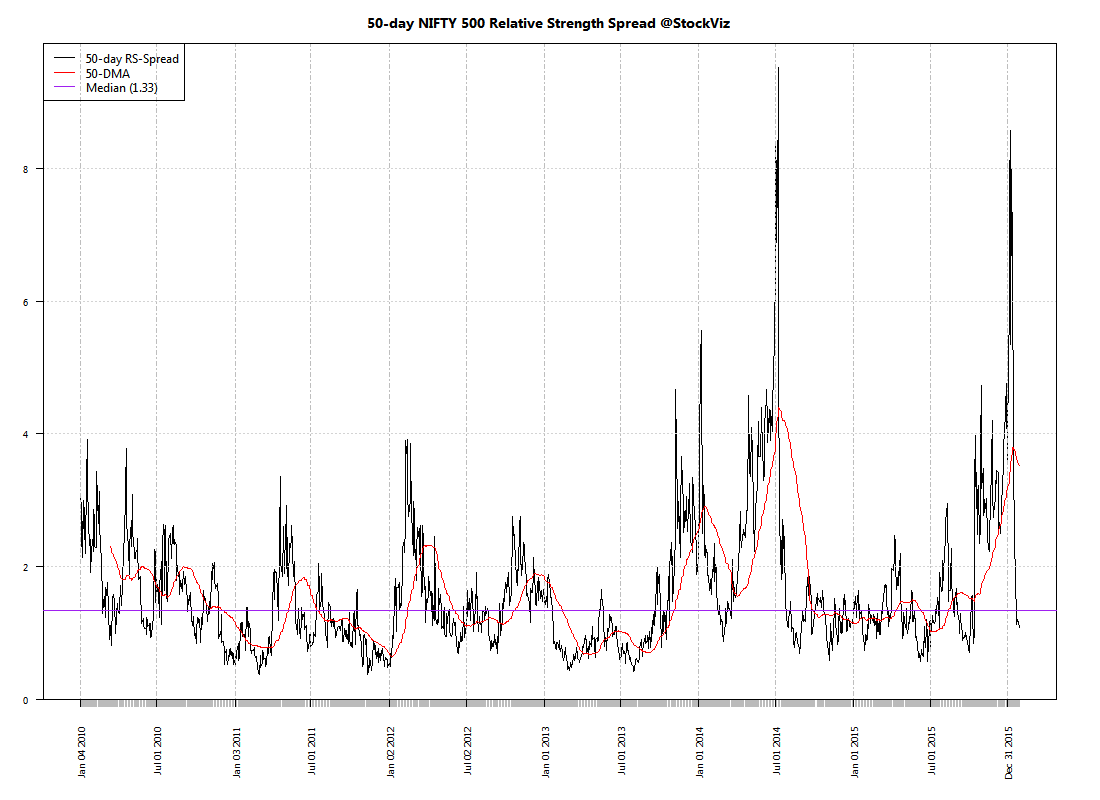
Relative Strength Spread
Refactored Index Performance
50-day performance, from November 26, 2015 through February 05, 2016:
Trend Model Summary
| Index | Signal | % From Peak | Day of Peak |
|---|---|---|---|
| NIFTY AUTO | SHORT |
17.62
|
2015-Jan-27
|
| NIFTY BANK | SHORT |
26.24
|
2015-Jan-27
|
| NIFTY COMMODITIES | SHORT |
38.78
|
2008-Jan-04
|
| NIFTY CONSUMPTION | SHORT |
10.38
|
2015-Aug-05
|
| NIFTY ENERGY | LONG |
32.92
|
2008-Jan-14
|
| NIFTY FIN SERVICE | SHORT |
22.73
|
2015-Jan-28
|
| NIFTY FMCG | LONG |
12.69
|
2015-Feb-25
|
| NIFTY INFRA | SHORT |
61.52
|
2008-Jan-09
|
| NIFTY IT | LONG |
88.24
|
2000-Feb-21
|
| NIFTY MEDIA | SHORT |
18.97
|
2008-Jan-04
|
| NIFTY METAL | SHORT |
70.09
|
2008-Jan-04
|
| NIFTY MNC | SHORT |
18.01
|
2015-Aug-10
|
| NIFTY PHARMA | SHORT |
15.75
|
2015-Apr-08
|
| NIFTY PSE | SHORT |
38.71
|
2008-Jan-04
|
| NIFTY PSU BANK | LONG |
59.05
|
2010-Nov-05
|
| NIFTY REALTY | SHORT |
92.16
|
2008-Jan-14
|
| NIFTY SERV SECTOR | SHORT |
17.71
|
2015-Mar-03
|
The only bright spot was FMCG – probably aided by a flight to safety. It is brutal out there…