Category: Your Money

Market-Cap Deciles, Part III

Part I, Part II of the series.

111% vs. 11%

A portfolio of ~150, equal-weight, small-cap stocks, rebalanced monthly, gave a return of 111% from 2015 through now.
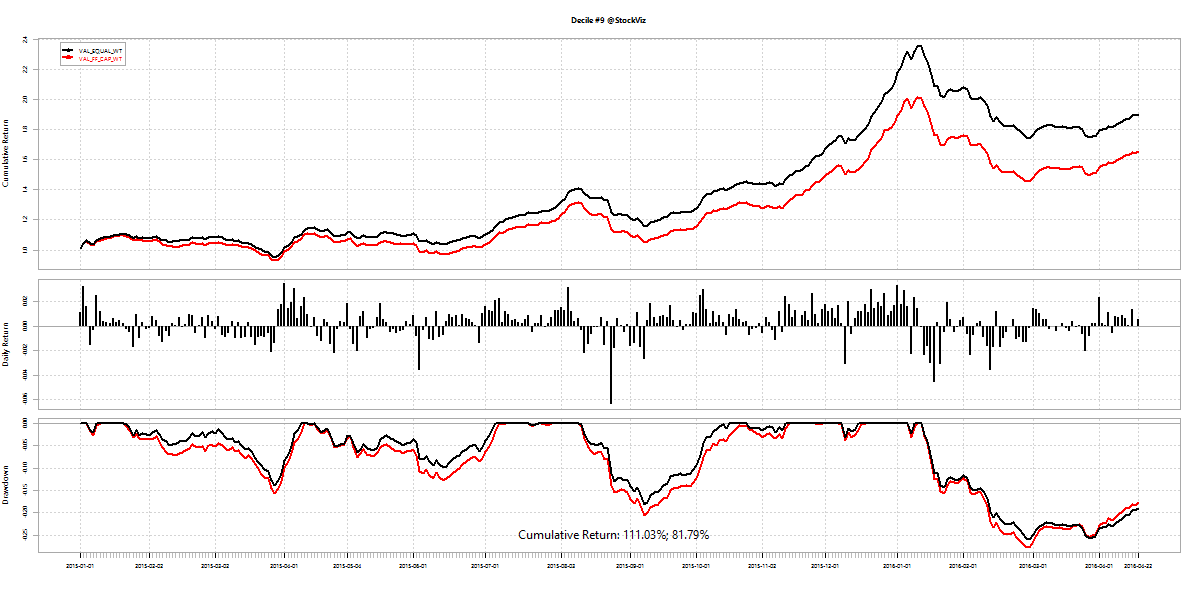
decile.9.2016-04-24

While a similar portfolio of mega-cap stocks gave a return of 11% during the same time frame.
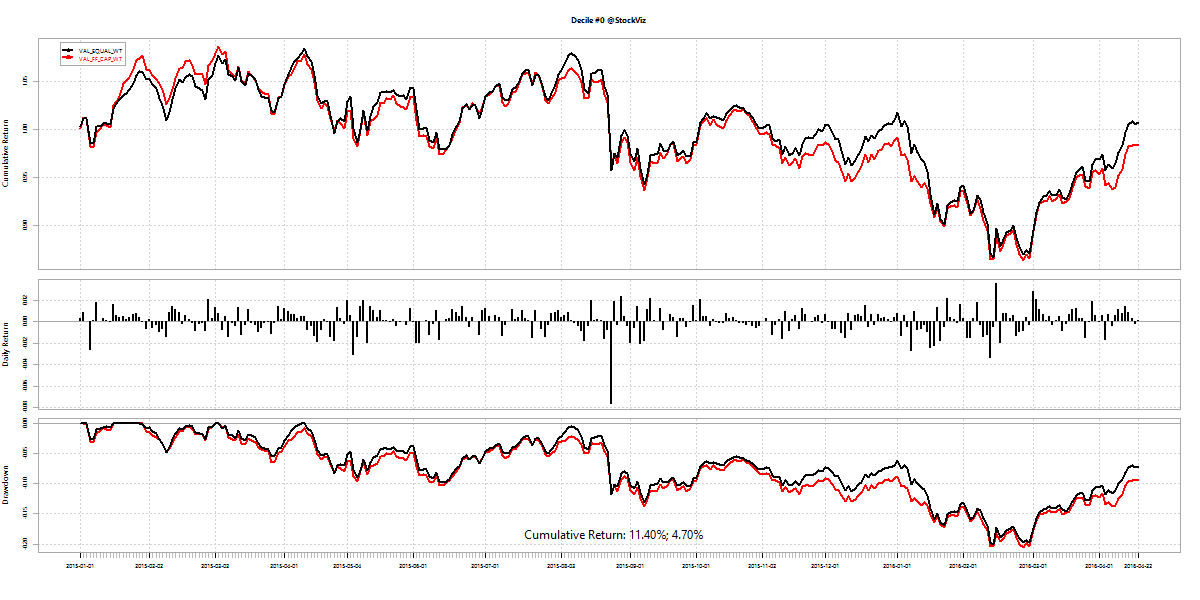
decile.0.2016-04-24

Variance

Returns from the small-cap portfolio are accompanied by larger volatility.
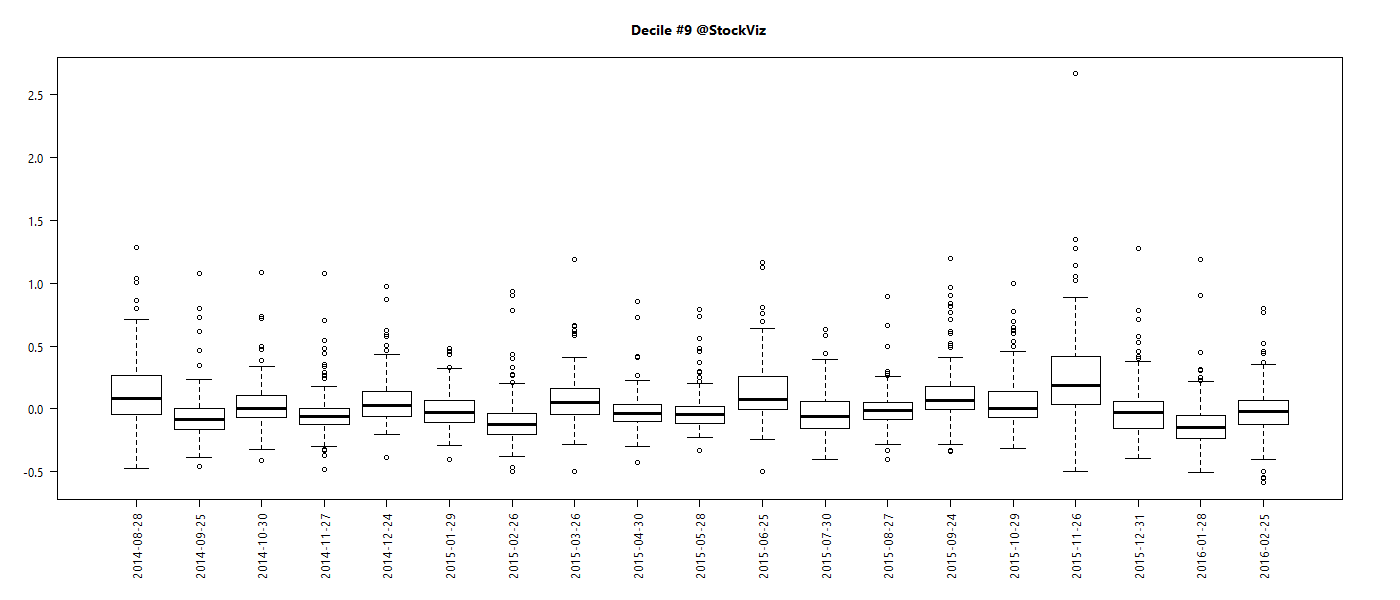
decile.distribution.9.2016-04-24

decile.distribution.0.2016-04-24

Accessibility

Is the alpha accessible? Given the meager volumes in the small-cap space, narrow circuit breakers and intra-day volatility of prices, small-cap alpha is hard to access. The impact cost of trading 150 small-cap stocks every month would be pretty high for large positions.

However, a portfolio with an exposure of Rs. 10,000 – Rs. 50,000 per stock is doable. So, theoretically, you can size the portfolio between Rs. 15,00,000 – Rs. 75,00,000 to access this alpha.

Appendix

Cumulative wealth charts for each decile (both cap- and equal-weighted): (a)

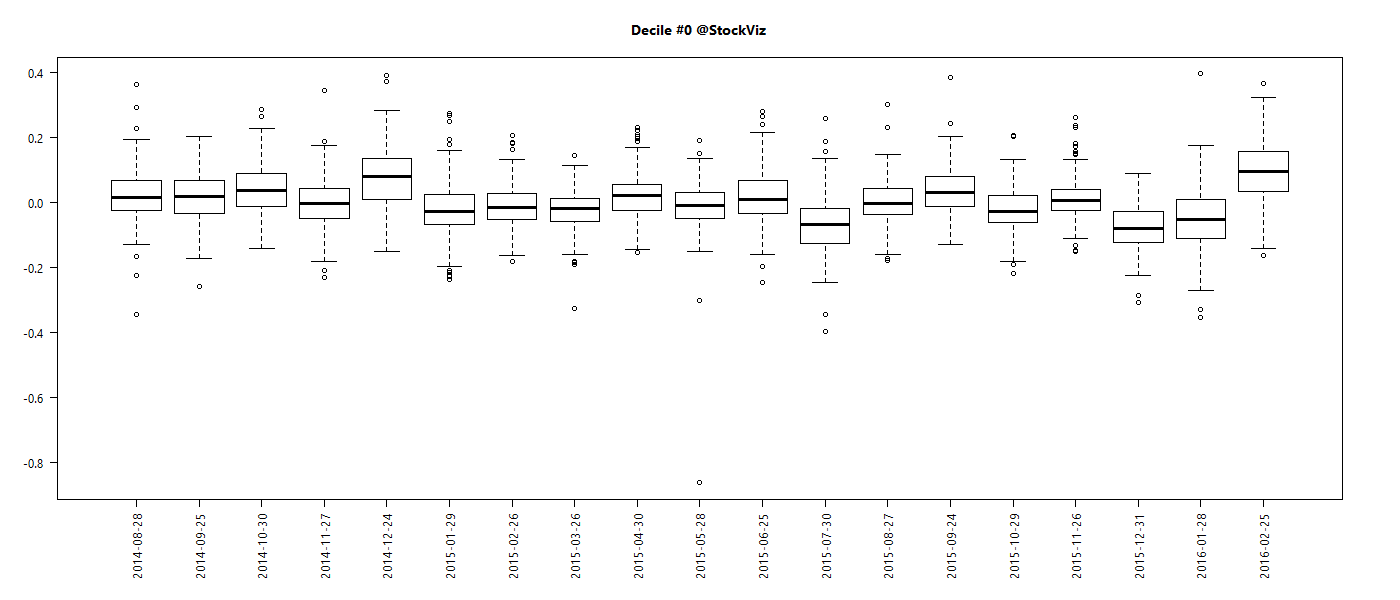
Box plots of cumulative returns of stocks in each decile: (b)
Theme: Acceleration Update 04.04.2016

held since returns (%)
TRIVENI
2015-Dec-01
+39.34
VIVIMEDLAB
2016-Jan-01
-4.57
MOREPENLAB
2016-Jan-01
-27.53
FIEMIND
2016-Feb-02
+17.31
TVTODAY
2016-Feb-02
+1.00
TVSMOTOR
2016-Feb-02
+8.66
ORIENTABRA
2016-Feb-02
+2.08
HFCL
2016-Feb-02
-20.97
MINDAIND
2016-Mar-02
+19.07
TRF
2016-Mar-02
+16.40
VAKRANGEE
2016-Mar-02
-9.44
INFINITE
2016-Mar-02
+3.67
KPIT
2016-Mar-02
+7.57
ASHAPURMIN
2016-Mar-02
+0.91
HDIL
2016-Mar-02
+13.27
BODALCHEM
2016-Mar-02
+34.59
RPOWER
2016-Mar-02
+9.06
MANAPPURAM
2016-Mar-02
+10.74
IFCI
2016-Mar-02
+7.17
RTNPOWER
2016-Mar-02
+3.03
Since the last rebalance on 2016-Mar-02 till 2016-Apr-01, this strategy has returned +8.86%

You can find more details about the Acceleration Theme here.

Theme: Velocity Update 04.04.2016

held since returns (%)
GAYAPROJ
2015-Sep-04
+27.71
SANGAMIND
2015-Sep-04
+11.09
8KMILES
2015-Oct-06
+10.64
RAJESHEXPO
2015-Dec-01
-12.08
COSMOFILMS
2015-Dec-01
+7.29
NILKAMAL
2016-Jan-01
-11.03
KWALITY
2016-Jan-01
-15.69
ICIL
2016-Feb-02
-7.47
GMBREW
2016-Feb-02
+18.97
DISHMAN
2016-Feb-02
-1.20
HIMATSEIDE
2016-Feb-02
-1.57
NIITLTD
2016-Feb-02
-1.13
GENUSPOWER
2016-Feb-02
-8.10
TRIDENT
2016-Feb-02
-3.93
TRIVENI
2016-Feb-02
+9.36
JUBILANT
2016-Mar-02
+24.80
RUSHIL
2016-Mar-02
-33.72
VAKRANGEE
2016-Mar-02
-9.44
CHENNPETRO
2016-Mar-02
+12.17
FCEL
2016-Mar-02
-6.62
Since the last rebalance on 2016-Mar-02 till 2016-Apr-01, this strategy has returned +6.52%

You can find more details about the Velocity Theme here.

Theme: Momentum Update 04.04.2016

held since returns (%)
SANGAMIND
2015-Sep-07
+14.87
NAVINFLUOR
2015-Dec-01
-8.90
8KMILES
2015-Dec-01
+10.09
RAJESHEXPO
2015-Dec-01
-12.27
KWALITY
2016-Jan-01
-16.69
MOREPENLAB
2016-Jan-01
-28.62
NILKAMAL
2016-Feb-02
-14.98
ICIL
2016-Feb-02
-7.74
GMBREW
2016-Feb-02
+18.41
COSMOFILMS
2016-Feb-02
+7.29
NDL
2016-Feb-02
-13.72
AEGISCHEM
2016-Feb-02
-0.10
MIC
2016-Feb-02
-10.63
WELSPUNIND
2016-Mar-02
+14.48
GAYAPROJ
2016-Mar-02
-12.90
JINDALPOLY
2016-Mar-02
+5.31
DISHMAN
2016-Mar-02
+0.59
JUBILANT
2016-Mar-02
+25.13
RUSHIL
2016-Mar-02
-34.70
CHENNPETRO
2016-Mar-02
+11.32
Since the last rebalance on 2016-Mar-02 till 2016-Apr-01, this strategy has returned +5.61%

You can find more details about the Momentum Theme here.

March Madness 2016

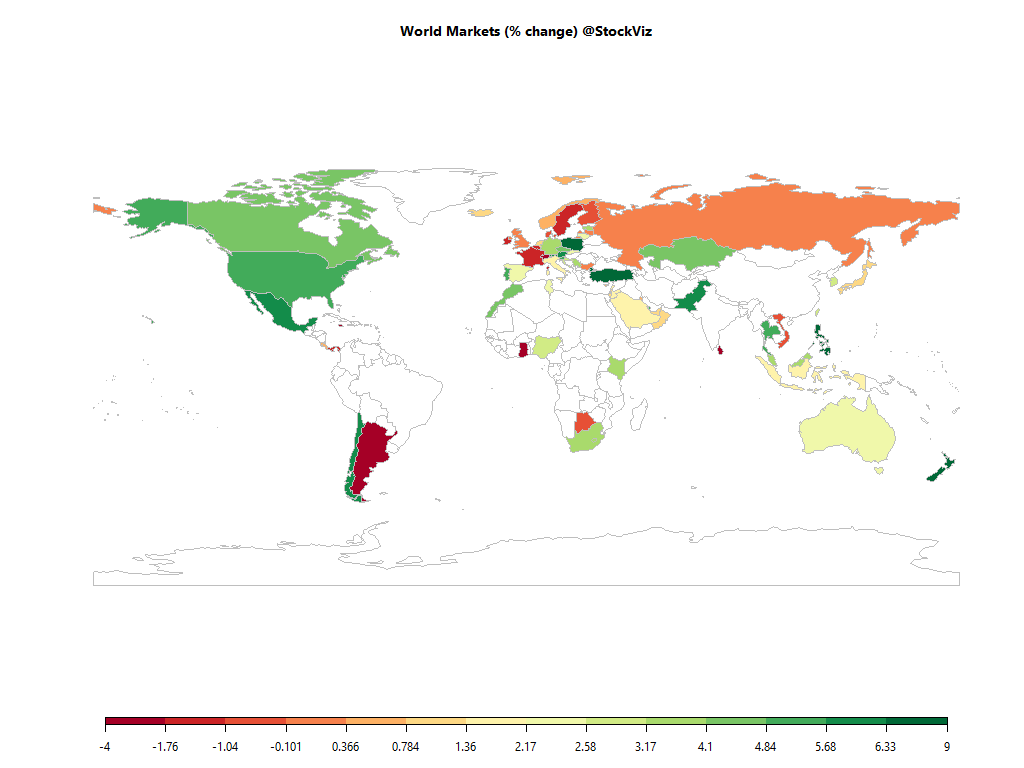
world.2016-02-29.2016-03-31

Equities

Major
DAX(DEU) +3.33%
CAC(FRA) -1.04%
UKX(GBR) +0.09%
NKY(JPN) +0.86%
SPX(USA) +5.44%
MINTs
JCI(IDN) +1.51%
INMEX(MEX) +5.97%
NGSEINDX(NGA) +2.95%
XU030(TUR) +9.00%
BRICS
IBOV(BRA) +16.69%
SHCOMP(CHN) +11.96%
NIFTY(IND) +10.39%
INDEXCF(RUS) +0.37%
TOP40(ZAF) +4.08%

Commodities

Energy
Brent Crude Oil +10.30%
Ethanol +4.44%
Heating Oil +8.39%
RBOB Gasoline +38.22%
Natural Gas +13.84%
WTI Crude Oil +11.73%
Metals
Palladium +15.93%
Copper +2.35%
Gold 100oz -0.06%
Silver 5000oz +4.73%
Platinum +5.15%

Currencies

USDEUR:-4.70% USDJPY:-0.63%

MINTs
USDIDR(IDN) -1.56%
USDMXN(MEX) -4.16%
USDNGN(NGA) +0.00%
USDTRY(TUR) -4.86%
BRICS
USDBRL(BRA) -9.97%
USDCNY(CHN) -1.35%
USDINR(IND) -3.18%
USDRUB(RUS) -9.94%
USDZAR(ZAF) -7.24%
Agricultural
Cocoa -2.75%
Feeder Cattle -0.55%
White Sugar +8.29%
Cattle -4.71%
Coffee (Robusta) +9.77%
Corn -1.27%
Lumber +21.75%
Orange Juice +17.57%
Sugar #11 +4.72%
Coffee (Arabica) +11.78%
Cotton +2.76%
Soybeans +7.00%
Lean Hogs -2.05%
Soybean Meal +4.55%
Wheat +5.96%

Credit Indices

Index Change
Markit CDX EM +2.89%
Markit CDX NA HY +3.28%
Markit CDX NA IG -27.66%
Markit iTraxx Asia ex-Japan IG -6.67%
Markit iTraxx Australia -15.03%
Markit iTraxx Europe -26.80%
Markit iTraxx Europe Crossover -98.68%
Markit iTraxx Japan -9.45%
Markit MCDX (Municipal CDS) -14.58%
Markets rebounded with the Fed assuming the role of the world’s central bank…

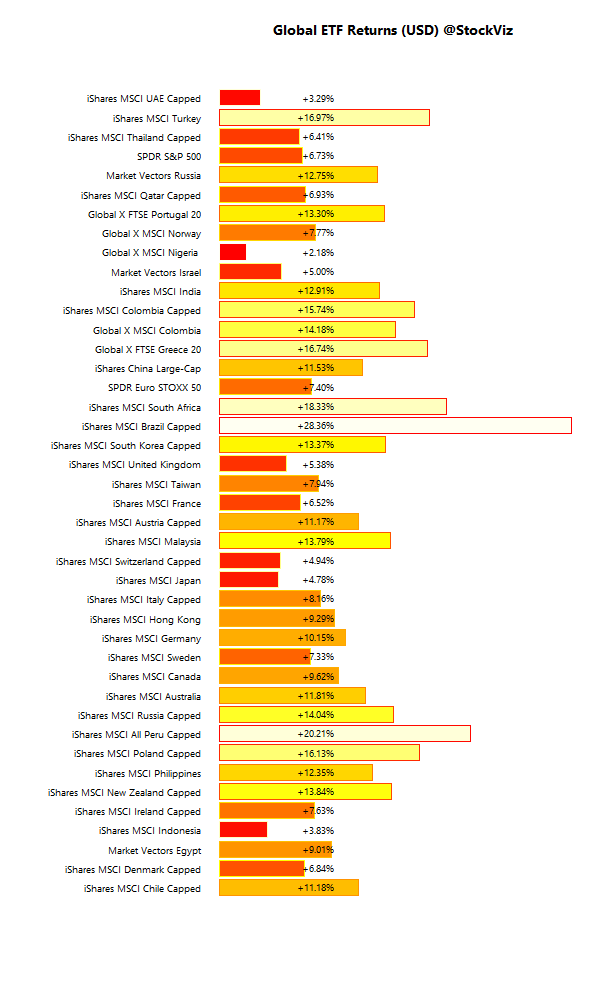
International ETFs (USD)

global.etf.performance.2016-02-29.2016-03-31

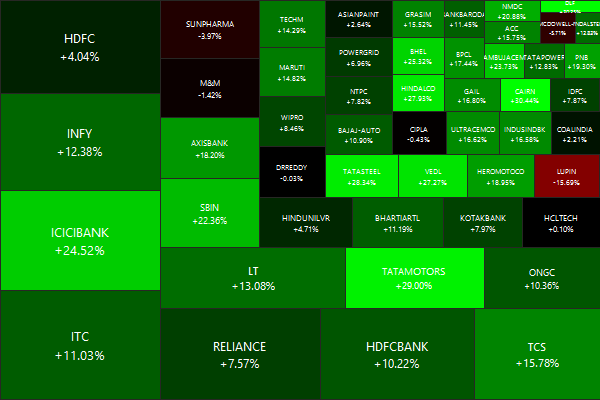
Nifty Heatmap

NIFTY 50.2016-02-29.2016-03-31

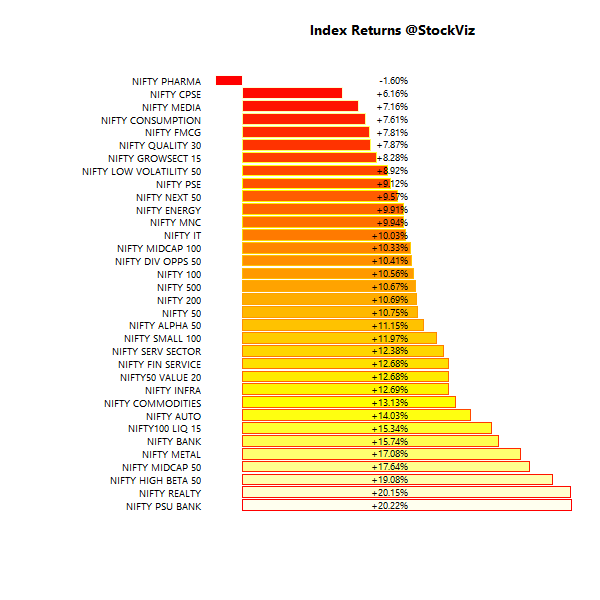
Index Returns

index.performance.2016-02-29.2016-03-31

Market Cap Decile Performance

Decile Mkt. Cap. Adv/Decl
1 (micro) +0.54% 70/61
2 +9.38% 82/48
3 +10.53% 91/39
4 +9.03% 82/48
5 +7.85% 84/46
6 +6.78% 85/45
7 +10.83% 83/47
8 +7.10% 83/47
9 +12.46% 81/49
10 (mega) +1.97% 74/57

Top Winners and Losers

TATAMOTORS +29.00%
RELINFRA +30.19%
CAIRN +30.44%
LUPIN -15.69%
APOLLOHOSP -9.19%
COALINDIA -6.13%
Dash for trash?

ETF Performance

PSUBNKBEES +19.47%
BANKBEES +15.43%
INFRABEES +12.76%
NIFTYBEES +11.70%
JUNIORBEES +9.02%
CPSEETF +8.08%
GOLDBEES -3.22%
With bank balance-sheet clean up in full swing, banks got the better bid…

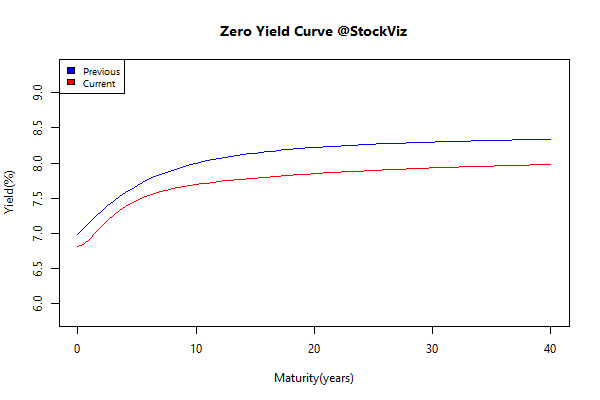
Yield Curve

yieldCurve.2016-02-29.2016-03-31

Bond Indices

Sub Index Change in YTM Total Return(%)
0 5 -0.22 +1.22%
5 10 -0.24 +1.91%
10 15 -0.30 +2.56%
15 20 -0.35 +3.94%
20 30 -0.37 +4.59%
Rate cut already factored in?

Investment Theme Performance

The worst hit asset classes saw the steepest rebound…

Equity Mutual Funds

Bond Mutual Funds

Thought to sum up the month

Why do amateurs believe they can outperform the professionals — or even identify those pros who will outperform? (Performance of individual mutual funds cannot be predicted with any greater degree of accuracy than individual stocks or bonds.)

  1. Overconfidence
  2. Optimism Bias
  3. Hindsight Bias
  4. Attribution Bias
  5. Confirmation Bias

Source: Why We Think We’re Better Investors Than We Are