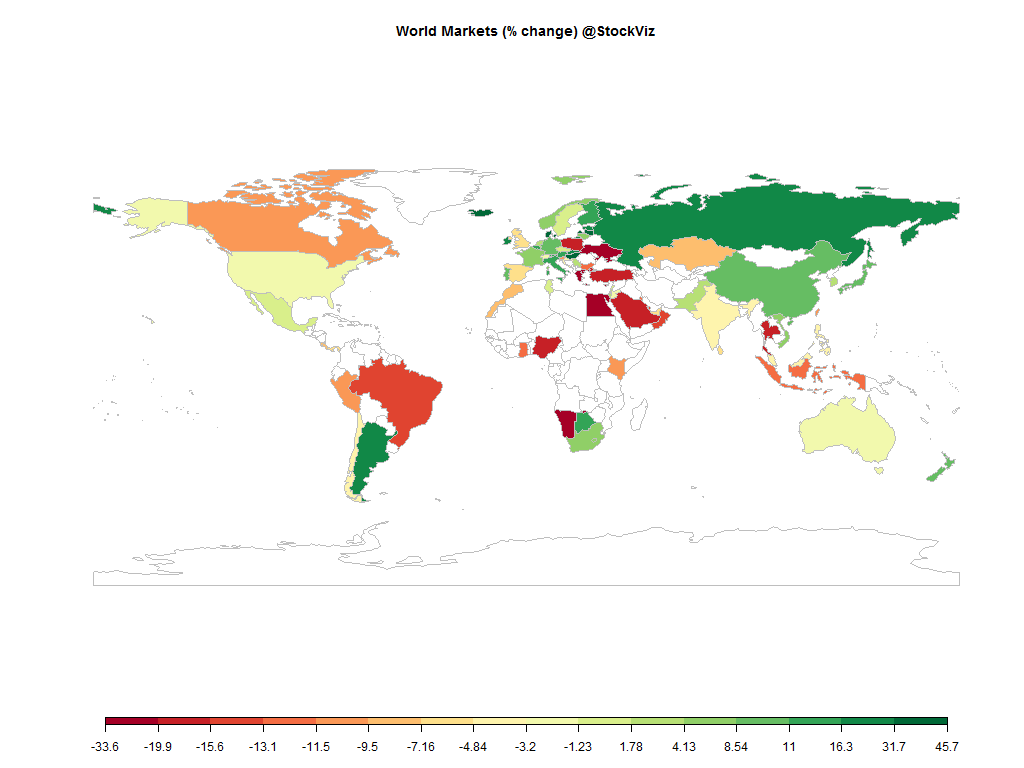
Equities
| MINTs | |
|---|---|
| JCI(IDN) | -12.13% |
| INMEX(MEX) | -1.18% |
| NGSEINDX(NGA) | -17.36% |
| XU030(TUR) | -17.64% |
| BRICS | |
|---|---|
| IBOV(BRA) | -13.31% |
| SHCOMP(CHN) | +9.41% |
| NIFTY(IND) | -4.06% |
| INDEXCF(RUS) | +26.12% |
| TOP40(ZAF) | +4.16% |
Commodities
| Energy | |
|---|---|
| Ethanol | -13.17% |
| Brent Crude Oil | -33.76% |
| Heating Oil | -39.27% |
| Natural Gas | -20.45% |
| RBOB Gasoline | -11.49% |
| WTI Crude Oil | -29.88% |
| Metals | |
|---|---|
| Silver 5000oz | -12.10% |
| Platinum | -26.40% |
| Gold 100oz | -10.86% |
| Copper | -25.00% |
| Palladium | -29.43% |
Currencies
| MINTs | |
|---|---|
| USDIDR(IDN) | +11.64% |
| USDMXN(MEX) | +17.00% |
| USDNGN(NGA) | +8.49% |
| USDTRY(TUR) | +24.88% |
| BRICS | |
|---|---|
| USDBRL(BRA) | +49.03% |
| USDCNY(CHN) | +4.64% |
| USDINR(IND) | +4.93% |
| USDRUB(RUS) | +24.64% |
| USDZAR(ZAF) | +34.63% |
| Agricultural | |
|---|---|
| Lean Hogs | -26.84% |
| Sugar #11 | +4.32% |
| Cattle | -18.04% |
| Coffee (Arabica) | -25.53% |
| Cotton | +4.21% |
| Lumber | -21.95% |
| White Sugar | +7.86% |
| Cocoa | +14.74% |
| Corn | -10.56% |
| Feeder Cattle | -23.82% |
| Orange Juice | -0.04% |
| Soybeans | -14.65% |
| Wheat | -20.25% |
| Coffee (Robusta) | -21.25% |
| Soybean Meal | -27.19% |
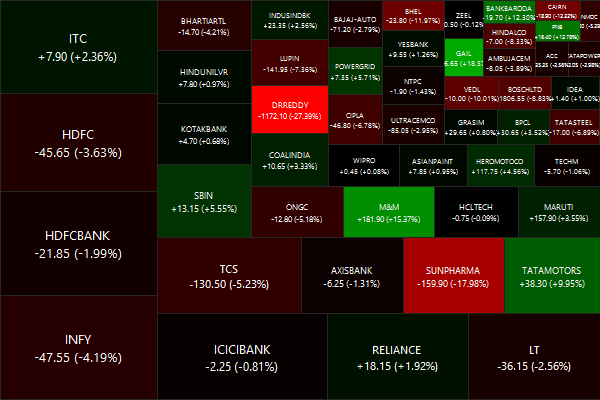
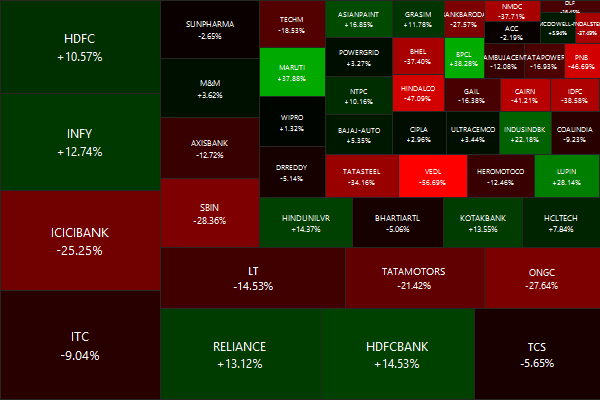
Nifty Heatmap
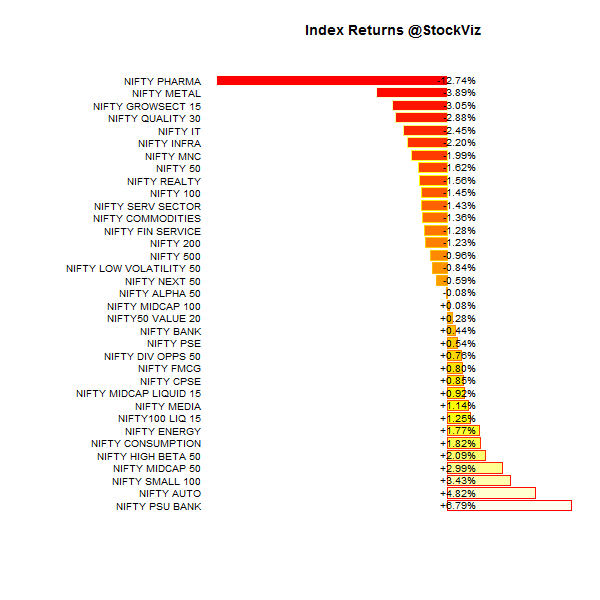
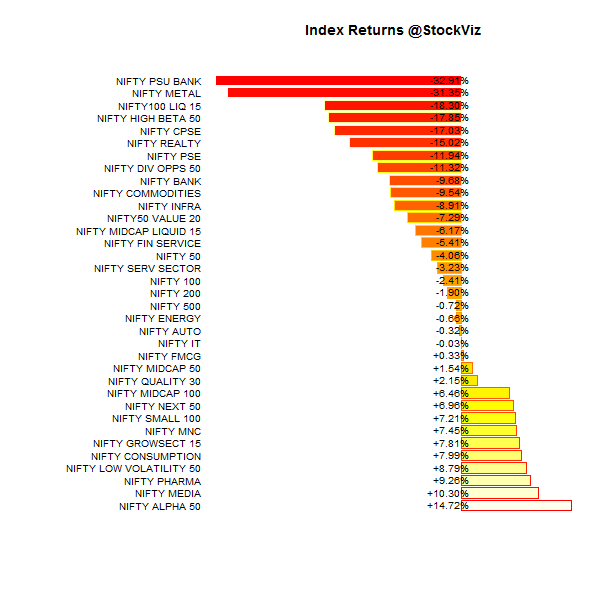
Index Returns
Market Cap Decile Performance
| Decile | Mkt. Cap. | Adv/Decl |
|---|---|---|
| 1 (micro) | +83.07% | 95/39 |
| 2 | +64.59% | 104/29 |
| 3 | +40.56% | 91/42 |
| 4 | +31.75% | 80/53 |
| 5 | +28.26% | 82/51 |
| 6 | +27.95% | 85/48 |
| 7 | +14.75% | 76/57 |
| 8 | +19.85% | 75/58 |
| 9 | +5.53% | 68/65 |
| 10 (mega) | +0.91% | 68/66 |
It was the year of the small-caps – vastly out-performing the NIFTY 50.
Top Winners and Losers
Commodities and public sector bank stocks got pummeled…
ETF Performance
| JUNIORBEES | +7.87% |
| NIFTYBEES | -4.26% |
| GOLDBEES | -7.50% |
| INFRABEES | -9.11% |
| BANKBEES | -10.32% |
| CPSEETF | -14.07% |
| PSUBNKBEES | -31.65% |
Broad-based indices had very little to offer…
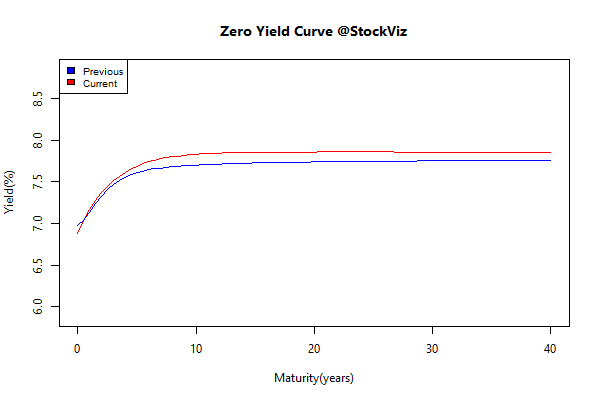
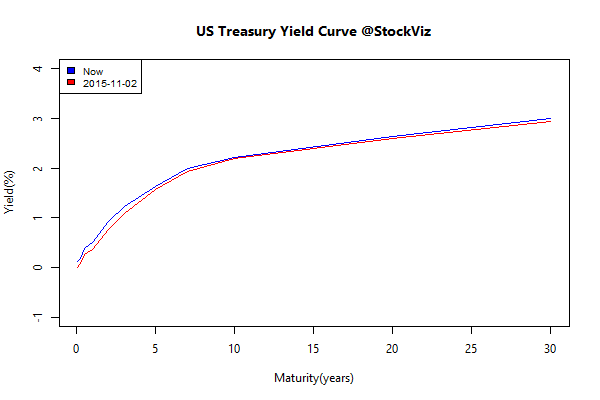
Yield Curve
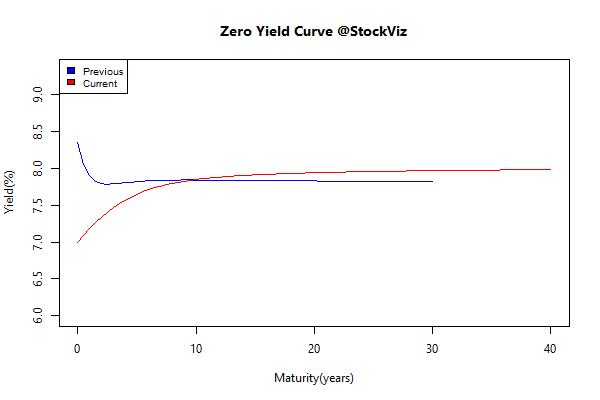
Bond Indices
| Sub Index | Change in YTM | Total Return(%) |
|---|---|---|
| 0 5 | -0.50 | +9.21% |
| 5 10 | -0.14 | +8.78% |
| 10 15 | +0.01 | +7.83% |
| 15 20 | +0.09 | +7.02% |
| 20 30 | +0.13 | +6.10% |
On a total return basis, the long-bonds barely kept up with inflation.
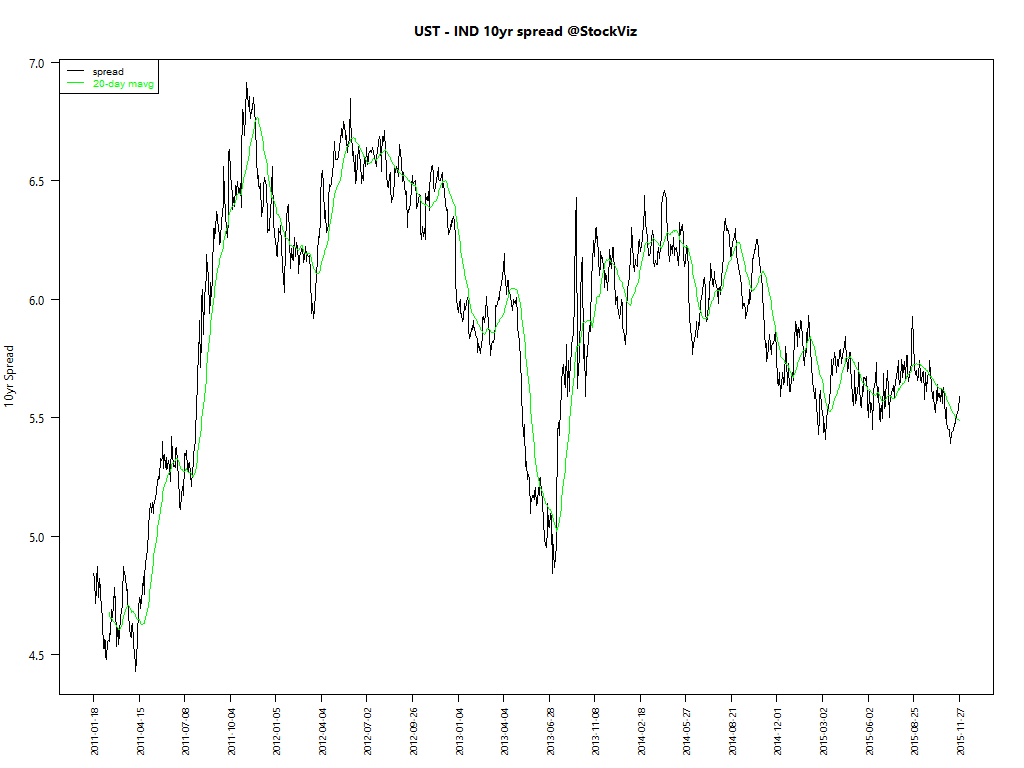
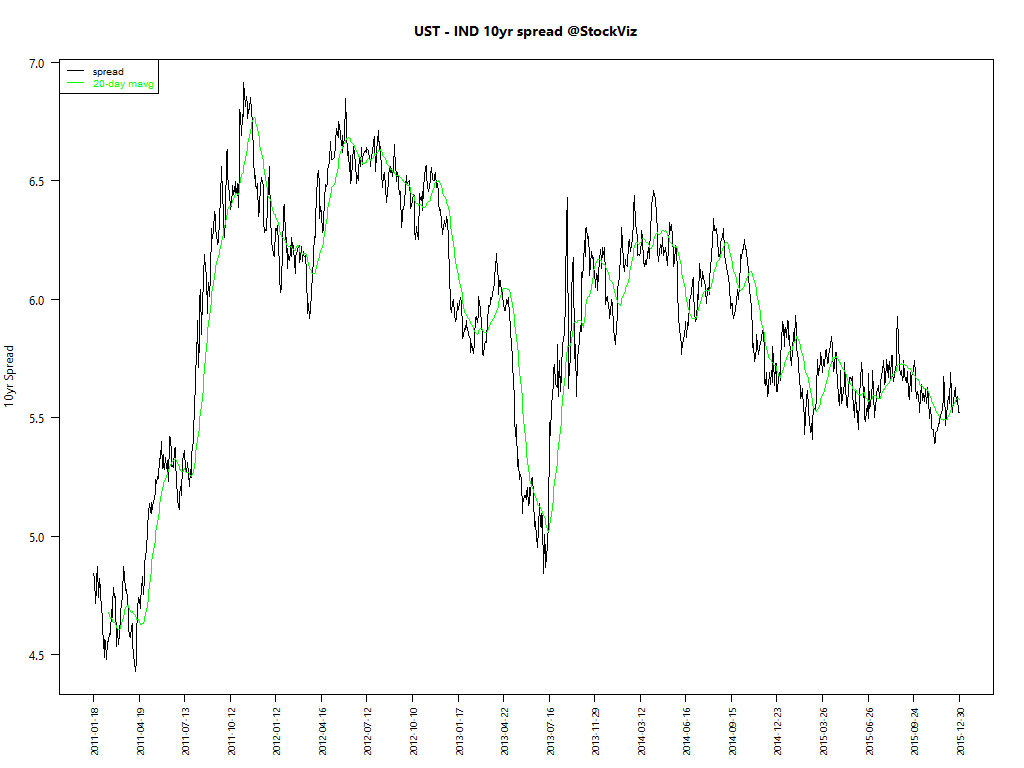
Spread between US Treasuries and Indian Gilts
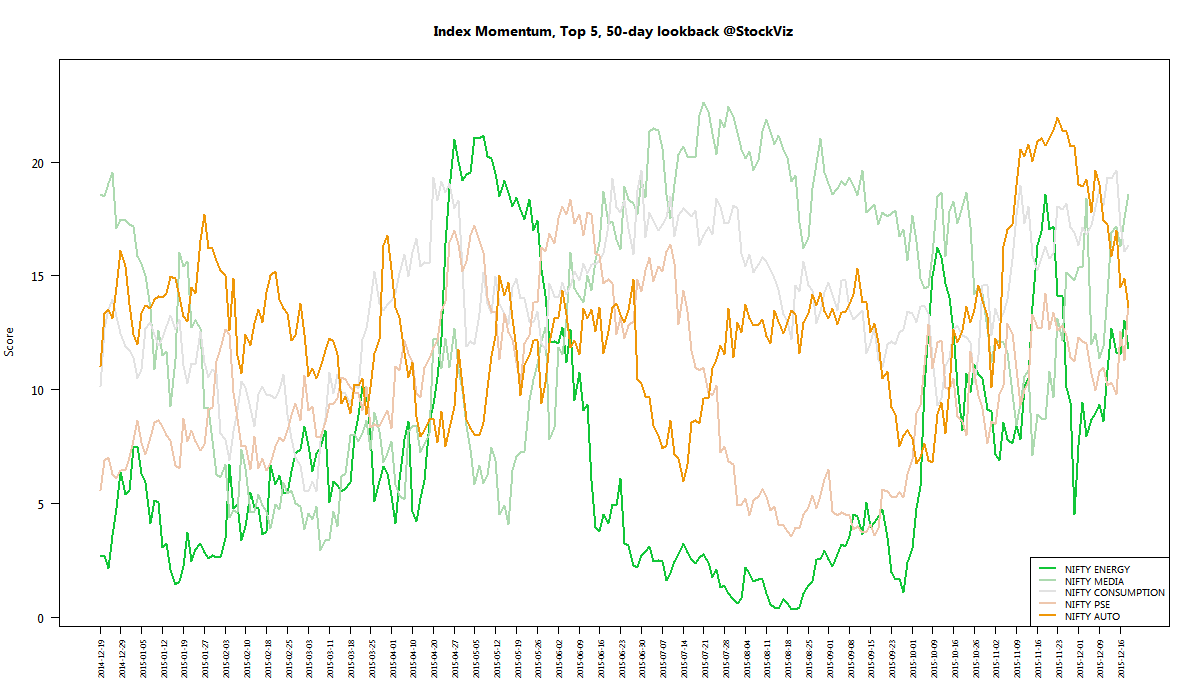
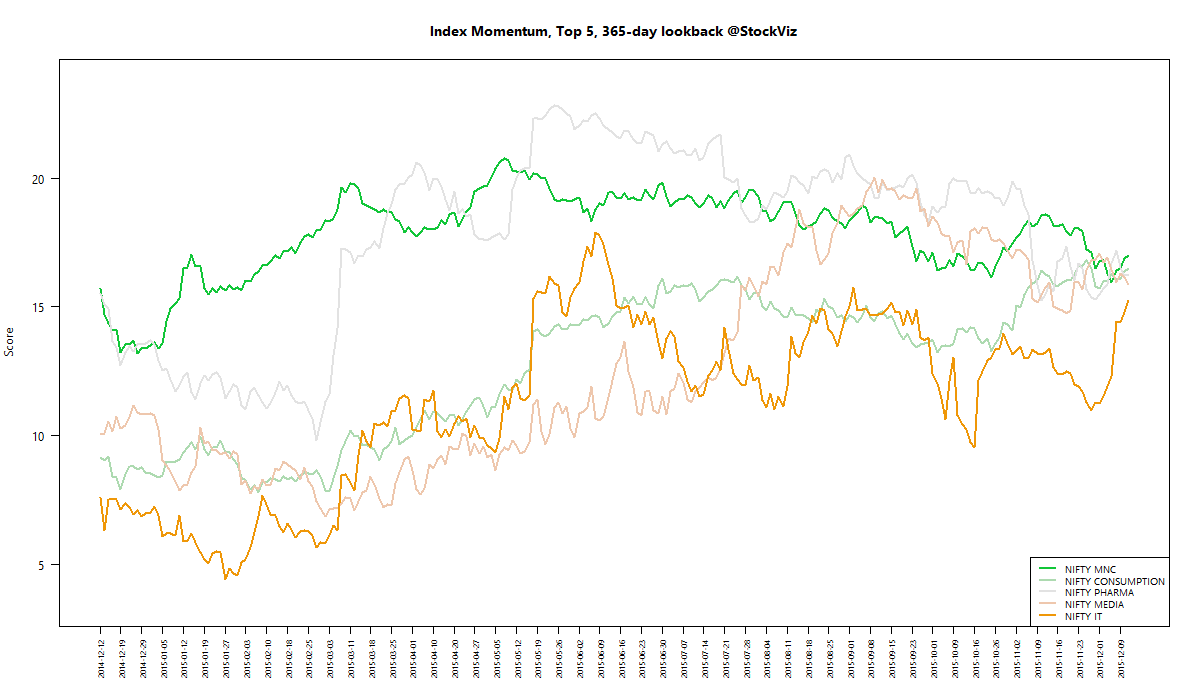
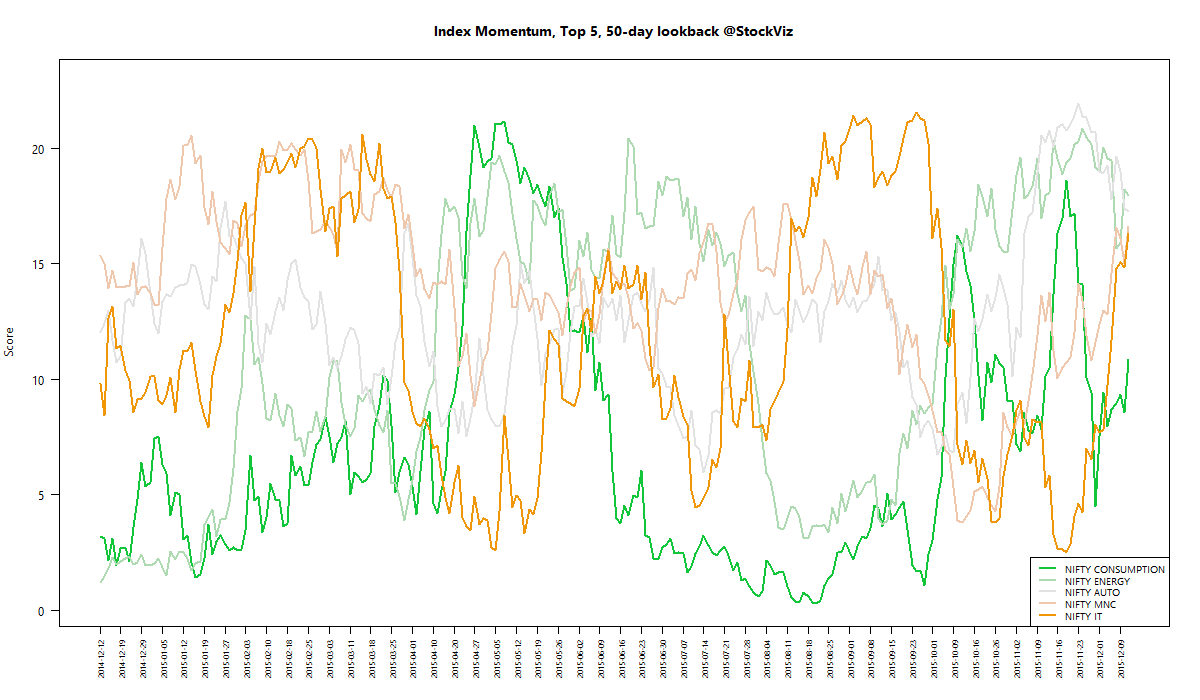
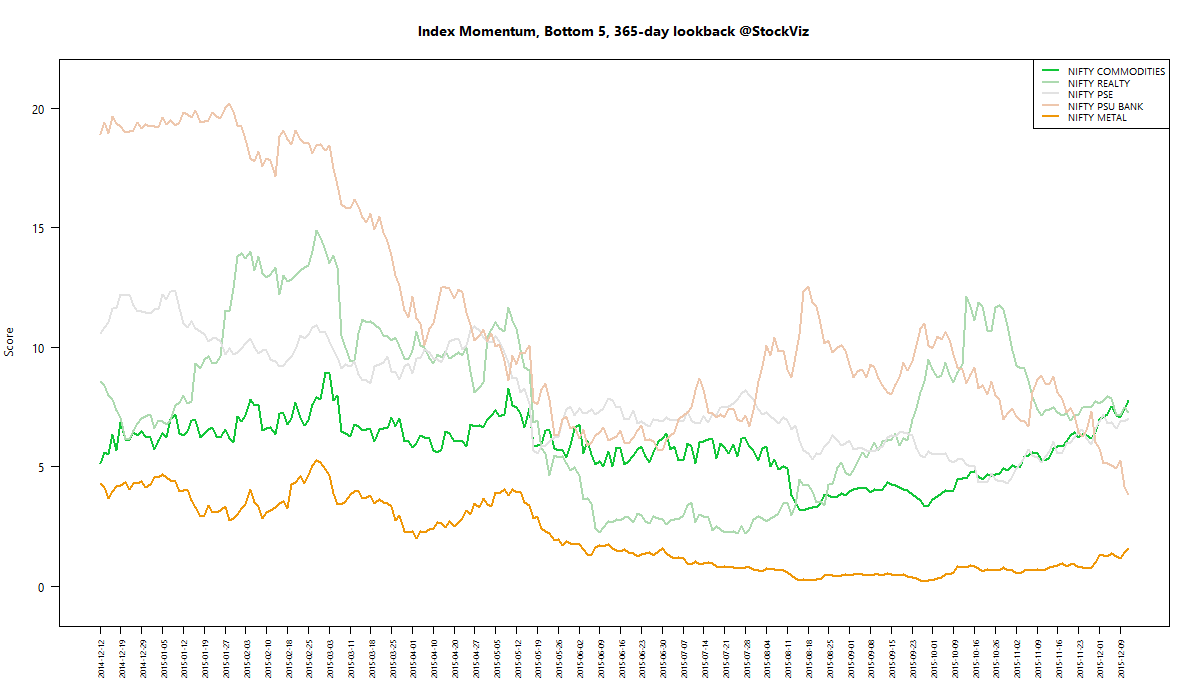
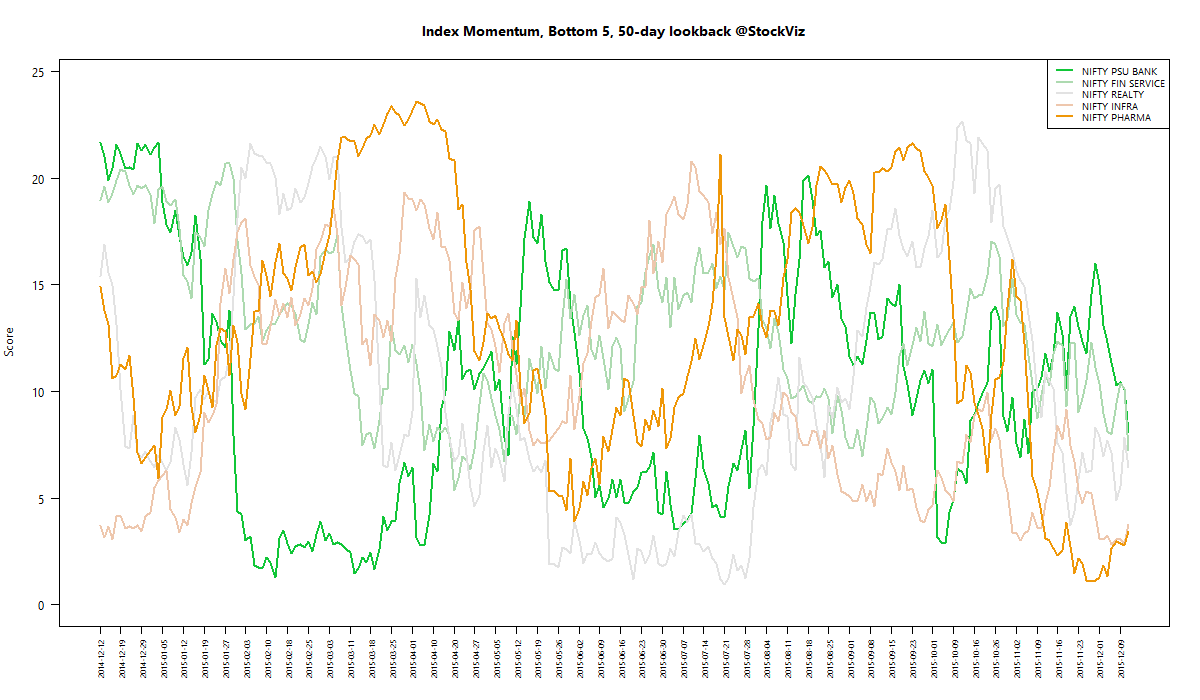
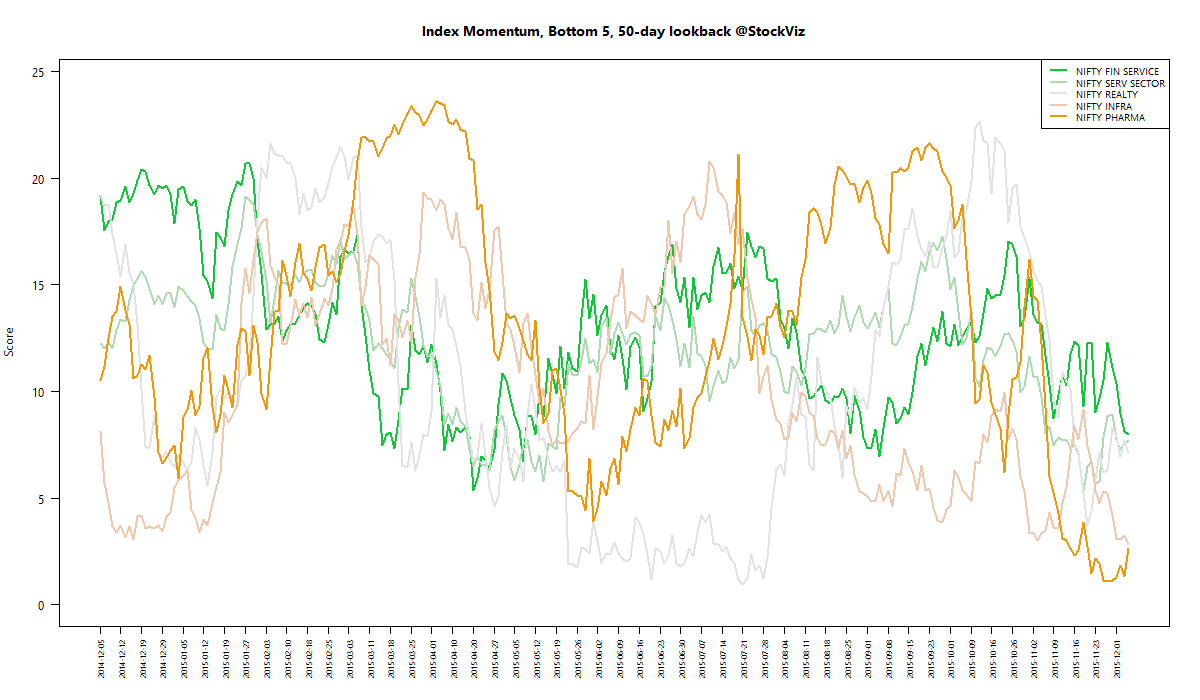
Investment Theme Performance
| Momentum | +45.89% |
| Financial Strength Value | +43.02% |
| Quality to Price | +35.28% |
| Magic Formula | +16.15% |
| Low Volatility | +6.41% |
| Enterprise Yield | +6.06% |
| Balance Sheet Strength | +4.59% |
| Tactical CNX 100 | -1.10% |
| High Beta | -30.34% |
Most investment strategies came out ahead…
Equity Mutual Funds
Bond Mutual Funds
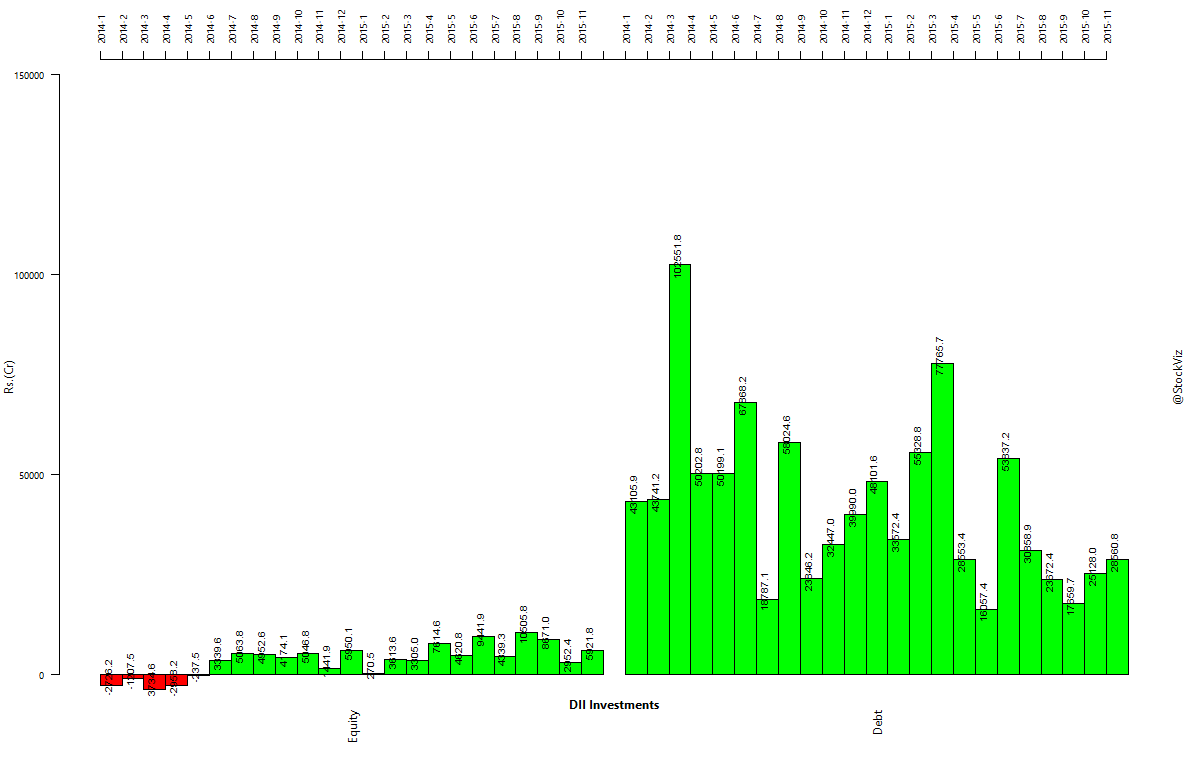
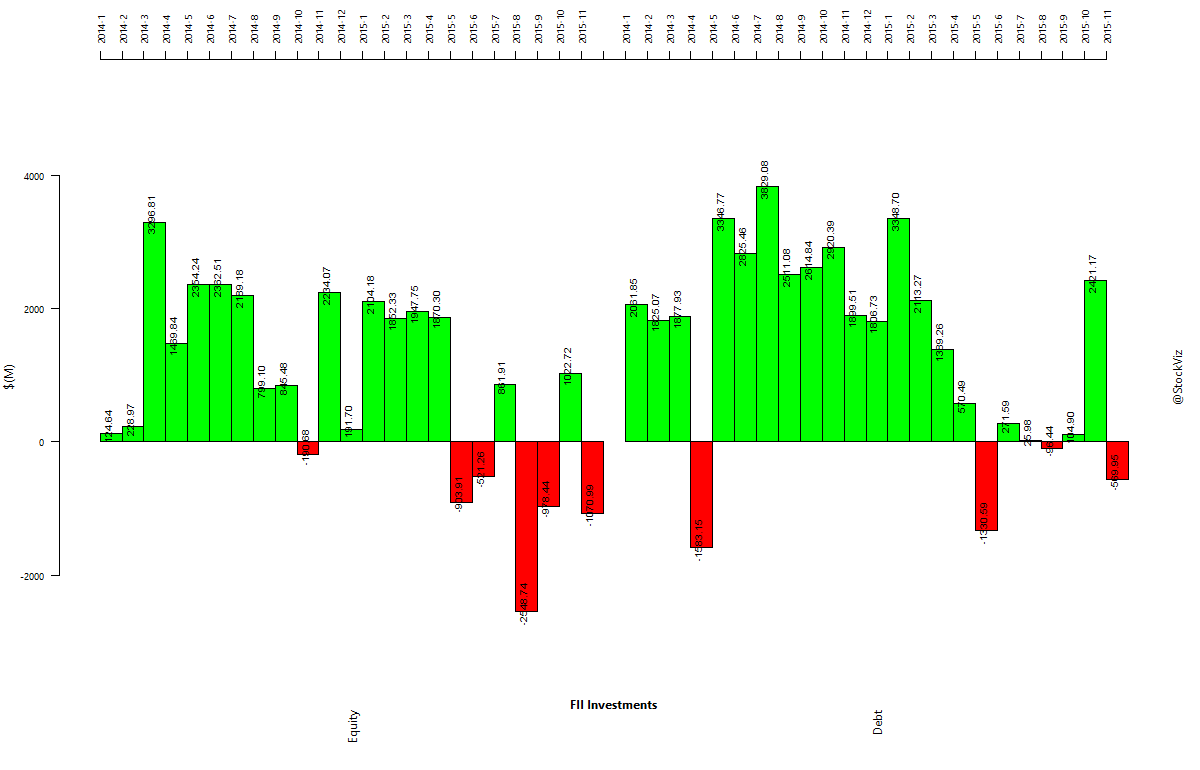
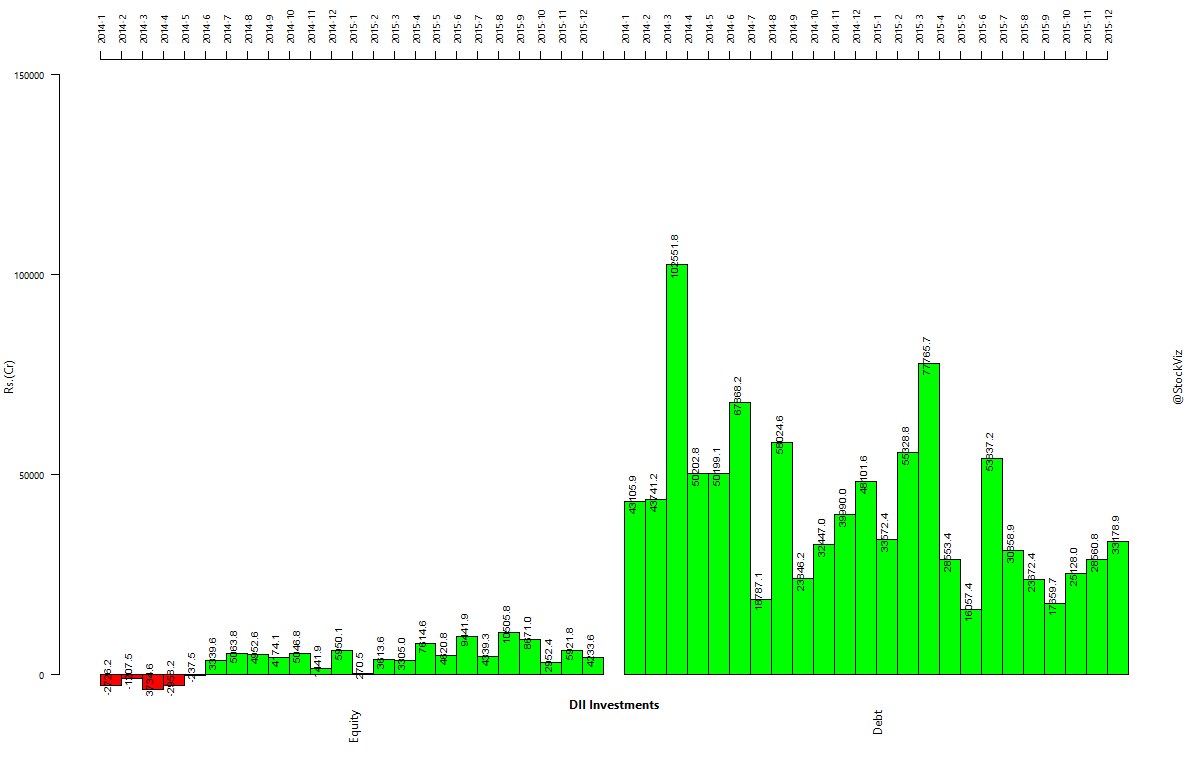
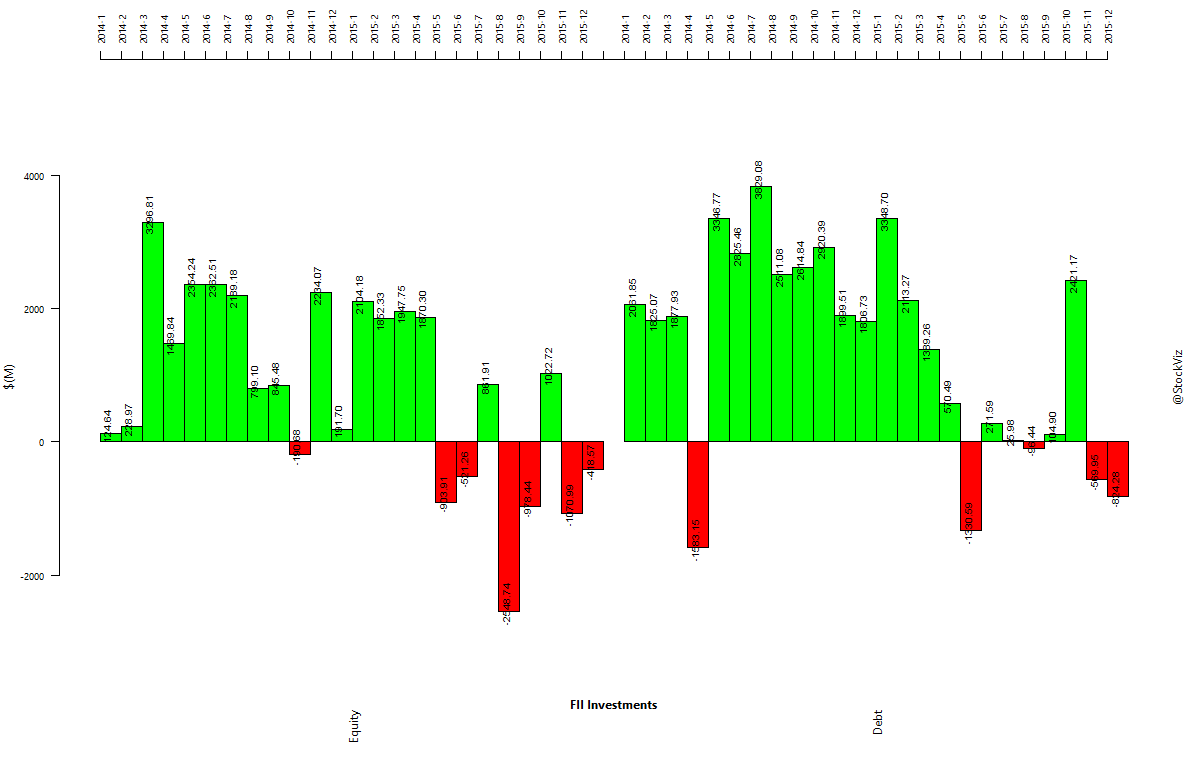
Institutional fund flows
Commentary
It was a year that saw record inflows of retail money into mutual funds and record outflow of foreign investors out of Indian markets. There were taper tantrums, Greece, GST #fail and so many worries. But the systematic and patient investor was rewarded for keeping a cool head.