Category: Your Money

Theme: Momentum Update 08.08.2016

held since returns (%)
COSMOFILMS
2016-Feb-02
+10.93
HIMATSEIDE
2016-Apr-04
+29.59
TRIVENI
2016-Apr-04
+16.24
MINDAIND
2016-Jun-08
+0.42
APLAPOLLO
2016-Jun-08
+1.41
NEULANDLAB
2016-Jun-08
+9.21
RUSHIL
2016-Jun-08
-8.30
GHCL
2016-Jun-08
+40.50
MANAPPURAM
2016-Jun-08
+50.13
MEGH
2016-Jun-08
+17.39
A2ZINFRA
2016-Jun-08
+47.24
LUMAXIND
2016-Jul-04
+4.67
KIRIINDUS
2016-Jul-04
-8.42
TIRUMALCHM
2016-Jul-04
+12.19
BALAMINES
2016-Jul-04
+8.28
GNFC
2016-Jul-04
-8.21
TRIGYN
2016-Jul-04
-16.24
PTL
2016-Jul-04
-1.10
BODALCHEM
2016-Jul-04
-0.67
PRICOL
2016-Jul-04
+38.99
Since the last rebalance on 2016-Jul-04 till 2016-Aug-05, this strategy has returned +1.73%

You can find more details about the Momentum Theme here.

Monthly Recap: Jumpin’ July

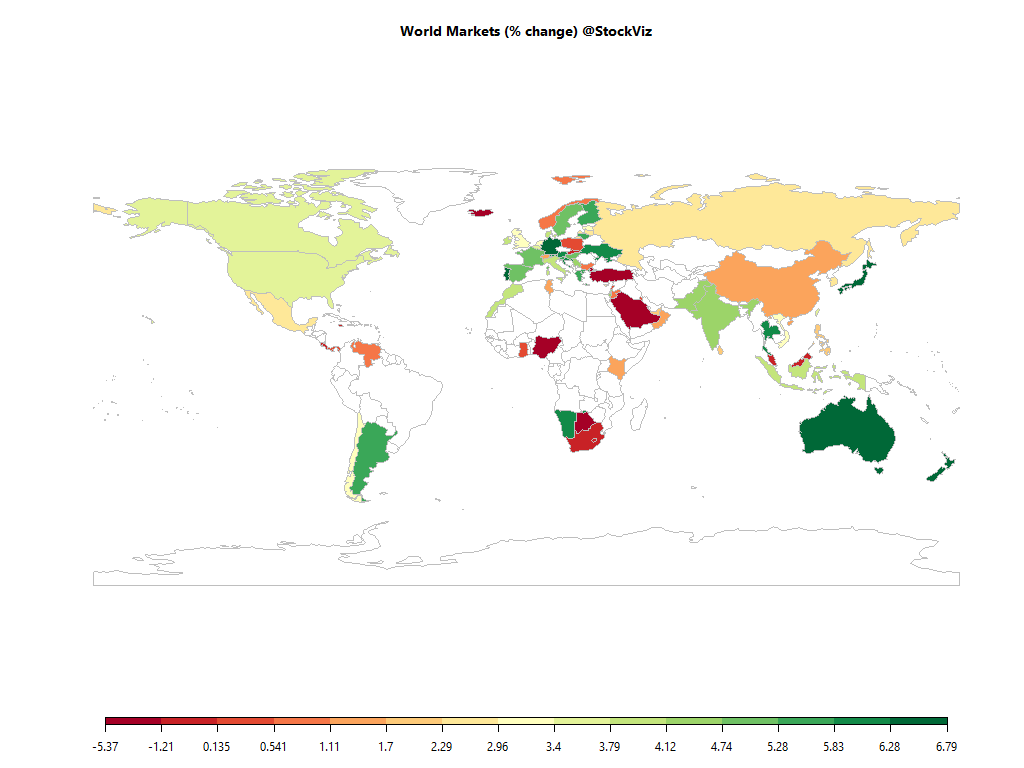
world.2016-06-30.2016-07-29

Equities

Major
DAX(DEU) +6.79%
CAC(FRA) +4.77%
UKX(GBR) +3.38%
NKY(JPN) +6.38%
SPX(USA) +3.77%
MINTs
JCI(IDN) +3.97%
INMEX(MEX) +2.86%
NGSEINDX(NGA) -5.36%
XU030(TUR) -2.19%
BRICS
IBOV(BRA) +11.06%
SHCOMP(CHN) +1.70%
NIFTY(IND) +4.23%
INDEXCF(RUS) +2.83%
TOP40(ZAF) -0.13%

Commodities

Energy
RBOB Gasoline -13.15%
Brent Crude Oil -12.87%
Heating Oil -12.58%
WTI Crude Oil -16.00%
Ethanol -12.08%
Natural Gas -2.46%
Metals
Platinum +12.24%
Palladium +18.96%
Copper +1.83%
Gold 100oz +2.68%
Silver 5000oz +7.49%

Currencies

USDEUR:-0.97% USDJPY:-1.17%

MINTs
USDIDR(IDN) -0.74%
USDMXN(MEX) +2.62%
USDNGN(NGA) +14.05%
USDTRY(TUR) +3.74%
BRICS
USDBRL(BRA) +1.33%
USDCNY(CHN) -0.20%
USDINR(IND) -0.78%
USDRUB(RUS) +3.20%
USDZAR(ZAF) -5.90%
Agricultural
Cocoa -3.70%
Coffee (Arabica) +1.36%
Coffee (Robusta) +9.31%
Soybeans -12.32%
Cattle -5.67%
Lean Hogs -16.43%
Lumber +4.36%
Cotton +17.31%
Feeder Cattle -2.56%
Orange Juice -1.21%
Soybean Meal -13.91%
Corn -7.81%
Sugar #11 -6.04%
Wheat -5.16%
White Sugar -5.14%

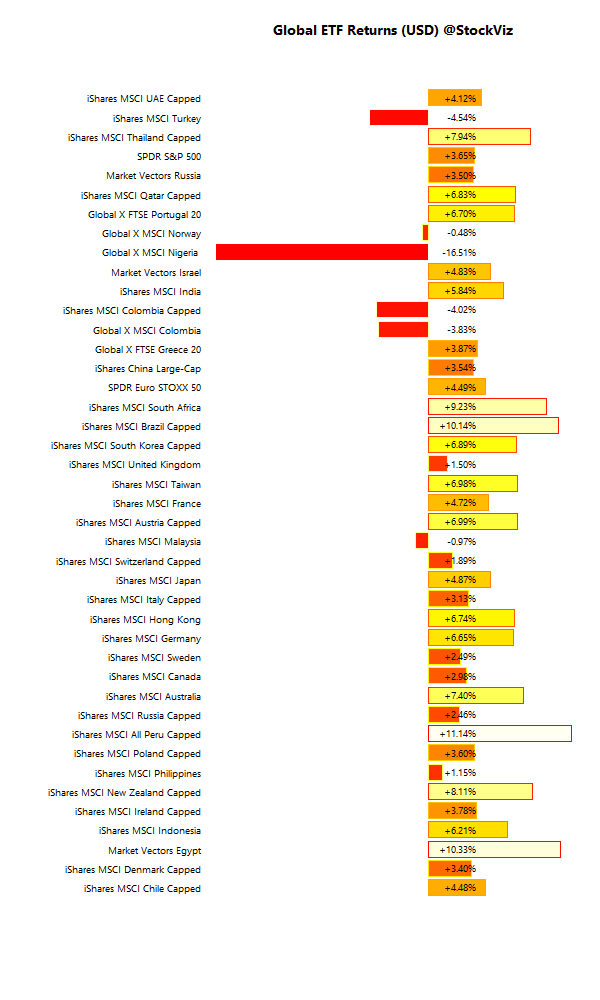
International ETFs (USD)

global.etf.performance.2016-06-30.2016-07-29

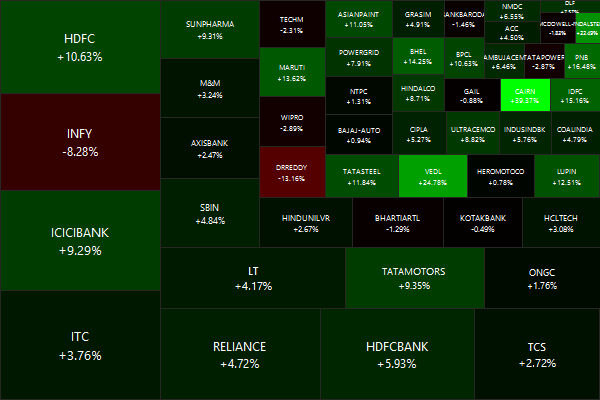
Nifty Heatmap

NIFTY 50.2016-06-30.2016-07-29

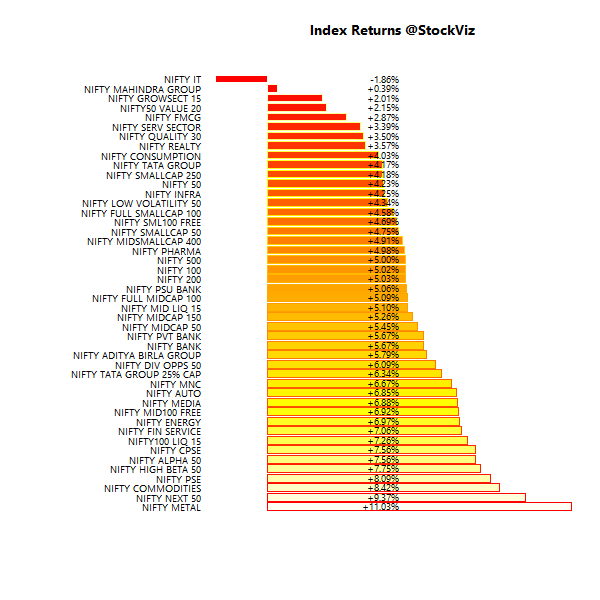
Index Returns

index.performance.2016-06-30.2016-07-29
More: Sector Dashboard

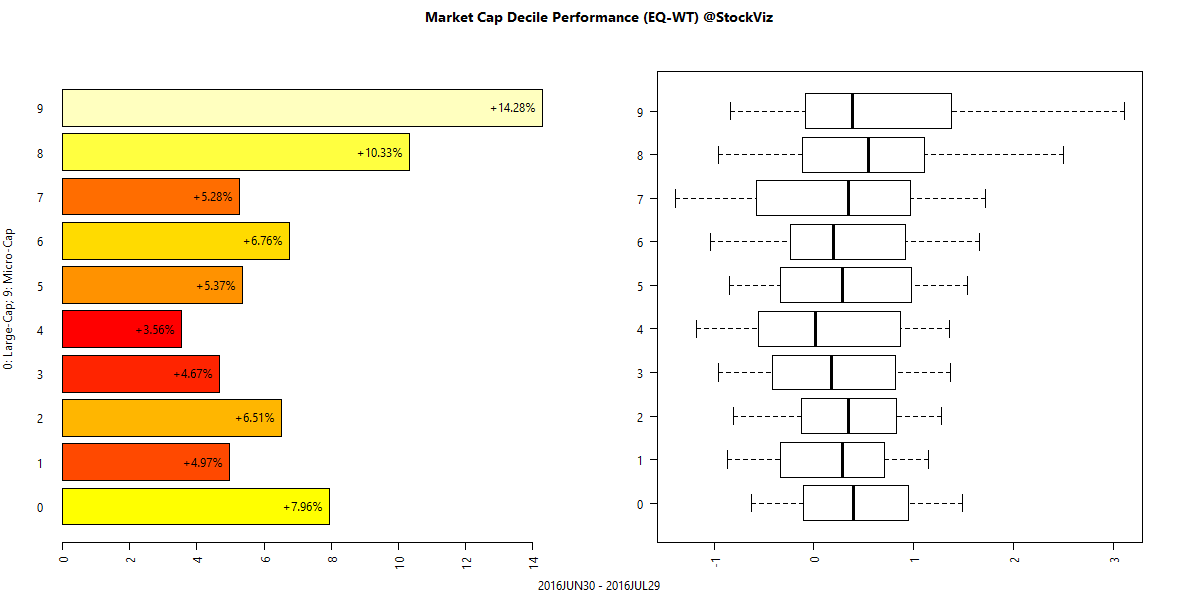
Market Cap Decile Performance

deciles.perf.2016-07-29
More: Equal-Weight Deciles, Cap-Weight Deciles

ETF Performance

JUNIORBEES +9.46%
CPSEETF +7.74%
BANKBEES +5.73%
PSUBNKBEES +4.86%
NIFTYBEES +4.54%
INFRABEES +4.39%
GOLDBEES +0.68%
CPSE ETF found a bid? Is this a dash-for-trash rally?

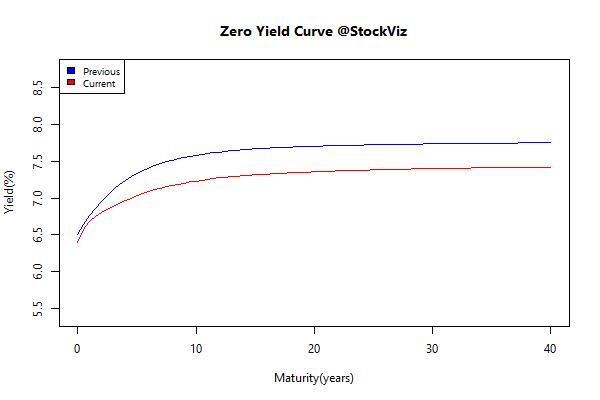
Yield Curve

yieldCurve.2016-06-30.2016-07-29

Bond Indices

Sub Index Change in YTM Total Return(%)
0 5 -0.24 +1.35%
5 10 -0.35 +2.45%
10 15 -0.33 +3.04%
15 20 -0.34 +3.71%
20 30 -0.34 +4.59%
The biggest story of this year is long-term bonds returning 4.5% in a month!

Investment Theme Performance

Will automated (momo) momentum strategies outperform their hand-crafted cousins? Interesting days ahead…

Equity Mutual Funds

Bond Mutual Funds

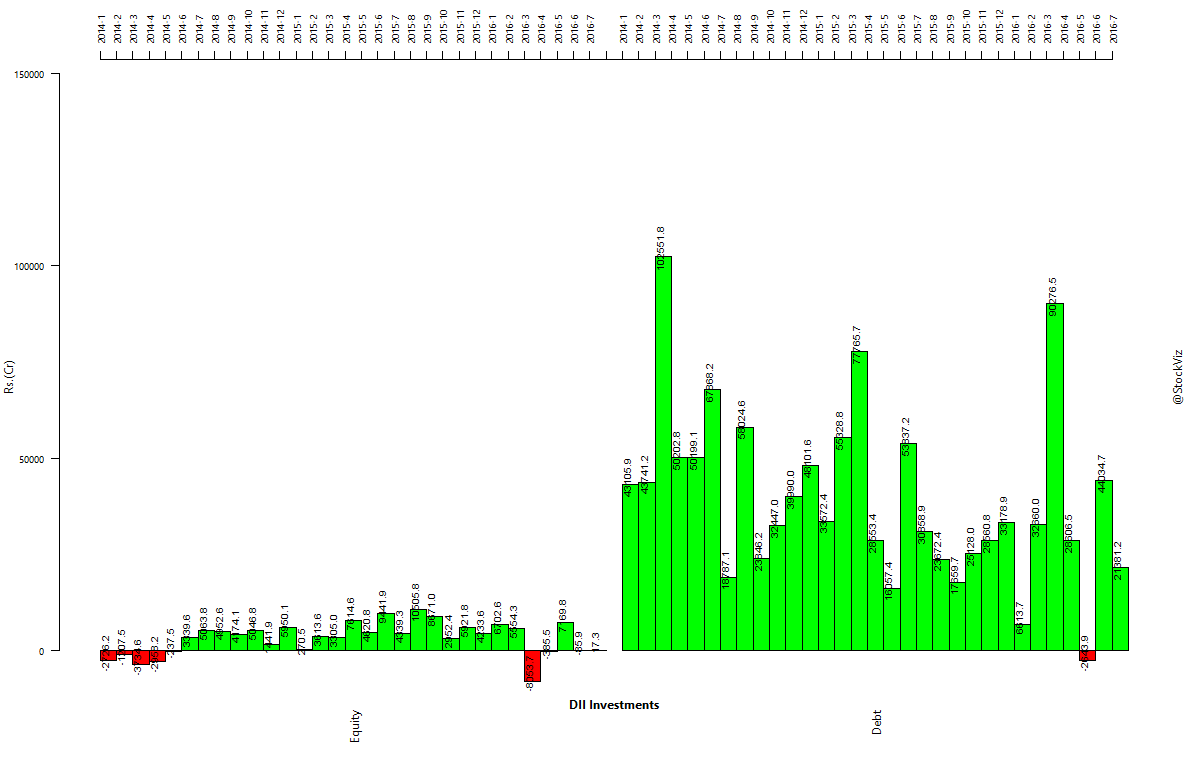
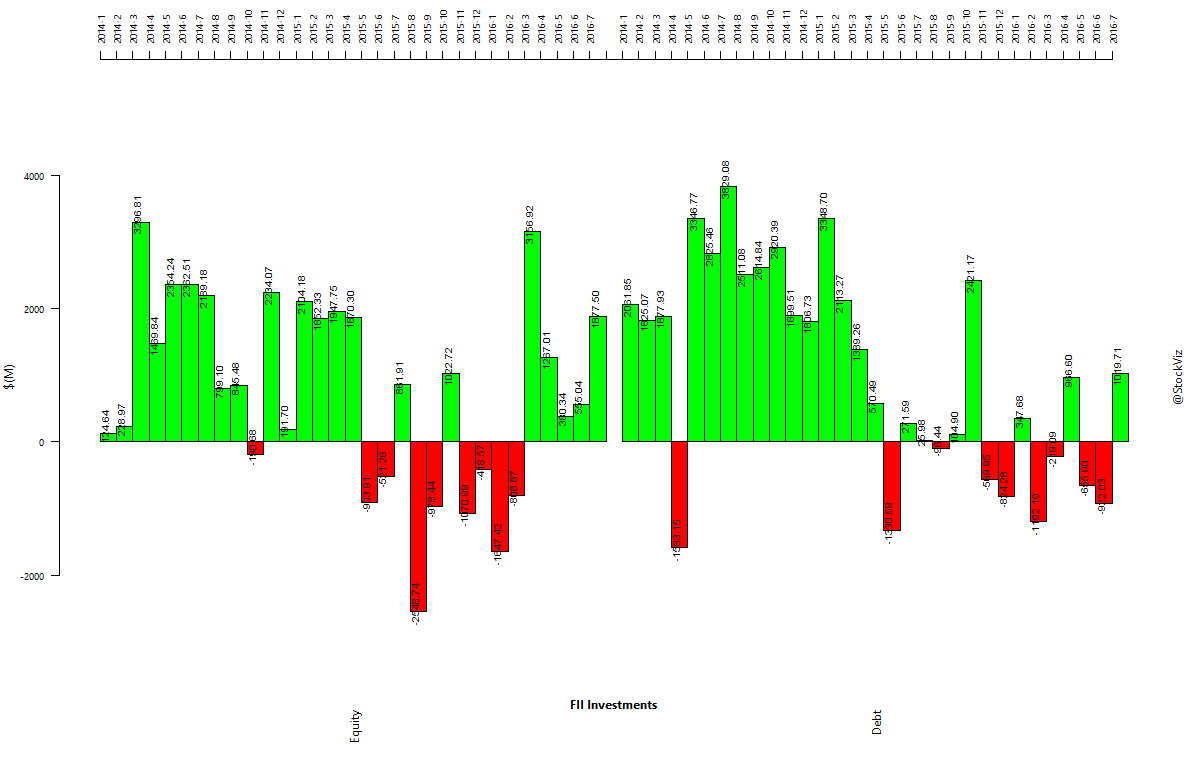
Institutional Flows

Bond inflows nowhere close to what occurred in March…

dii-investments.2014-01-01.2016-07-29

fii-investments.2014-01-01.2016-07-29

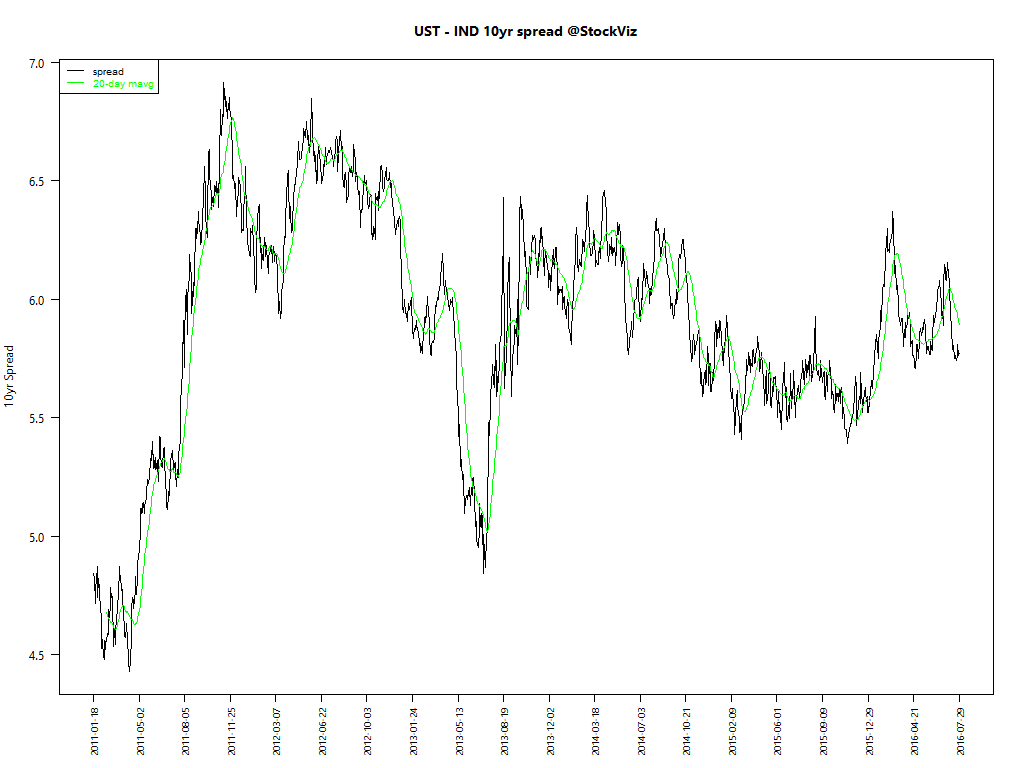
US Treasuries vs. Indian Gilts

More room for Indian Gilts to rally?
ust-ind-10yr-spread.2014-01-01

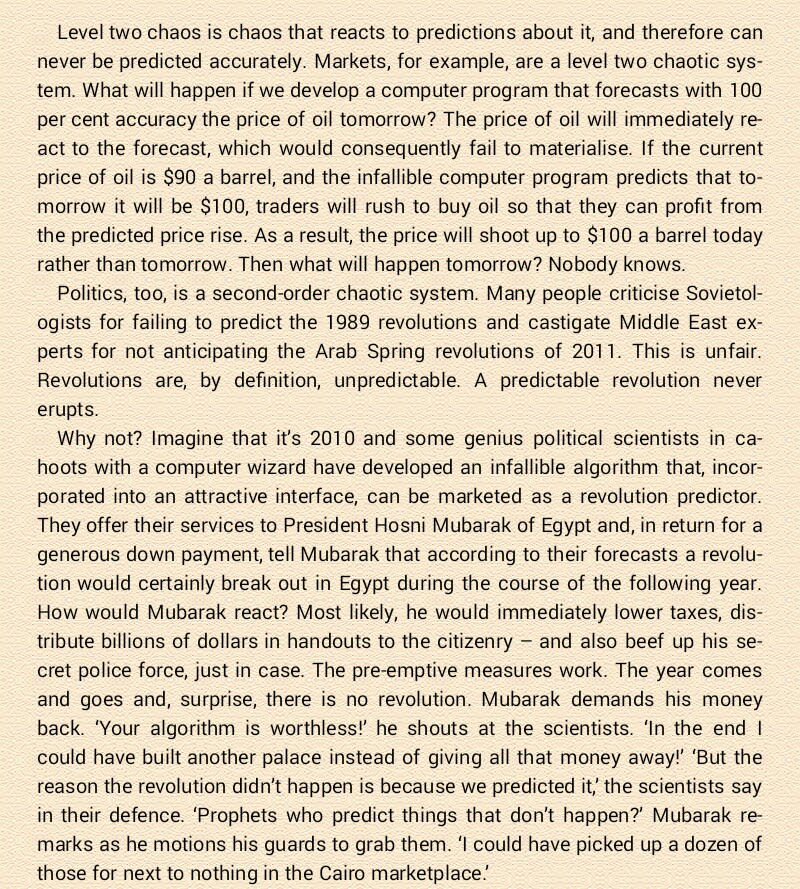
Book of the month

Sapiens: A Brief History of Humankind (Amazon)

_20160731_090441

Doodh Ka Doodh Pani ka Pani

Recommendations on Media

Analysts, brokers and pundits often appear on financial media with a ready list of stocks that investors should buy. Some of them are collated into lists by the Economic Times, Money Control, etc. We turn these lists into equally weighted portfolios and track them. We call them Doodh Ka Doodh Pani ka Pani.

Doodh ya Pani?

We look at 260 trading days worth of returns of these portfolios and compare them with NIFTY and MIDCAP 100 FREE returns during the same time period. 260 trading days approximates to one calendar year — a tax-free holding period and an upper limit of an average retail investor’s patience with investment tips.

Analyst Theme Created # stocks Nifty Returns MidCap Returns Analyst Returns Out perf. Wrt. MidCap
CS Midcap 28-Aug-2013
2013Aug29
10
50.61
78.67
126.56
47.88
Exporters – ET 2013-09-04
2013Sep04
10
46.27
70.81
71.65
0.84
Prabhudas Lilladher Midcap 10-Sept-2013
2013Sep10
8
34.74
65.09
105.12
40.02
Prabhudas Lilladher Largecap 13-Sept-2013
2013Sep13
15
36.06
63.04
41.15
-21.89
Bharat
2013Oct07
13
41.18
66.12
47.48
-18.65
Microsec’s Diwali picks – 2013
2013Nov01
9
35.16
63.66
45.71
-17.95
Globe’s Diwali picks – 2013
2013Nov01
10
35.16
63.66
44.51
-19.14
Prabhudas Lilladher’s Diwali picks – 2013
2013Nov02
5
36.53
64.02
61.71
-2.31
Kotak’s Diwali picks – 2013
2013Nov04
11
36.53
64.02
63.41
-0.61
Emkay 2013-11-12
2013Nov12
9
38.59
65.21
119.78
54.57
Ashwani Gujral 2013-11-12
2013Nov12
5
38.59
65.21
173.85
108.64
Sharekhan 15-Nov-2013
2013Nov15
11
32.88
60.08
30.37
-29.71
UBS 2013-12-04
2013Dec04
9
34.44
64.19
94.21
30.03
Morgan Stanley Fragmented Election 2013-12
2013Dec06
12
34.11
63.52
33.24
-30.28
Morgan Stanley Strong Election 2013-12
2013Dec06
13
34.11
63.52
29.55
-33.97
Merrill 2014
2013Dec12
10
33.50
65.36
122.21
56.85
Espirito Santo Silver Bullets 2013-12-26
2013Dec26
7
38.49
62.25
54.96
-7.28
IIFL Micaps for 2014 2013-12-27
2013Dec27
10
38.26
61.32
86.04
24.72
SMC 2013-12-28
2013Dec28
10
39.27
62.15
59.22
-2.93
Religare Top 4 for 2014
2014Jan01
4
41.40
61.99
58.37
-3.62
Macquarie – Midcaps 2014-01-21
2014Jan21
5
39.53
67.20
97.08
29.88
Mitesh Thacker Midcaps 2014-1-30
2014Jan30
10
42.97
74.34
55.54
-18.80
Dolat Capital’s 10 Hidden Gems 2014-02
2014Feb27
10
32.90
63.58
43.24
-20.34
Prabhudas Lilladher’s LargeCap Picks 2014-03
2014Mar21
10
30.11
58.61
30.01
-28.60
ET Top Midcap 2014-03
2014Mar21
10
30.11
58.61
77.74
19.13
ET 2014-04
2014Apr10
10
20.53
41.41
47.66
6.24
Religare Retail Lucky 13 mid-cap redux
2014May06
13
23.88
47.47
48.49
1.02
Nomura 2014-04
2014May06
11
23.88
47.47
52.66
5.18
Religare Retail Lucky 13 mid-cap redux
2014May06
13
23.88
47.47
71.38
23.91
Sharekhan 20 midcaps 2014-05
2014May21
20
10.06
23.15
24.99
1.83
Microsec Agri 2014-06
2014Jun30
10
13.43
23.13
27.99
4.86
Lucky 13 2014-07
2014Jul02
16
10.31
19.73
24.04
4.30
Hidden Gems 2014-08
2014Aug25
7
-0.43
16.06
48.18
32.12
Globe Diwali Picks 2014
2014Oct22
11
-2.66
12.41
-17.22
-29.63
Kotak Diwali Picks 2014
2014Oct22
9
-2.66
12.41
14.36
1.95
ET Diwali Picks 2014
2014Oct22
10
-2.66
12.41
-1.88
-14.29
SPA stock bets 2014-11
2014Nov24
16
-10.07
5.64
-23.78
-29.42
ET Top 10 Dec-2014
2014Dec22
10
-8.68
8.03
-6.34
-14.37
Beg Borrow Steal
2015Jan06
7
-8.67
-0.85
-33.05
-32.20
CLSA 9 for 2015
2015Jan06
8
-8.67
-0.85
-14.13
-13.28
Midcaps for 2015
2015Jan06
16
-8.67
-0.85
15.93
16.78
Espirito Santos Silver bullets Jan-2015
2015Jan12
8
-9.12
-1.37
-6.87
-5.49
Mixed bag 2015-01
2015Jan20
9
-15.05
-4.53
-29.21
-24.68
Rate Sensitive 2015-Jan
2015Feb03
15
-17.07
-8.89
-23.66
-14.77
Rail Budget 2015
2015Feb26
17
-14.09
-4.67
-26.97
-22.31
Sharekhan Top 12 April-2015
2015Apr06
12
-8.05
0.03
-2.88
-2.91
Smart City Stocks ET April-2015
2015Apr30
15
-4.87
2.75
9.00
6.25

Observations

Of the 47 lists we analyzed, the average out-performance was about +1.5% (vs. the MidCap index.)

We created two Themes out of the stocks in ‘Religare Retail Lucky 13 mid-cap redux.’ One was a minimum variance portfolio and the other one was an equal-weighted portfolio. The minimum variance portfolio out-performed the equal-weighted one. Food for thought.

Morgan Stanley had come out with two lists before the General Elections – one was supposed to do very well if Modi got elected and the other if he didn’t. Ironically, ‘Morgan Stanley Fragmented Election 2013-12’ out-performed ‘Morgan Stanley Strong Election 2013-12’ but both under-performed the Midcap Index.

Espirito Santos Silver bullets turned out to be blanks.

Kotak should do a better job with their Diwali picks.

What next?

We hope that these guys continue to put out lists so that we can track them. We admit that 47 is too small a sample to draw any conclusions. If you come across any such lists that are ‘subscription only’, i.e., not available on the ET or MC websites, please send them to info@stockviz.biz. We would love to track them all.
Investing in Micro-caps

The Size Factor

All things being equal, micro-caps outperform mega-caps in the long-run — investors are compensated for the higher systematic (business cycle) risk that they take when they invest in micro-cap stocks. One way to boost relative performance vs. a market-cap weighted index is to invest in an equal-weighted basket of stocks that are in the index. Alternately, investors can add a basket of micro-cap stocks to their portfolio to juice overall returns.

Market-cap Deciles

We had discussed how we can divide the universe of listed stocks in deciles based on their free-float market cap here. Given our ability to automate systematic investment strategies, we created an auto-rebalanced Theme each for every decile.

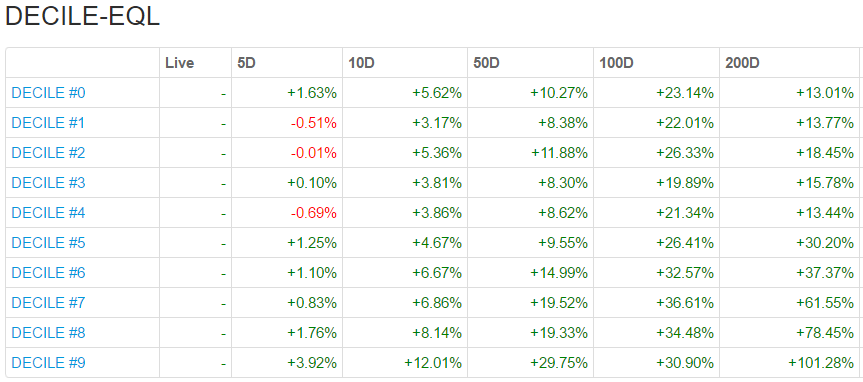
Investors can now gain exposure to an equal-weight portfolio of micro caps by investing in the Decile 9 Theme and mega-caps by investing in the Decile 0 Theme. Returns and risk go down as you climb up the market-cap ladder. Our Market Dashboard gives an idea of how returns have been distributed across the deciles:

decile returns

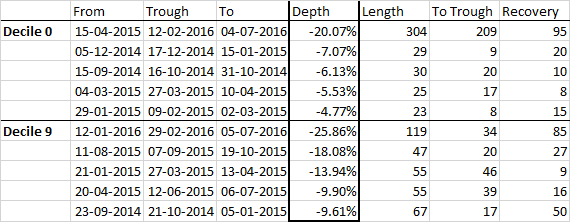
Notice how the drawdowns are deeper with micro-caps:
decile drawdown

Investors who whethered the steeper drawdowns of micro-caps have experienced returns an order of magnitude larger than mega-cap investors. Check out the ‘Size Factor’ in our Investment Themes page for other Market-cap based Themes.

Theme: Low Volatility Update 12.07.2016

held since returns (%)
WIPRO
2014-May-02
+9.04
HDFCBANK
2015-Dec-31
+10.64
CIPLA
2015-Dec-31
-14.98
COLPAL
2016-Feb-01
+8.00
HINDUNILVR
2016-Mar-04
+8.88
POWERGRID
2016-Mar-04
+20.92
INFY
2016-Apr-05
-4.10
RELIANCE
2016-Apr-05
-2.41
HCLTECH
2016-Apr-05
-12.80
OIL
2016-Apr-05
+15.96
SUNPHARMA
2016-May-09
-1.89
COALINDIA
2016-May-09
+11.01
PFIZER
2016-Jun-10
+4.84
TATAELXSI
2016-Jun-10
-5.33
ACC
2016-Jun-10
+4.49
GLENMARK
2016-Jun-10
+8.06
IGL
2016-Jun-10
+6.49
LICHSGFIN
2016-Jun-10
+9.65
CADILAHC
2016-Jun-10
+16.61
AMBUJACEM
2016-Jun-10
+10.97
Since the last rebalance on 2016-Jun-10 till 2016-Jul-11, this strategy has returned +5.31%

You can find more details about the Low Volatility Theme here.