Category: Your Money

State of PMS – November 2016

As of November this year, there are about 170 SEBI registered Portfolio Management Service providers. Until recently, their performance data was not widely available. Thanks to continued pressure from publications like MoneyLife and others, SEBI has finally published PMS details on its website. We plan to download that data and publish two key pieces of information every month:

  1. Performance diffusion – what is the range of performance put in by various PMSs.
  2. Cumulative performance – how do different PMSs compare with their cheaper mutual fund counterparts.

Monthly Performance Diffusion

On an average, there is no great benefit to investing in a PMS vs. a mutual fund. The numbers here do not include performance management fees, profit share and brokerage of PMS whereas mutual fund NAV includes everything. Plus, gains from PMSs are taxed as if it were the investor’s own trading account – with the full impact of churn – whereas mutual funds do not attract capital gains tax if held for more than a year.

pms-monthly

Cumulative Returns

What if an investor just held onto a mutual fund instead of going through a PMS?

pms-mutualfund

On an average, a PMS is unlikely to beat a large-cap mutual fund after fees and taxes.

Hopefully, SEBI keeps the performance updates going on its website. With results like this, PMSs will have a strong incentive to defy SEBI’s data collection programs. Fingers crossed!

Book Review: The Dao of Capital

The Dao of Capital: Austrian Investing in a Distorted World (Amazon,) gives an overview of Austrian economics and discusses how one can use that to invest in the markets. Excerpts are here.

Thoughts

The Austrian school of economics is very similar to Ayn Rand’s laissez-faire version of capitalism. Both do not address how the less fortunate among us are supposed to survive in their version of the world. Neither do they discuss the role of policemen in society and how they get paid.

Leaving Rand aside, the biggest beef that the Austrian school has with the current version of capitalism (based on Keynesian economics) is on the role of the central bank. They don’t see a need for it because they believe that interest rates should be set by the market, not by a top-down bureaucracy. Here, I agree with the author that the Austrian school hasn’t been able to garner enough resources to push the philosophy forward in academia. Their philosophy seems frozen in time – stuck in what Mises though in the 40’s/50’s.

Keynesian economics has had the (mis?)fortune of being widely adopted. Anything that is deployed in the real world will necessarily be modified (bastardized?) to fit ground realities. This allows people in the sidelines to profess “purity” while criticizing the mainstream.

The author then proceeds to illustrate how Austrian economic philosophy can be applied to investing, mainly along:

  1. Credit cycles
  2. Buying OTM puts
  3. Value

None of these are particularly “Austrian.” And, I call bull-shit on buying OTM puts.

First, the author’s back-test over 100 years is meaningless. There was no practical way to implement this strategy even 10 years ago, leave alone 100. Until recently, the brokerage along would have eaten away whatever profits one might have had.

Second, it is a costly bet to go long volatility even if the world does blow up. In the low volatility decile, in order to break even on a protective put strategy with 5% out-of-the-money options, a 1987-type black swan would have to occur every 21 years. (AA)

Overall, the book was useful in filling some gaps in my knowledge of economic history. It also highlighted the need to formally keep track of the credit cycle in major economies and our own.

Investing in Gold

The almighty dollar

Although India and China account for a bulk of world gold consumption, the price of gold continues to be set in London and New York. When you buy gold in India, you are exposed to two things:

  1. The dollar price of gold.
  2. The USD/INR exchange rate.

Even at times when the price of gold goes down in dollar terms, if the rupee goes down more, then you still have a profit in your hands. This partly explains why Indians are crazy about gold – it is the easiest way to get short the rupee.

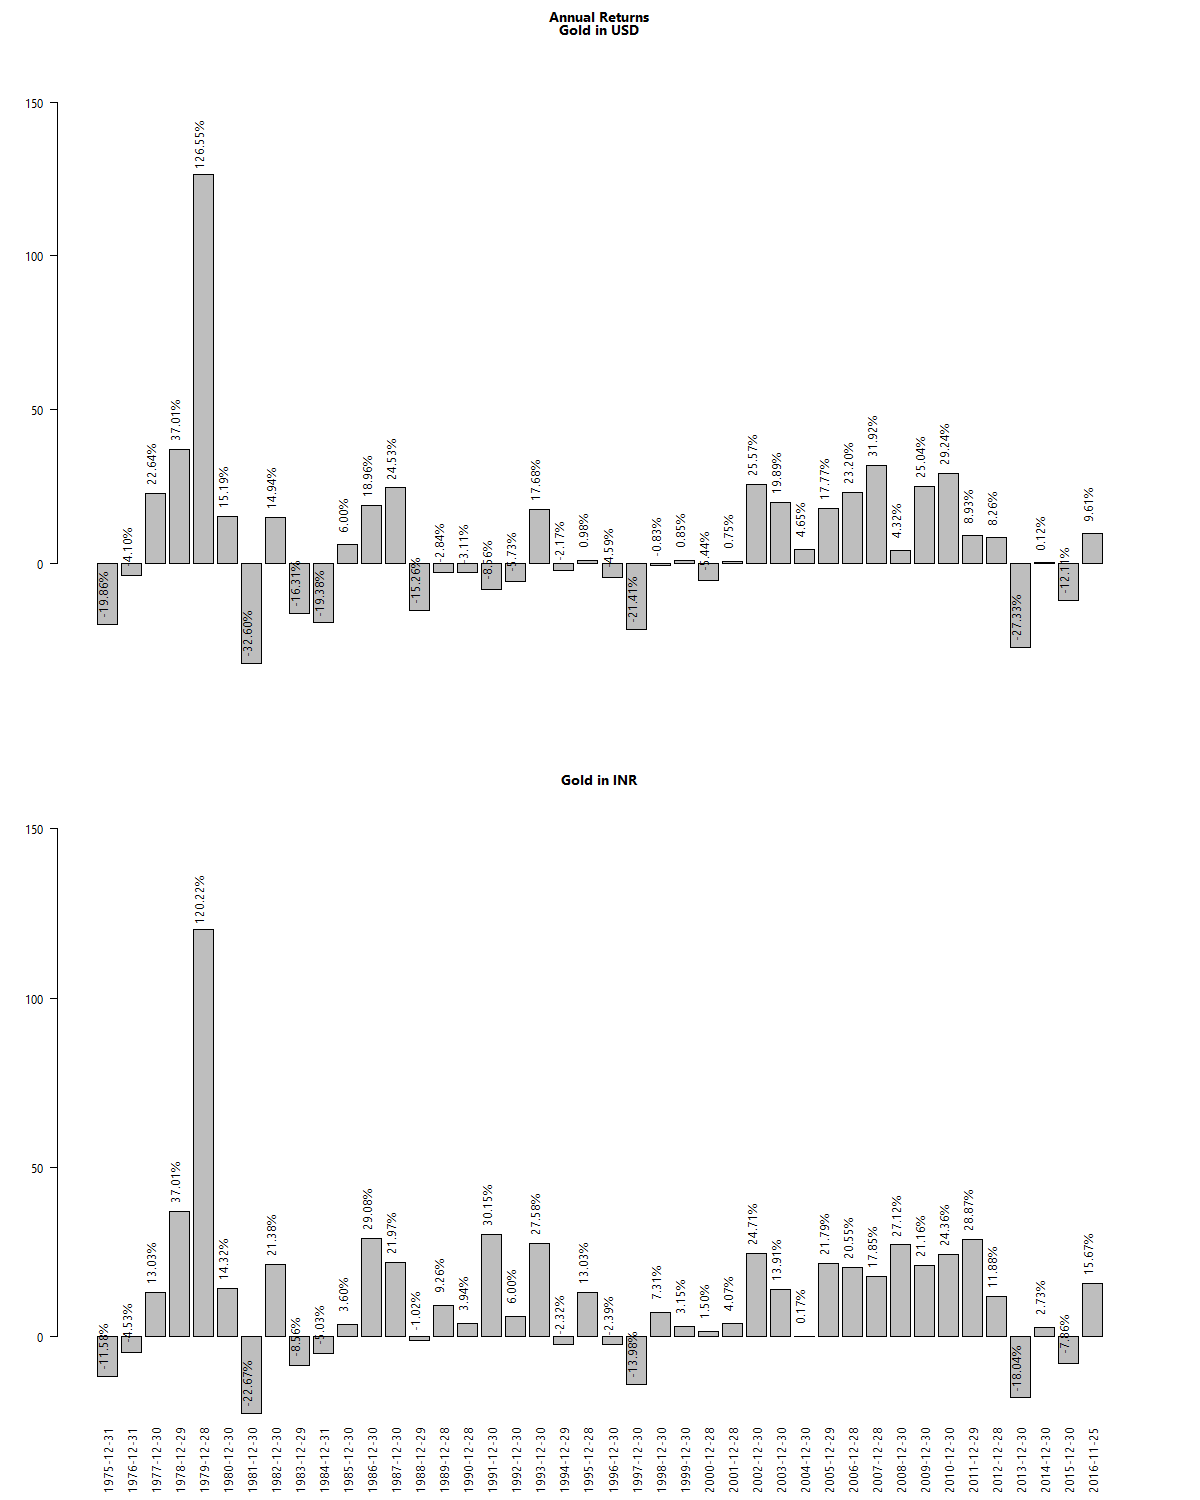
Dollar returns of gold

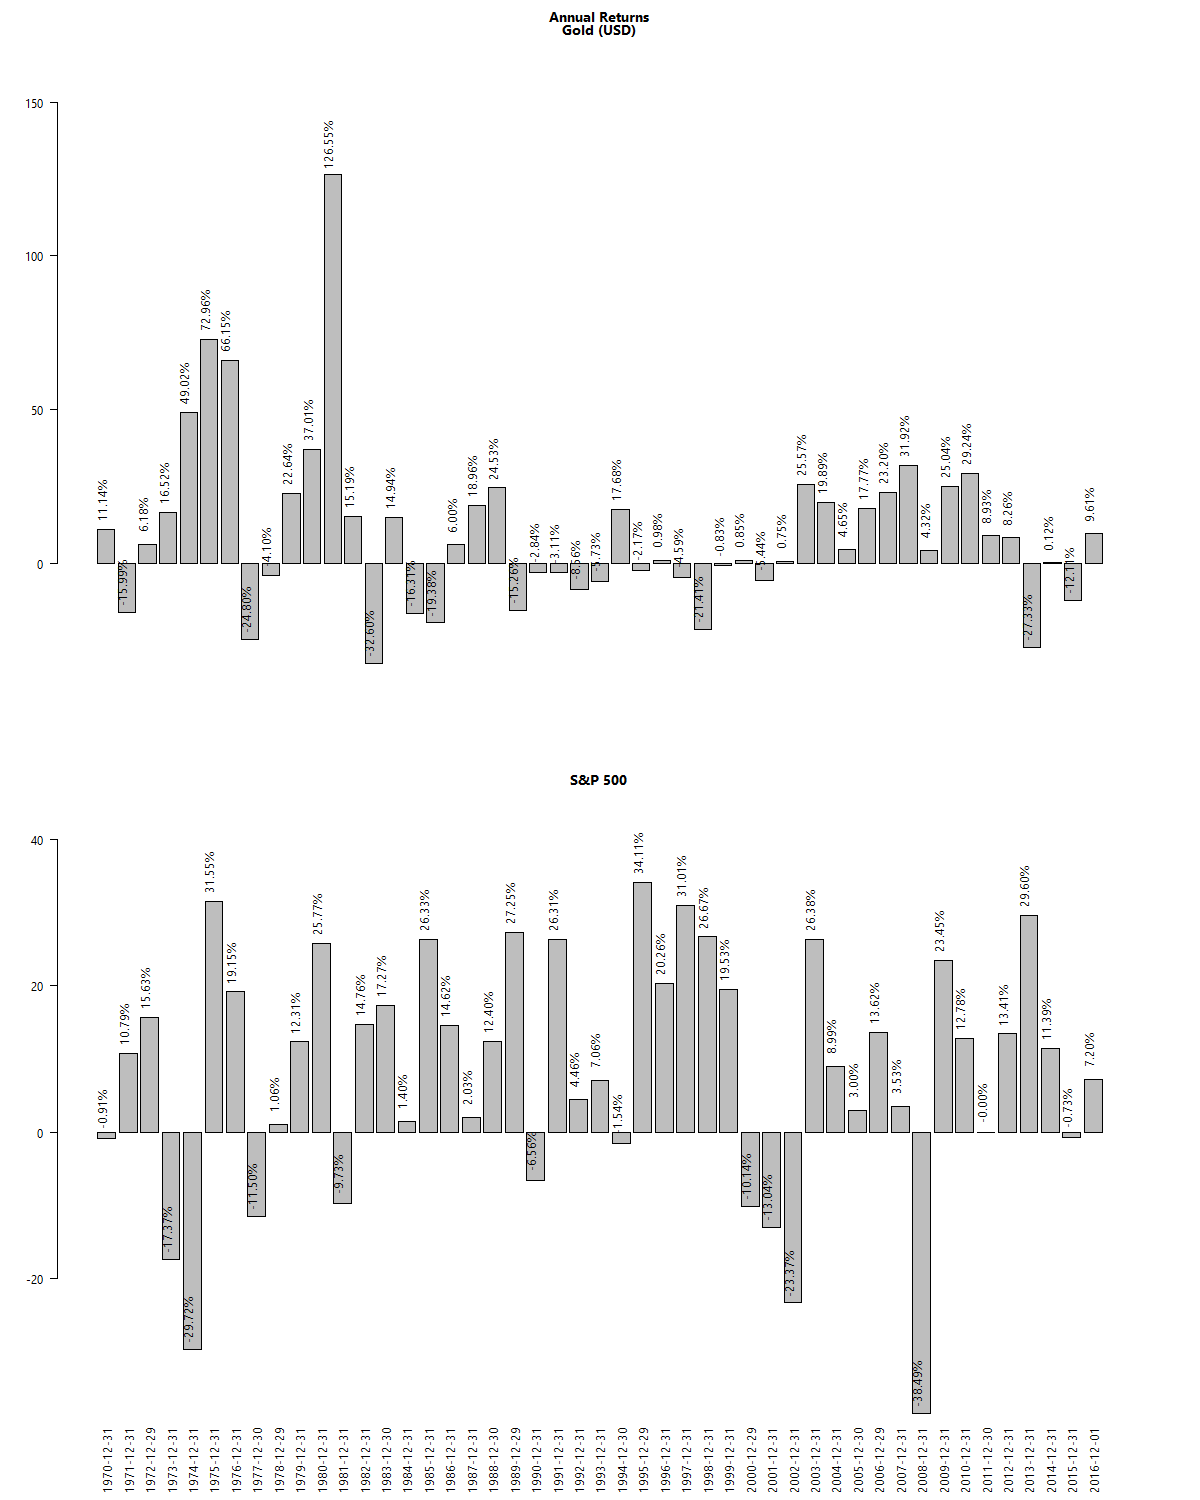
If you look at the returns of the S&P 500 vs. gold since 1970’s, gold comes out a winner.

gold-sp500-usd

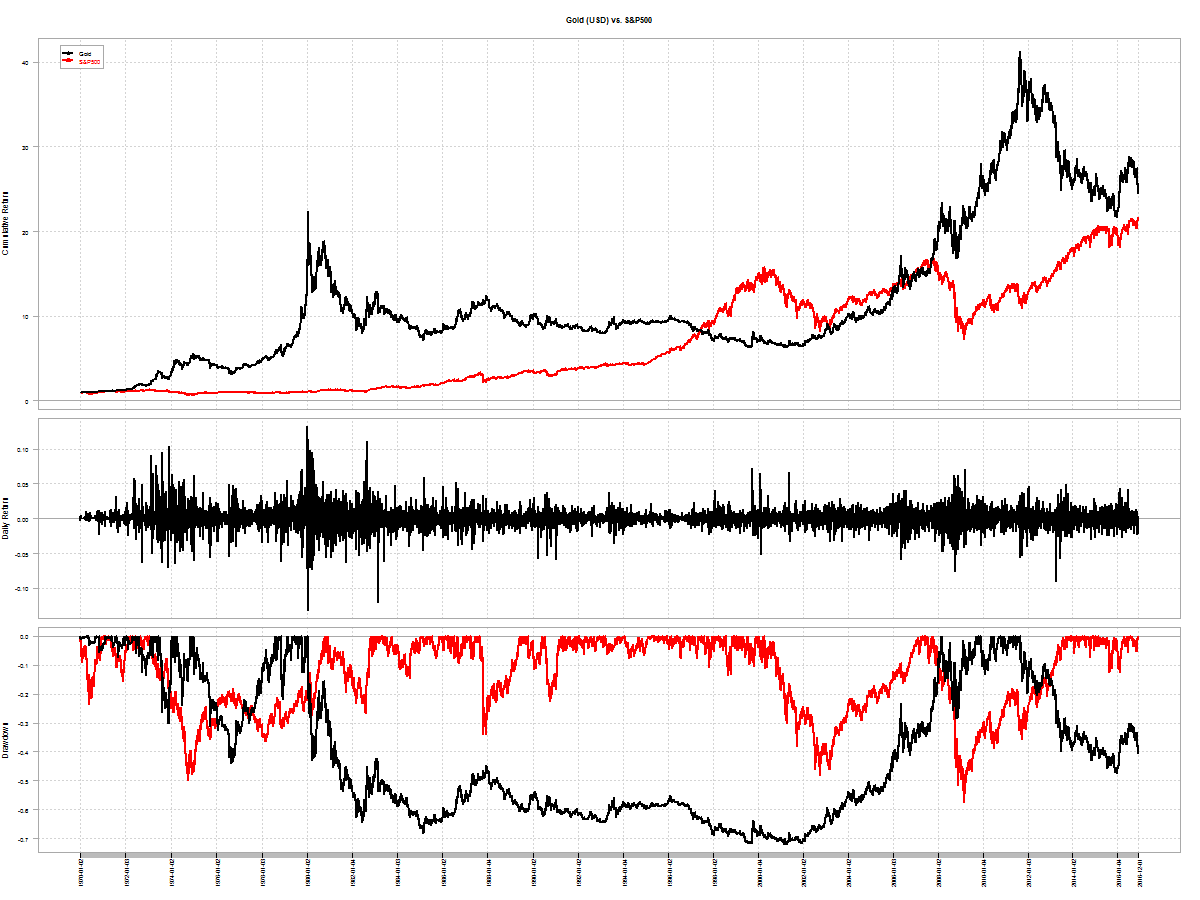
Not to say that it was easy to own. Gold peaked in the 80’s and remained out of favor till 2008!

gold-sp500-usd-annual

Rupee depreciation

The dollar returns of gold is only a small part of the story. The bigger picture here is that of rupee depreciation. Let us see how USDINR compares with USD vs. a board basket of currencies:

inr-usd

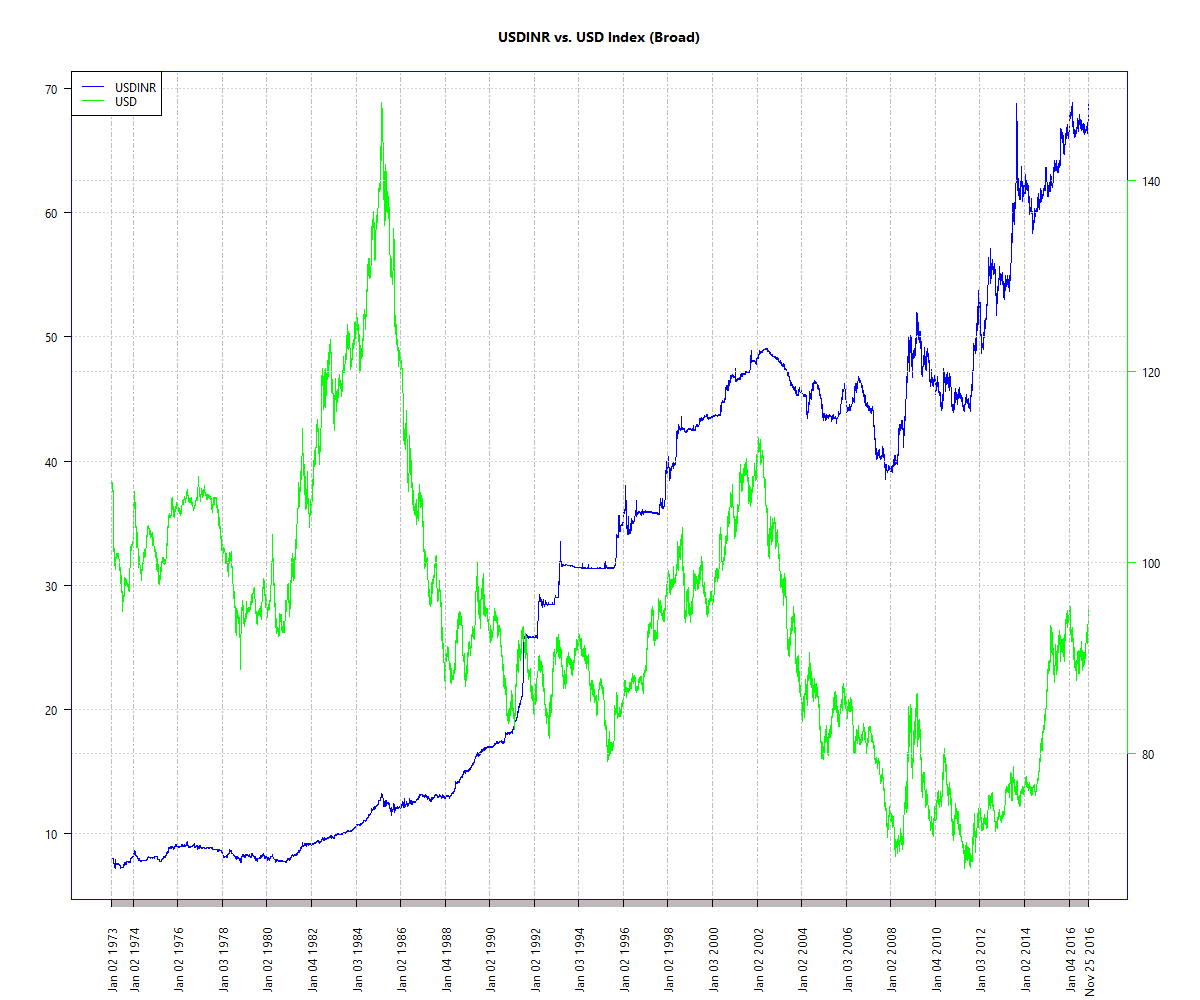
See the blue line? That is how much the US Dollar has appreciated against the rupee. The green line is the dollar vs. other currencies with which America does business with.

With this in mind, let’s compare the returns from gold in USD vs. gold in INR:

gold-inr-usd-cumulative

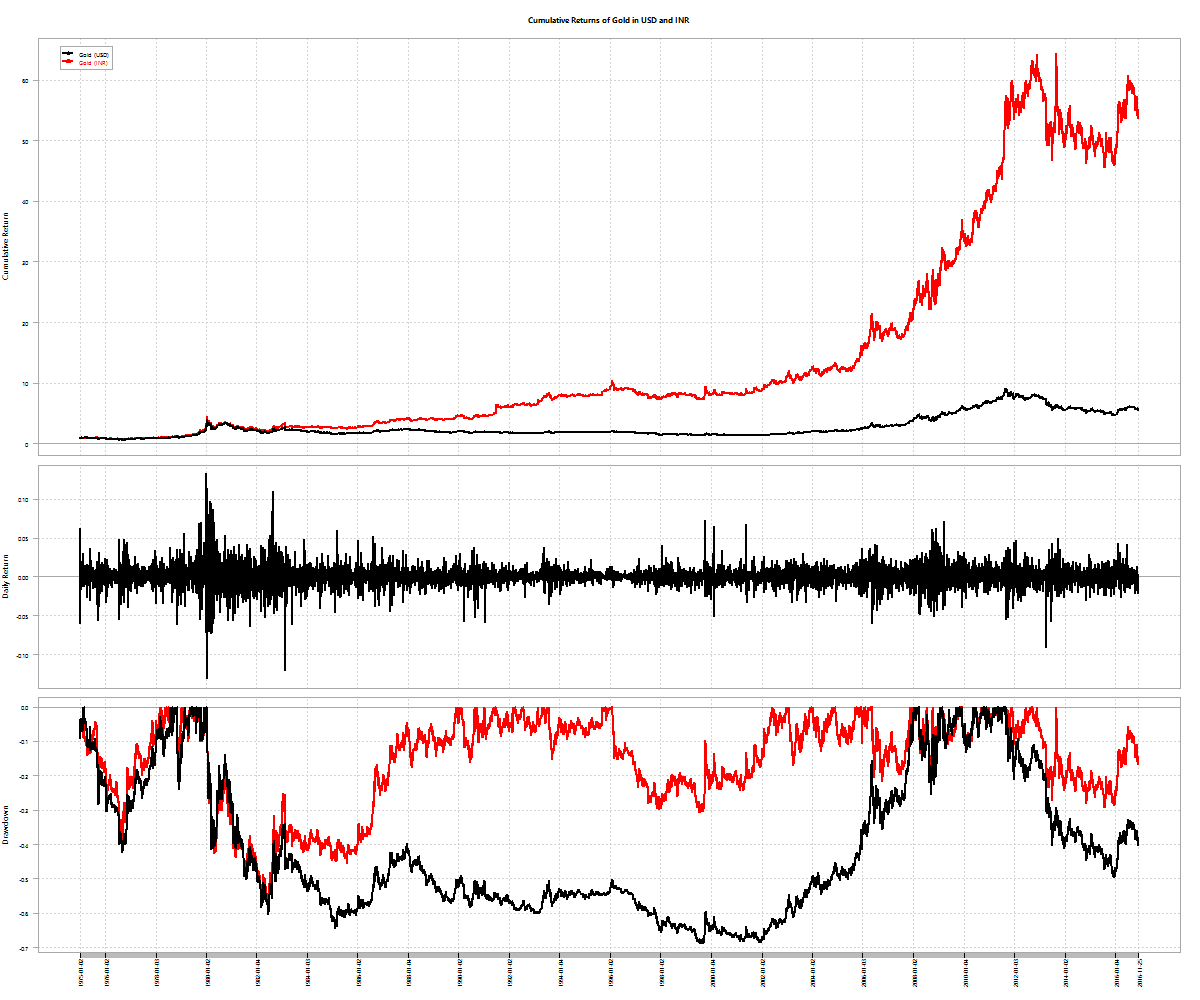
Notice the troughs of Gold/INR is shallower than those of Gold/USD?

gold-inr-usd

When you have a depreciating currency in hand, you can’t get rid of it fast enough. And the easiest way to do that in India is to buy gold. Our government can’t print more of it, can’t set its price and is fairly liquid.

Gold vs. NIFTY50

Since 2000, Rupee-for-rupee, gold had given better returns than the NIFTY 50.

gold-inr-nifty-cumulative

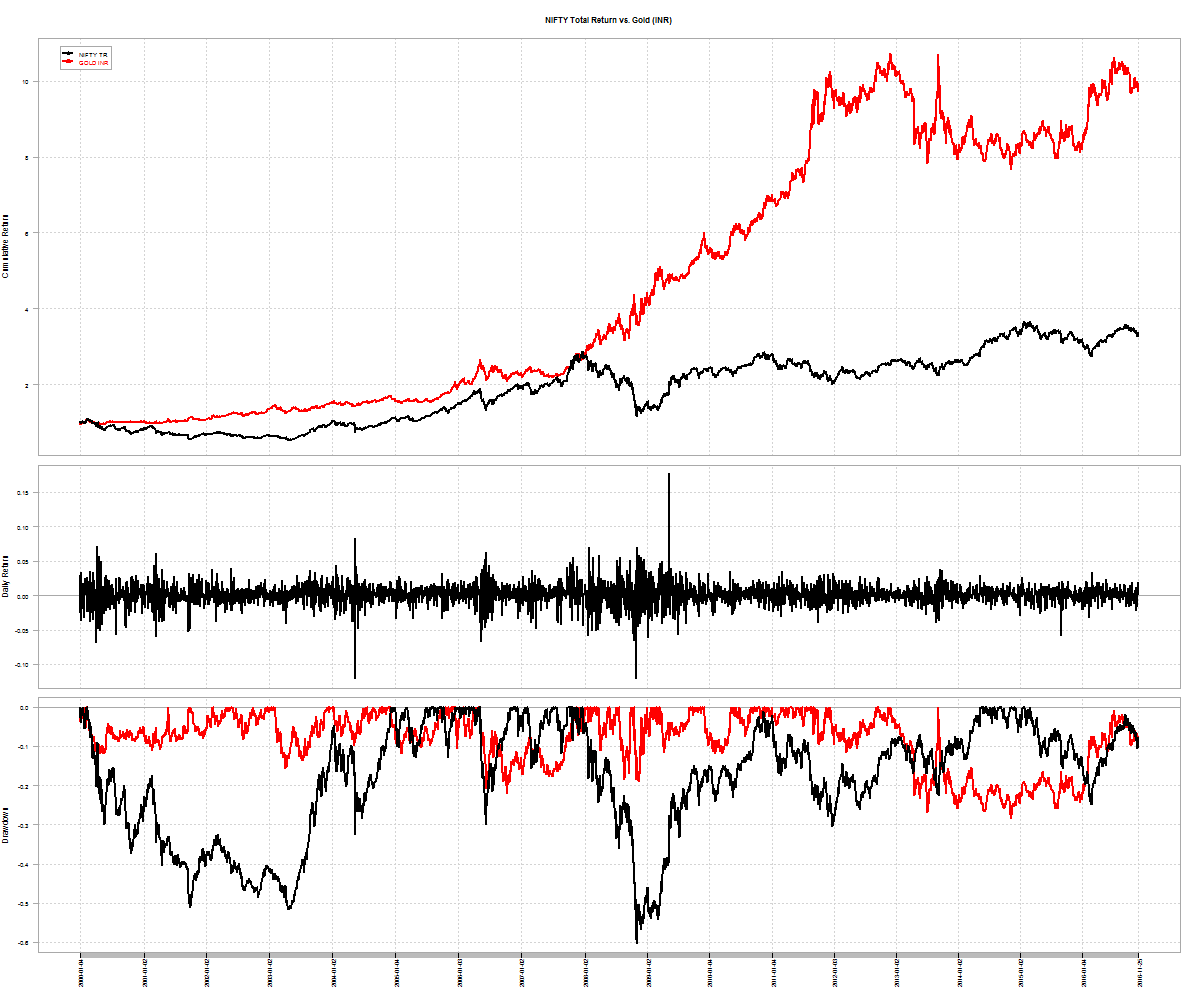
It is only the recent under-performance that has the anti-gold lobby all fired up.

gold-inr-nifty

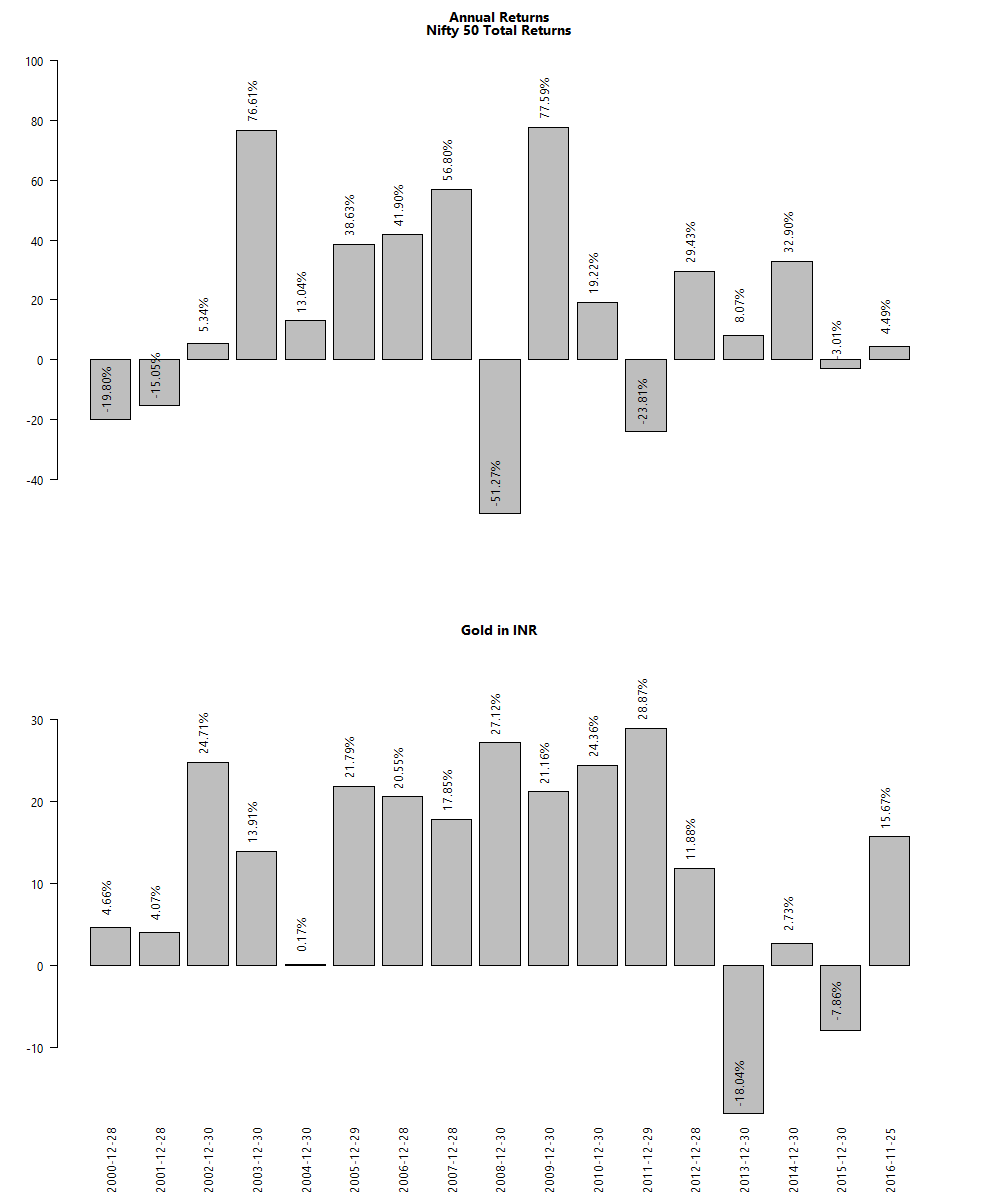
The long arch of the depreciating rupee is a more powerful force than what equity-only investors will have you believe.

Ways to invest in gold

Until recently, the only way to buy gold was to buy physical gold. However that is a very expensive proposition. Then came the gold ETF – GOLDBEES – that allowed investors to hold paper gold in demat form and provided instant liquidity. This year, the government came out with Sovereign Gold Bonds that is pretty good alternative. Here’s a handy table that looks at different aspects:

goldbond

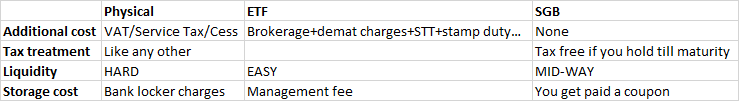
SGBs not only pay the price of gold at maturity but actually pay the investors an annual coupon. Currently, investors get 2.5% on their investment in SGBs. Contrast this to gold ETFs where investors have to pay asset management fees to the the fund house. From an asset allocation perspective, SGBs are a better deal than Gold ETFs. Go with gold bonds!

Monthly Recap: Demonetized!

world-2016-10-28-2016-11-30

Equities

Major
DAX(DEU) -1.24%
CAC(FRA) +0.22%
UKX(GBR) -3.20%
NKY(JPN) +6.11%
SPX(USA) +3.56%
MINTs
JCI(IDN) -3.98%
INMEX(MEX) -3.71%
NGSEINDX(NGA) -7.52%
XU030(TUR) -6.87%
BRICS
IBOV(BRA) -3.29%
SHCOMP(CHN) +5.45%
NIFTY(IND) -4.84%
INDEXCF(RUS) +6.85%
TOP40(ZAF) -1.62%

Commodities

Energy
Brent Crude Oil +4.77%
Ethanol +0.61%
Heating Oil +2.42%
WTI Crude Oil +1.81%
Natural Gas +7.24%
RBOB Gasoline +1.03%
Metals
Gold 100oz -8.32%
Palladium +24.50%
Platinum -7.73%
Silver 5000oz -7.82%
Copper +20.55%

Currencies

USDEUR:+3.46% USDJPY:+9.06%

MINTs
USDIDR(IDN) +3.91%
USDMXN(MEX) +8.08%
USDNGN(NGA) -1.26%
USDTRY(TUR) +10.80%
BRICS
USDBRL(BRA) +5.92%
USDCNY(CHN) +1.71%
USDINR(IND) +2.33%
USDRUB(RUS) +1.38%
USDZAR(ZAF) +0.91%
Agricultural
Lean Hogs +8.46%
Lumber +9.68%
Coffee (Arabica) -10.77%
Coffee (Robusta) -7.49%
Corn -4.93%
Cotton +2.47%
Feeder Cattle +5.36%
Orange Juice -0.05%
Soybean Meal -0.13%
Soybeans +3.47%
Sugar #11 -10.56%
Wheat -7.27%
Cattle +6.29%
Cocoa -13.63%
White Sugar -10.64%

International ETFs (USD)

global-etf-performance-2016-10-28-2016-11-30

Nifty Heatmap

nifty-50-2016-10-28-2016-11-30

Index Returns

index-performance-2016-10-28-2016-11-30
More: Sector Dashboard

Market Cap Decile Performance

deciles-perf-2016-11-30
More: Equal-Weight Deciles, Cap-Weight Deciles

ETF Performance

PSUBNKBEES +1.05%
CPSEETF -1.20%
INFRABEES -2.19%
BANKBEES -4.50%
NIFTYBEES -4.83%
JUNIORBEES -6.29%
Small and Midcaps took it on the chin…

Yield Curve

yieldcurve-2016-10-28-2016-11-30

Bond Indices

Sub Index Change in YTM Total Return(%)
0 5 -0.49 +2.02%
5 10 -0.55 +3.55%
10 15 -0.51 +4.53%
15 20 -0.42 +4.68%
20 30 -0.43 +5.57%
Massive, across the board, shift down in the curve…

Investment Theme Performance

Momentum Themes got shellacked but Momo’s performed better over all…

Equity Mutual Funds

Bond Mutual Funds

Institutional trends

dii-investments-2014-01-01-2016-11-30

FIIs trampeded out of both bonds and equities in November. Tump’s win lead to a steep rally in the US dollar and a spike in US bond yields that sucked liquidity out of risk assets.

fii-investments-2014-01-01-2016-11-30

Books I read in November


The Clash of the Cultures
: Investment vs. Speculation (Amazon, Notes)

John Bogle, the father of index funds lays out the case for passive indexing. His main argument is that as most of the assets are held by institutional managers who compete with other institutional managers and are more focused on asset gathering than being fiduciaries, investors should quit active management and buy-and-hold passive investments that just track a broad-based market-cap index at a low cost.

He makes this argument for the US markets, where institutional ownership of equities is over 70%. It is something that Indian investors should make a note of. As of right now, institutional ownership of equities is low. But as mutual funds, NPS and AIF ownership begin to cross over 50% of the market, it is time to shift from active to passive.

The Party: The Secret World of China’s Communist Rulers (Amazon, Notes)

tl;dr: The Chinese Communist Party owns everything in China.

NPS Tier II: Bogleheads Rejoice!

Did T2 kill NIFTY 50 ETFs and Index funds?

Instead of looking at NIFTY 50 ETFs or index funds, why not invest in NPS Tier II Class ‘E’? Unfortunate nomenclature aside, it is hard to beat the 0.01% management fee and the flat Rs. 190/- annual account maintenance fee. Compare that to how much you would pay if you go through:

  1. broker: brokerage + STT + stamp duty + SEBI turnover fee + service tax.
  2. direct through AMC: expense ratios between 0.26% and 1.03% (!)

As of 28th October 2016, 5-year returns across different pension fund managers are between 12.5% and 11.4%. A rough comparison with Birla Sun Life’s Index Direct Fund points to a 10.10% return over the same time-frame. Directly attributable to the lower fee structure of NPS.

The same treatment extends to corporate and government bond funds (Class ‘C’ and Class ‘G’, respectively) as well. Class ‘C’ 5-year returns have been between 11.2% and 12%. Birla Sun Life Corporate Bond Fund (direct) points to a 11% return over the same time-frame. Direct plan expense ratios for corporate bond funds are around 1%. What exactly are you getting for paying 100x more than through NPS?

If you are a Boglehead saving for retirement, you will love the ‘Auto’ feature (Class ‘A’) that automatically shifts the asset allocation from Equity to Debt as you near retirement. All for 0.01%.

If low fees and index investing is all that you care about, then NPS Tier I (tax efficient but with an annuity requirement at the end) and Tier II (just like any other investment ‘folio’) is something you should seriously consider.

Appendix

NPS charges (FAQ)

NPS SCHEME – E (Tier-II) performance (source)

nps-t2-class-e

NPS SCHEME – C (Tier-II) performance

nps-t2-class-c

Expense ratios of index fund (direct plans)

index-fund-expense

Expense ratios of corporate bond funds (direct plans)

corp-bond-fund-expense