Category: Investing Insight

Investing insight to make you a better investor.

50-Day SMA CNX 100 with Friction

There is always friction

One of our readers made a very astute observation yesterday:

comment

It is true that every strategy has friction. Friction in terms of trading costs, tracking error, whiplash, etc. So we put the 50-Day SMA CNX 100 that we discussed yesterday through the wringer to see what happens in the real world.

Modeling friction

We charge a pretty low brokerage of 0.2%. A two way buy and sell would cost 0.4%. Impact cost is probably 0.2%. For a total of 0.6% in friction. Lets round it up to 1% to give us a margin of comfort.

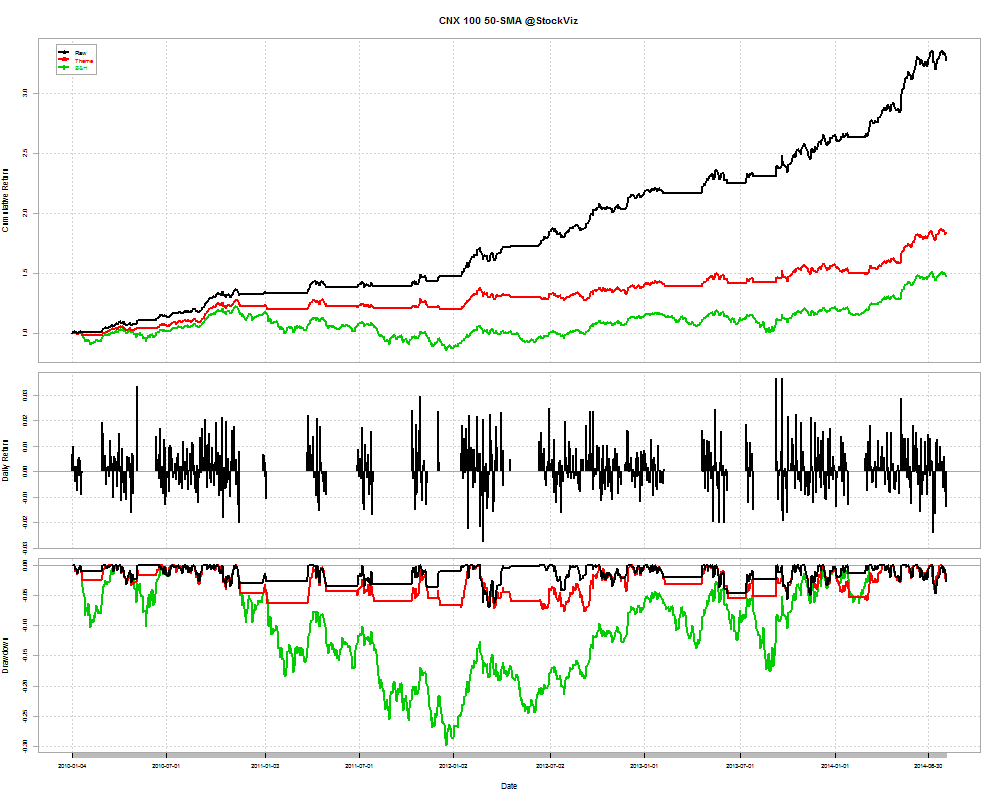
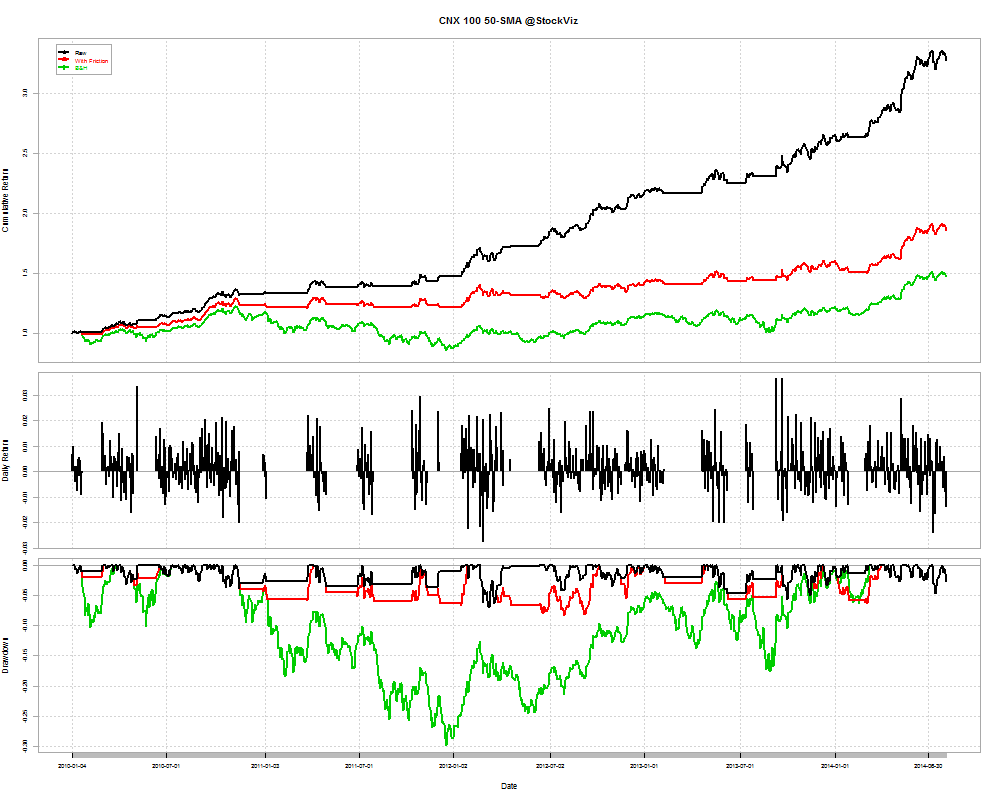
Whenever a trade happens, we will deduct 1% from the notional amount to account for this friction. From the start of 2010 to now, there were 1146 trading days, out of which, the strategy would have resulted in trades for 56 of them. Now lets compare the Raw 50-day CNX 100 with the Buy-and-Hold (B&H) and Friction scenarios.

CNX 100-friction-returns-2010

The investor still comes out as a winner with a cumulative return of 0.86 vs. 0.47 in buy-and-hold.

Accounting for tracking error

The above analysis used the CNX 100 index to model friction. However, in the real world, you cannot own fractional shares. This gives rise to tracking error. What would the numbers look like if we used the ETFs themselves?

CNX 100-etf-returns-2010

The investor still comes out as a winner with a cumulative return of 0.84.

Conclusion

Even after considering trading costs, impact costs and tracking error, this strategy comes out way ahead of a naive buy-and-hold strategy.

You can follow the Theme here.
CNX 100 50-Day Tactical Theme

Escaping the worst days

We had discussed how, by escaping the worst days, even if it means missing out on the best days, you can protect your portfolio from drawdowns and get superior results compared to a naive buy-and-hold strategy. See: The SMA Risk On/Off Switch

We ran the same filter on the CNX 100 index.

CNX 100 between 2005 and 2010

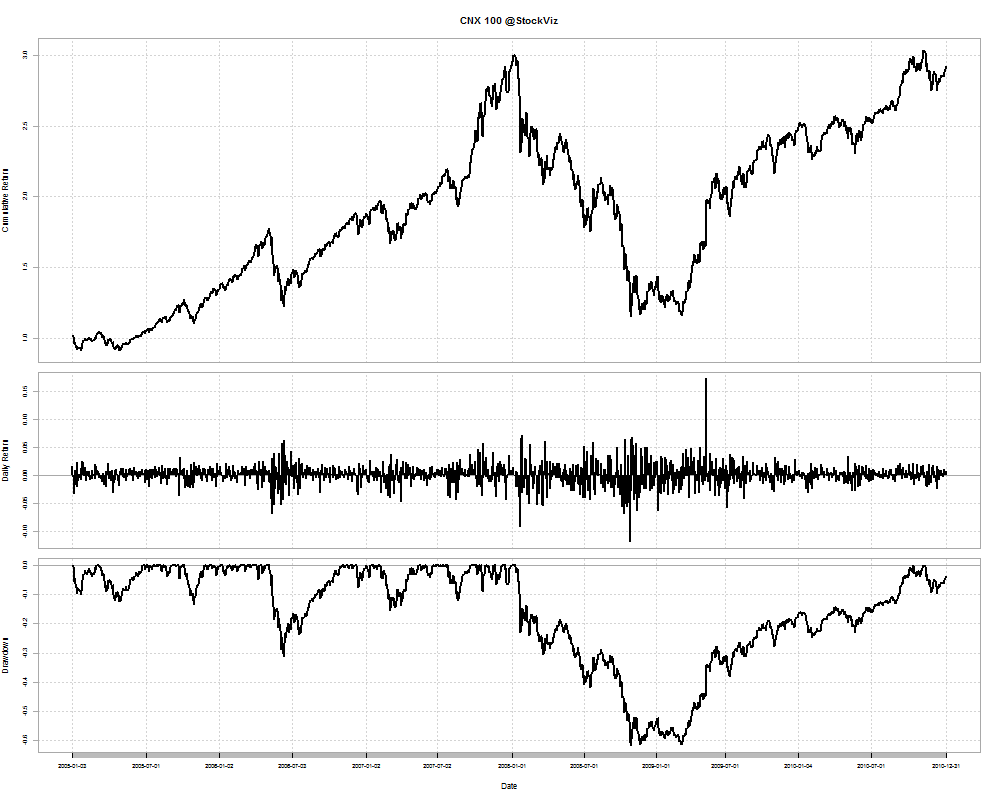
Naive Buy and Hold

buy-and-hold-returns-2005

Cumulative Return: 1.92

DrawDowns

bh-2005-2010

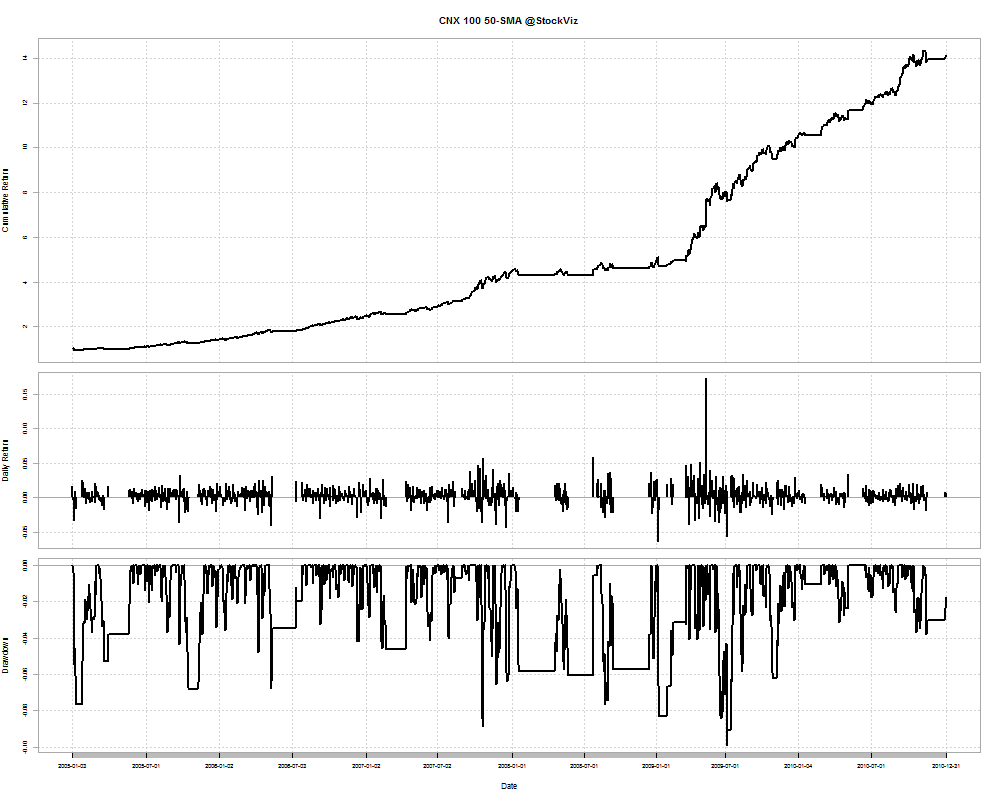
50-day SMA On/Off

CNX 100-50-day-sma-returns-2005

Cumulative Return: 13.12

DrawDowns

50SMA-2005-2010

CNX 100 from 2010 to now

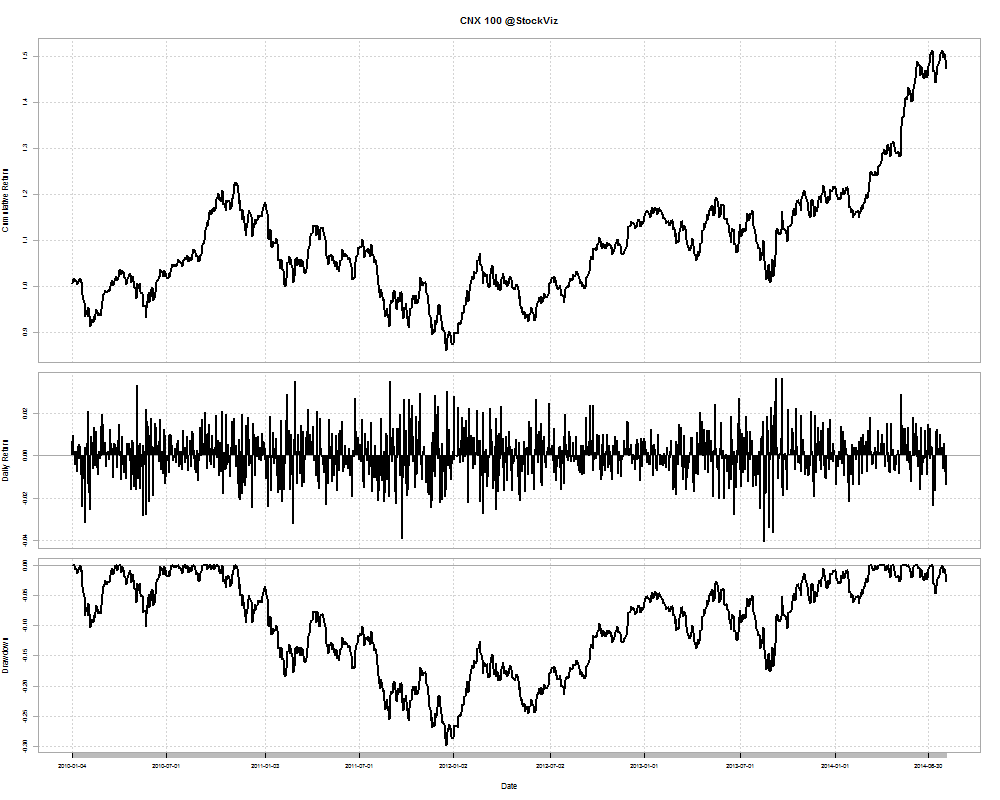
Naive Buy and Hold

buy-and-hold-returns-2010

Cumulative Return: 0.473696

DrawDowns

bh-2010-now

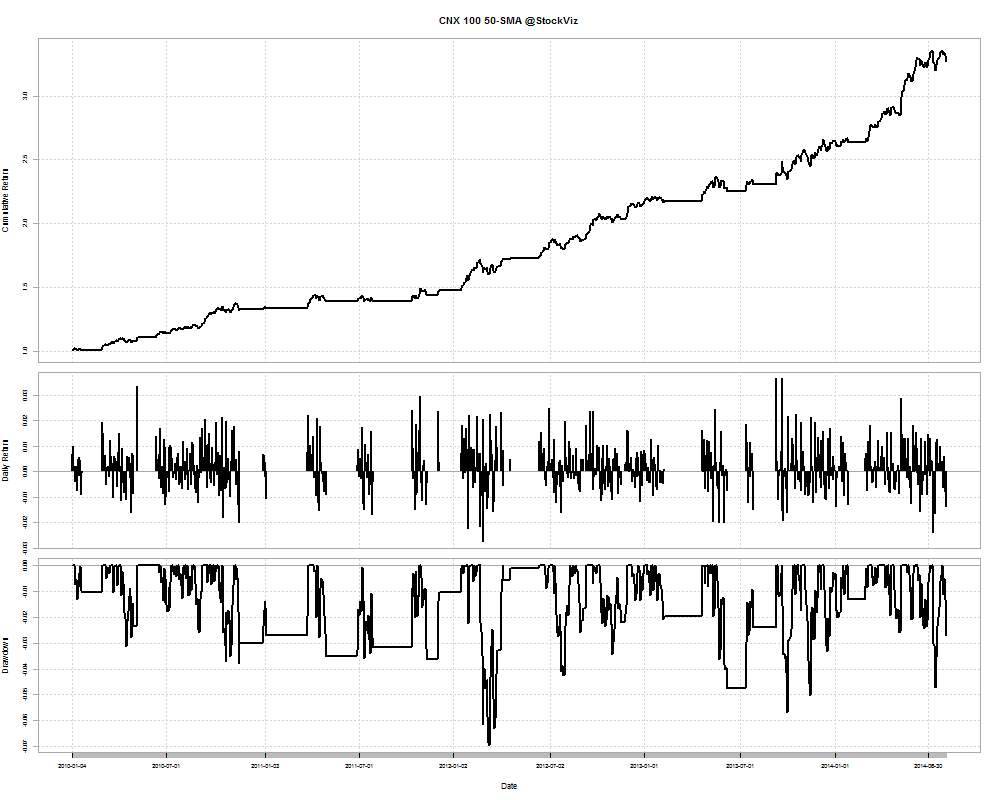
50-day SMA On/Off

CNX 100-50-day-sma-returns-2010

Cumulative Return: 2.270039

DrawDowns

50SMA-2010-now

The CNX 100 50-Day Tactical Theme

The 50-day signal can be used to go “risk on” and “risk off” between the NIFTYBEES and JUNIORBEES ETFs. When “risk on”, the Theme allocates equally between NIFTYBEES and JUNIORBEES and when “risk off”, moves to LIQUIDBEES.

You can follow the theme here.

The SMA Risk On/Off Switch

Market timing is a very divisive topic in investing. For traders, it has been the search for the holy grail. For passive investors, a source of derision.

Far more money has been lost by investors preparing for corrections, or trying to anticipate corrections, than has been lost in corrections themselves. – Peter Lynch

Does it mean investors should just remain long all the time? Hardly, according to the latest research by Meb Faber (ssrn).

Data for international markets show that volatility increases in declining markets. Any strategy that keeps you out of those periods, will improve your portfolio returns. The outline of his strategy is simple: go long the market if it is trading more than its 200-day SMA and stay out of the market otherwise.

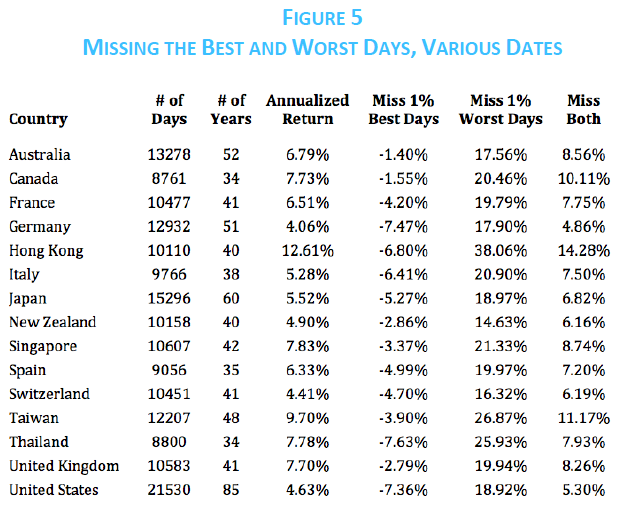
A small amount of outliers have a massive impact on performance and the best and worst outliers tend to cluster when the market is already declining. However, if you miss the best and worst days in every case your compound return is higher than buy and hold.

It works across most international markets:

miss best and worst days

Unfortunately, the paper doesn’t discuss the Indian markets, so lets try and fix that.

Best and worst days

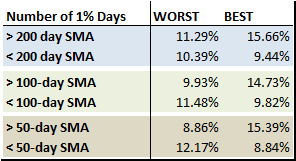
The table below shows that in a rising market, +1% days (BEST) outnumber -1% days (WORST) and the reverse is true of declining markets. Also, as you decrease the look-back period, the WORST to BEST ratio increases in a declining market.

nifty best worst

Cumulative Returns

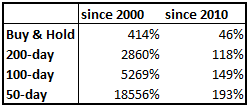
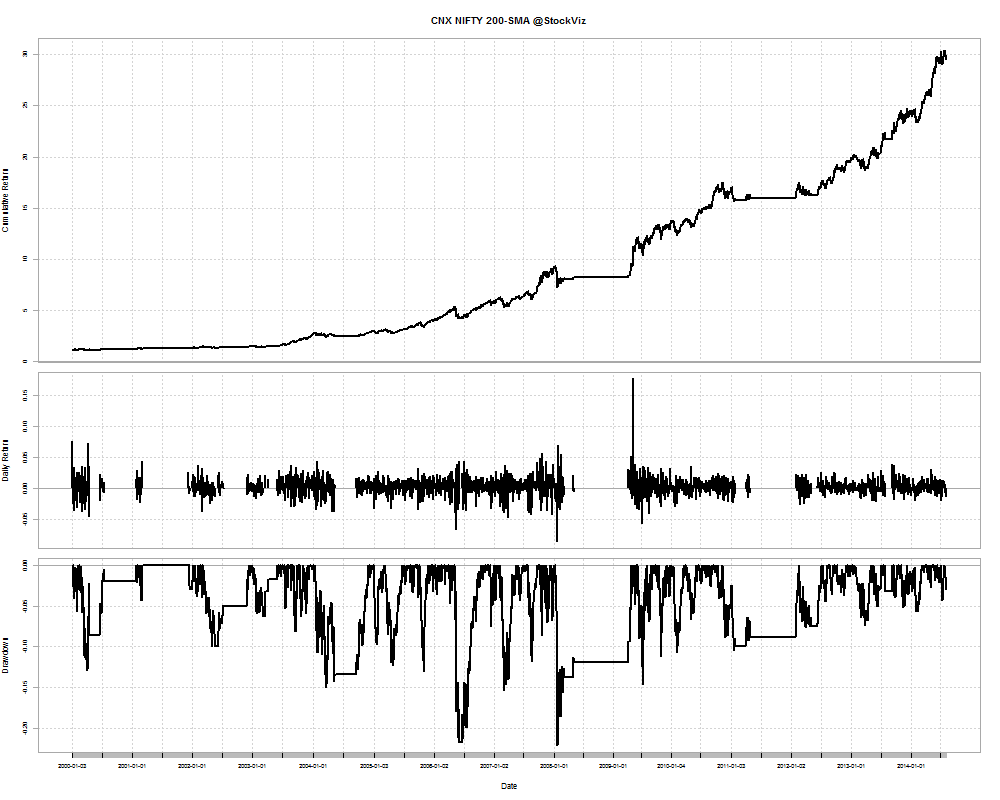
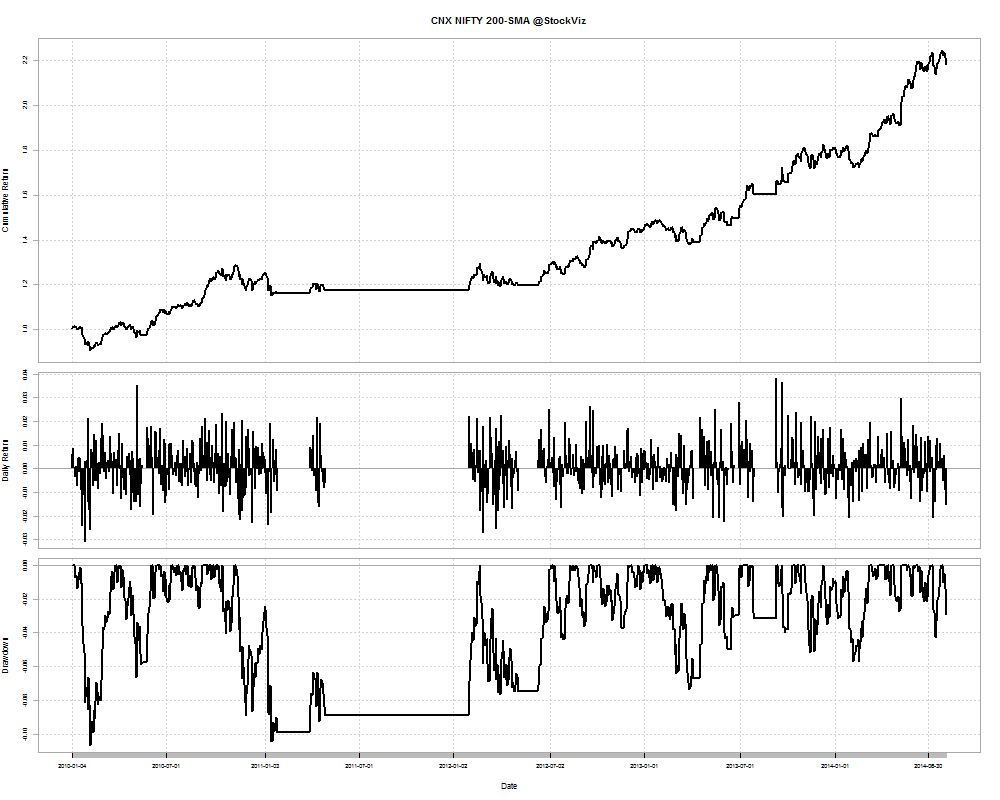
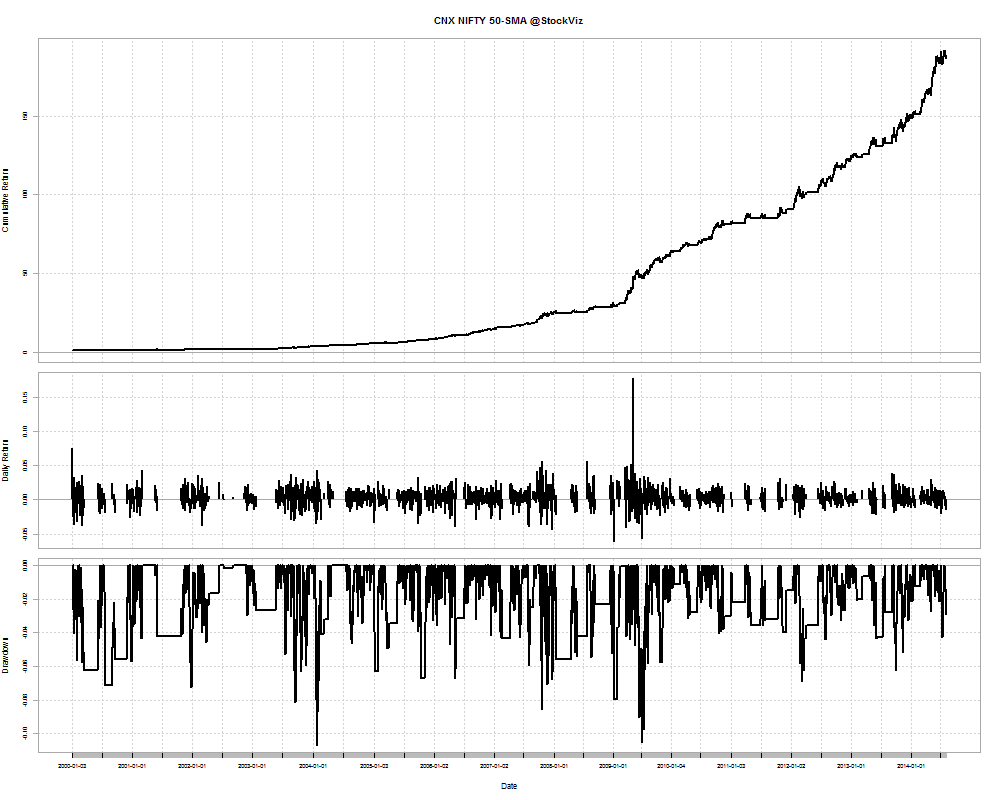
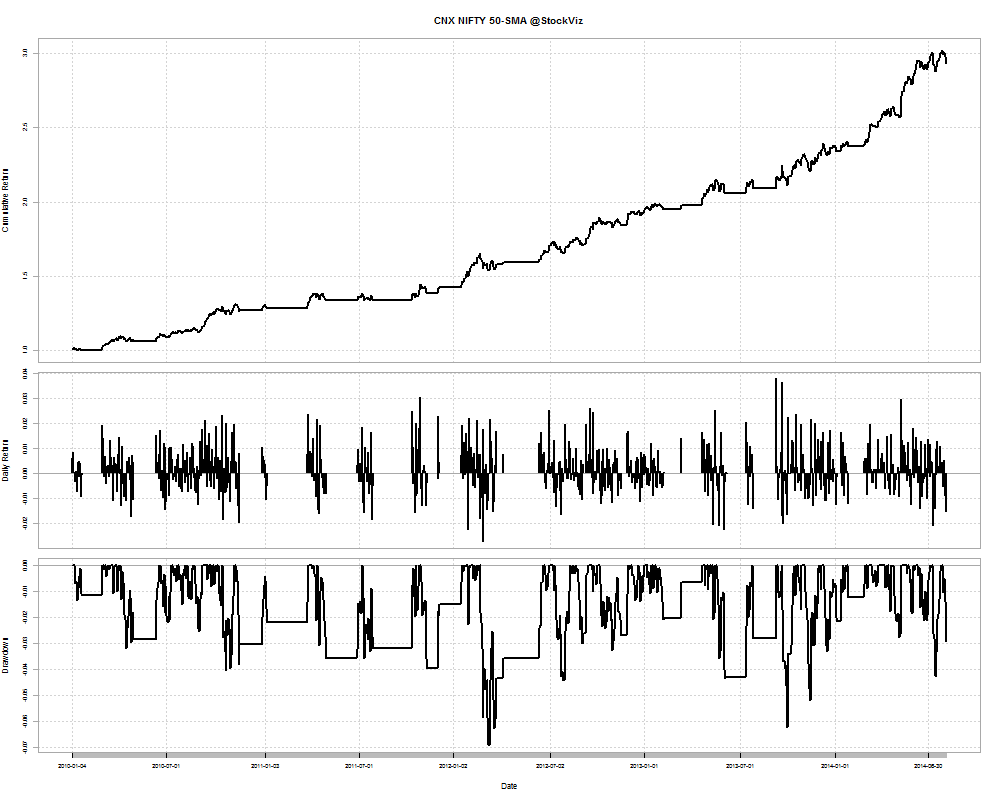
If you apply the SMA switch to the Nifty index, here’s how the cumulative returns look like:

nifty cumulative returns

200-day SMA Cumulative Return Chart

Since: 2000
CNX NIFTY-200-day-sma-returns-2000

Since: 2010
CNX NIFTY-200-day-sma-returns-2010

50-day SMA Cumulative Return Chart

Since: 2000
CNX NIFTY-50-day-sma-returns-2000

Since: 2010
CNX NIFTY-50-day-sma-returns-2010

Drawdowns

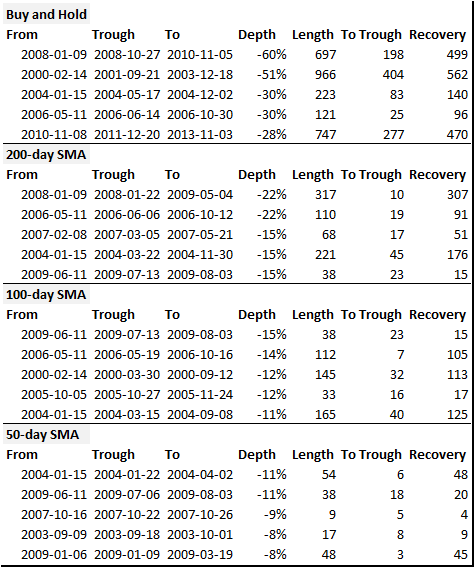
If the SMA rule really helped investors stay out of negative fat tails, then it should manifest itself in the drawdowns.

drawdowns

Conclusion

Using a simple SMA rule helps investors avoid drawdowns and boost returns as compared to a naive buy and hold strategy. The smaller the look-back period, the better the returns and lower the drawdowns.

60% of the time, it works everytime

When I was in high school, we were taught about “truth tables.” It is a mathematical table used in logic to tell whether a propositional expression is true for all legitimate input values. Watching pundits speak on TV is makes you wonder how they could ever have passed high school algebra.

The Can’t Lose Argument

Beware those who are never wrong. The “Can’t Lose Argument” goes something like this: A data point will be mentioned, and no matter what the net change in that data — up, down or neutral — it is somehow bad for markets.

Link: If You Can’t Lose,You’re a Loser

There is always a divergence

Sometimes they matter, sometimes they don’t. Sometimes one key divergence that was extremely important ends up meaning exactly zero the next time around. A single divergence, in and of itself, has all of the reliable predictive power of a bowl of chicken bones spilled out across the table.

Link: There’s ALWAYS a divergence

Macro-tainment

It’s crucial to recognize that macroeconomics is something that even the world’s smartest economists still don’t understand very well, and that political ideology and economic reality don’t mix.

Link: When Entertainment Passes for Investment Advice

Related: Musings on stock-market forecasts

Enjoy this video:

Mutual Fund League Tables

AMFI puts out AUM statistics of mutual funds once a quarter. Here are some key take aways.

The Top 5 Dominate

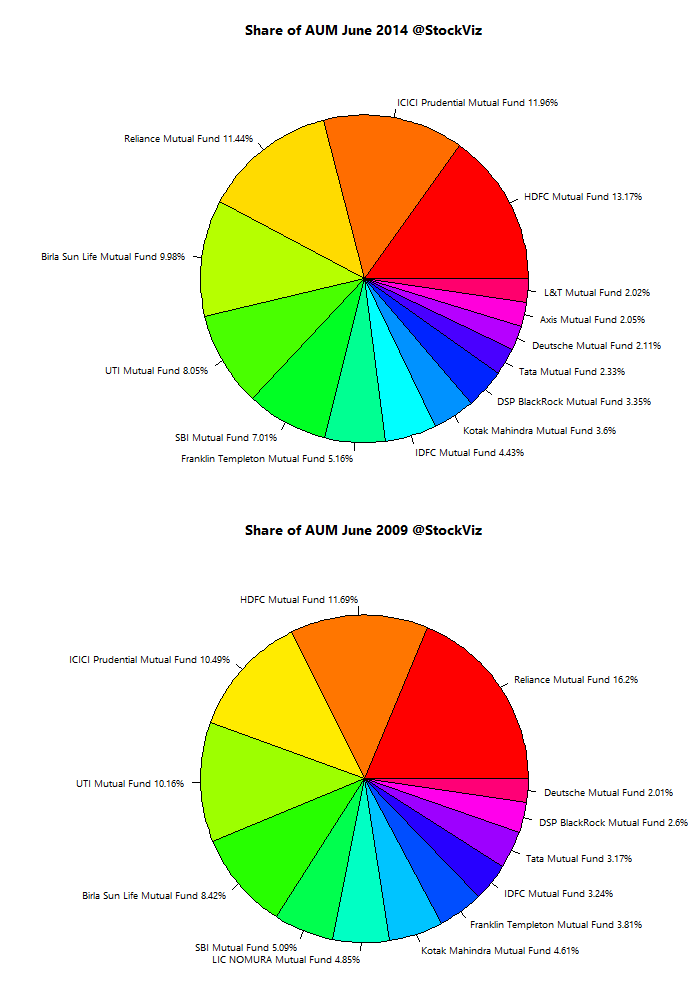
Between 2009 and 2014, the top 5 players have remained the same: HDFC, ICICI, Birla Sun Life and Reliance. And their share has remained more-or-less the same: 56.96% in 2009 and 54.6% now.

32 out of a total of 46 funds have less than 2% share, 29 have less than 1%

mutual-fund-aum-share

There are way too many schemes

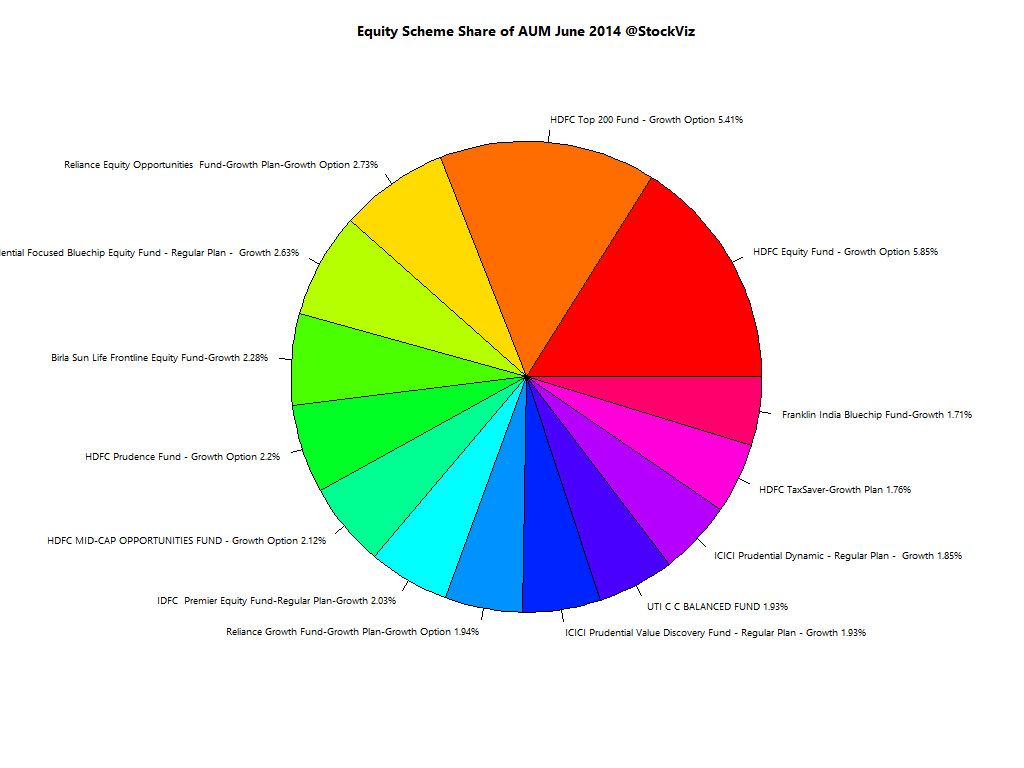
There are 1066 equity schemes (all permutations and combinations.) The top 2 schemes (both from HDFC) have more than 10% of AUM and the top 10 have about 30%. The rest of them fight for scraps.

equity-scheme-aum-share

Direct plans even the playing field

… a bit.

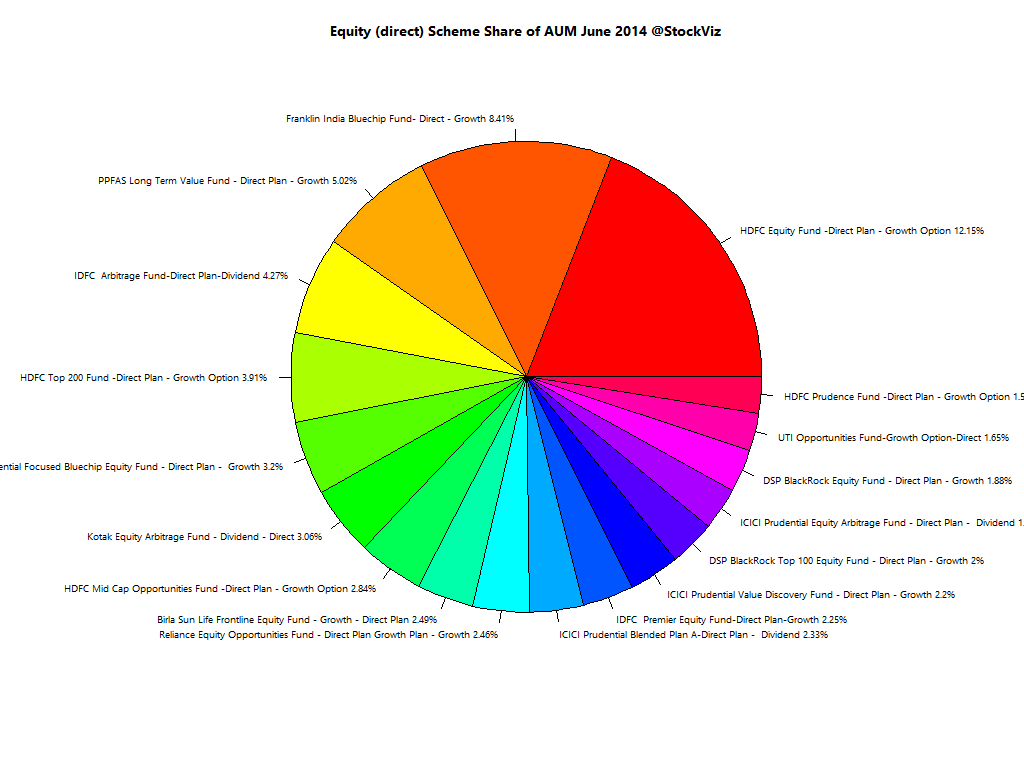
PPFAS has a 5% share of all direct plans.

direct-scheme-aum-share

However, Direct plans are yet to make a dent

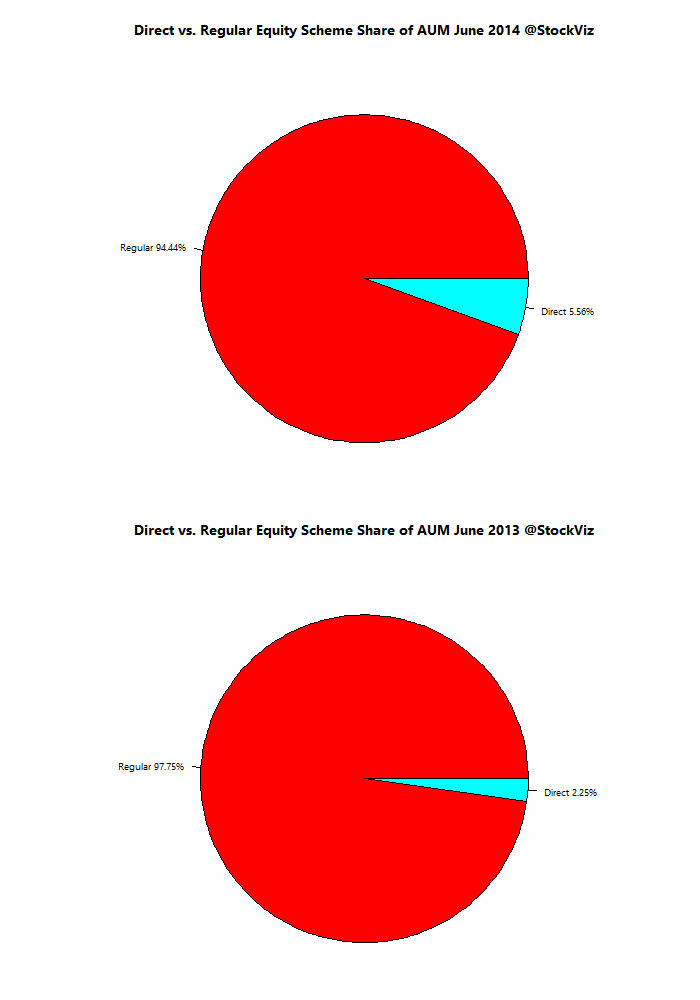
Equity AUM under direct plans have doubled since last year. This ought to be giving distributors sleepless nights…

direct-regular-scheme-aum-share