How do you compare two Mutual Funds and what should be the basis for such a comparison? There is the question of returns, obviously. But higher returns can be achieved by taking on more risk. And then there’s the question of draw-downs. What were the periods of bad performance and how long did it take the asset manager to make up for those losses? How do you compare risk-adjusted returns of two funds? What if you want to compare returns to whatever benchmark index you wanted?
Mutual Fund Comparison Tool
You can compare over 800 funds to each other and any benchmark index you choose. For example, are you confused between ICICI Top 100 and DSP BlackRock Top 100? Punch it in and hit compare.
And as you can see from the wealth chart below, BlackRock’s under-performance has been recent.
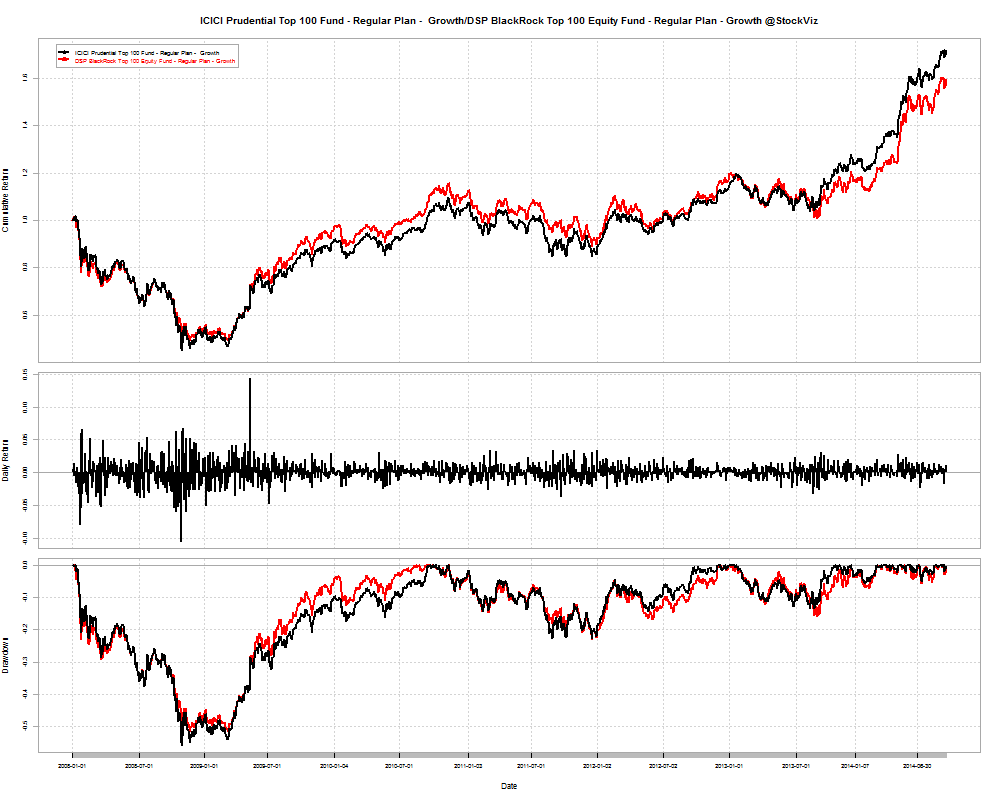
However, during the depths of the 2008 crisis, BlackRock managed to go down 51.73% vs. ICICI’s 55.66% and spent 632 days in the red vs. ICICI’s 656 days.
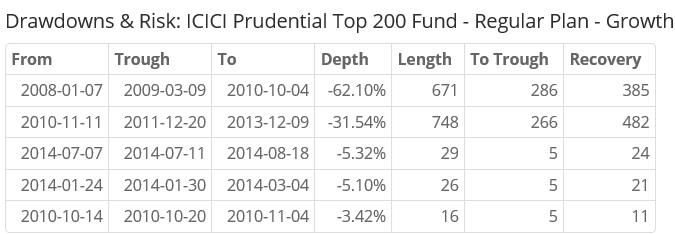
Now, how about comparing ICICI’s Top 100 vs. their own Top 200?
Confused between value funds and midcap index funds? Do famous managers live up to their reputations?
Go ahead, check out the tool: FundCompare
However, if you do want advice on investing in mutual funds, please get in touch with Shyam.
You can either WhatsApp him or call him at 080-2665-0232.
He is an AMFI registered IFA who can advice you on ICICI Pru, UTI and Birla Sun Life funds.