LiveMint recently ran an article, “India hedge funds outperform, but investors remain sceptical.” (link)
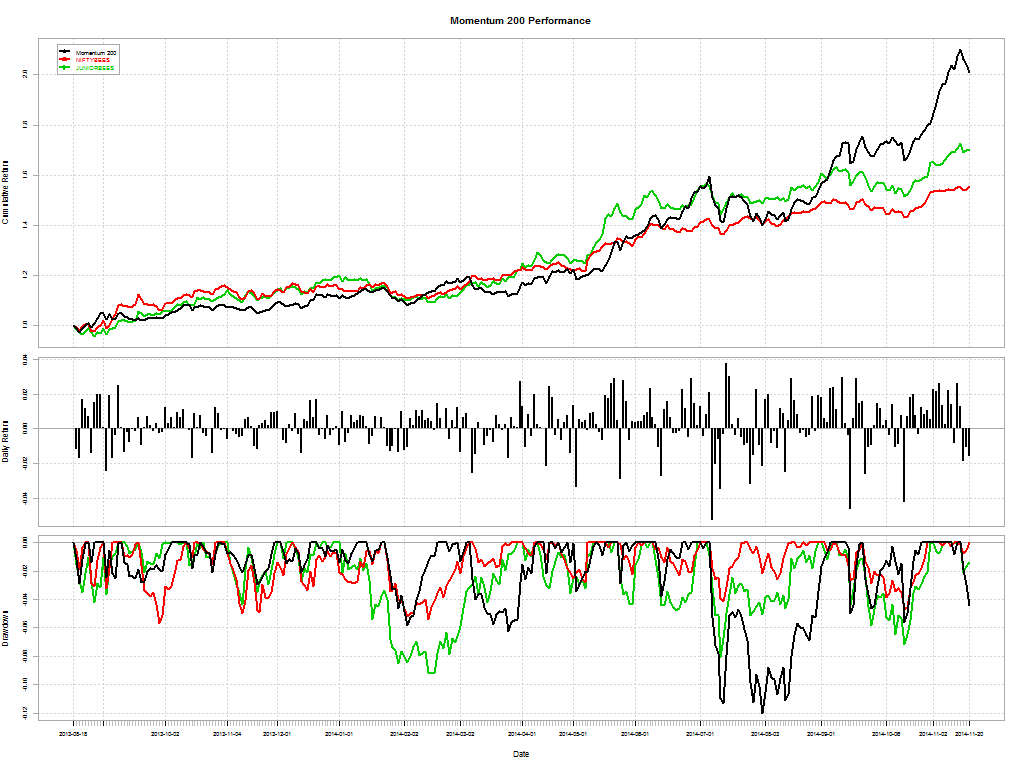
I don’t have access to the report quoted in the article and I am not sure if the returns are after fees and profit-sharing. But what is surprising is that these funds under-performed a basic, un-levered, momentum strategy. In the same period, our Momentum 200 Theme is up 61.54% and you can take all of it to the bank.
If you are charging 2 and 20, you should do better. Besides, most of them haven’t been through a down-cycle. And yes, Momentum will totally get crushed in a down-cycle, but at least investors know what they are getting into. For all you know, hedge funds, being the black-boxes that they are, could be just long momentum.
Turns out investor skepticism is warranted after all.