Category: Investing Insight

Investing insight to make you a better investor.

Using SMA to Reduce Volatility of Returns

Introduction

We saw how a CNX 100 50-day tactical investment strategy boosts returns of a naive buy-and-hold strategy (here) even while considering trading costs and other friction (here.) To visualize how this works, lets have a look at the histogram of daily returns since 2010 (1150 trading days.)

Naive buy-and-hold

bh-returns-2010
Daily Returns
<= -2%
36 days
<= -1%
165 days
>= +2%
41 days
>= +1%
188 days
Average
+0.04%
Std. Dev.
1.07

200-day SMA switch

200-sma-returns-2010
Daily Returns
<= -2%
16 days
<= -2%
85 days
>= +2%
21 days
>= +1%
122 days
Average
+0.07%
Std. Dev.
0.79

100-day SMA switch

100-sma-returns-2010
Daily Returns
<= -2%
11 days
<= -2%
66 days
>= +2%
21 days
>= +1%
114 days
Average
+0.09%
Std. Dev.
0.74

50-day SMA switch

50-sma-returns-2010
Daily Returns
<= -2%
7 days
<= -2%
53 days
>= +2%
24 days
>= +1%
110 days
Average
+0.11%
Std. Dev.
0.71

Conclusion

Even after considering trading costs, impact costs and tracking error, this strategy comes out way ahead of a naive buy-and-hold strategy. Better returns than buy-and-hold with lower volatility and at a low cost!

You can follow the Theme here.

Did Popeye have it right or wrong?

I came across some interesting articles on how urban legends are born and kept alive. This is especially true of readers who skim an academic discipline, for example, by reading Malcom Gladwell, and don’t put in the effort to stay updated. And just how the secret of advertising is repetition, repetition, repetition, some “truths” stick around long after they have been debunked simply because they get repeated often enough.

The 10,000 hour rule

Made famous by Outliers by Malcolm Gladwell, the 2008 book’s “10,000-hour rule” turned most “Soccer Moms” into “Tiger Moms.” However, we now know that Gladwell’s book mistook the average of 10,000 hours that experts took to master a skill with the total they required. Plenty of studies suggest that aside from practice hours, individual differences help explain success: from socioeconomics to coaching to I.Q.

However, they myth lives on as more and more people read the book and not the errata.

Source: National Geographic

Is Spinach a good source of iron?

In 1981 and again in 1995:
The myth from the 1930s that spinach is a rich source of iron was due to misleading information in the original publication: a malpositioned decimal point gave a 10-fold overestimate of iron content.

In 2011:
The story that the iron content of spinach was a myth based on a misplaced decimal point is itself a myth. Spinach has a lot of iron, just like other green vegetables, but it is unavailable for absorption.

So spinach is useless as a source of iron. But not because of a measurement error. Try to get your mom to believe it.

Source: SagePub

Here be dragons

Daniel Kahneman: “A reliable way to make people believe in falsehoods is frequent repetition, because familiarity is not easily distinguished from truth. Authoritarian institutions and marketers have always known this fact.”

People deal with statistical illiteracy by reacting with their gut. It makes us overreact to things that seem dangerous only because they’re unknown, and underreact to things that are dangerous but look benign.

But tell this to a guy who believes in technical analysis and he’ll probably kill you.

Source: Fool.com

An (Unscientific) Analysis of a Market Pundit

Today, we present a very preliminary cut of how a very popular market pundit, who is often on TV and the web, has performed.

The period we looked at was between the November of 2013 and the June of 2014. As a point of reference, during this period, investors would be up 26.14% if they had just held on to the NIFTYBEES etf.

Long Calls

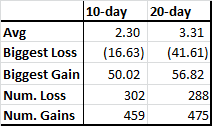
On an average, his long calls gave a 10-day return of +2.30% and a 20-day return of +3.31%. Out of 761 long-calls, 302 resulted in losses and 459 in gains over a 10-day period. Not bad at all.

long calls

Short Calls

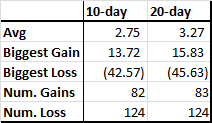
Its tough to come out with a short call when the market is moving up. On an average, his short calls gave a 10-day return of -2.75% and a 20-day return of -3.27%. Out of 206 short-calls, 124 resulted in losses and 82 in gains over a 10-day period.

short calls

You can download the spreadsheet and run your analysis here. Just let us know what you find!

50-Day SMA CNX 100 with Friction

There is always friction

One of our readers made a very astute observation yesterday:

comment

It is true that every strategy has friction. Friction in terms of trading costs, tracking error, whiplash, etc. So we put the 50-Day SMA CNX 100 that we discussed yesterday through the wringer to see what happens in the real world.

Modeling friction

We charge a pretty low brokerage of 0.2%. A two way buy and sell would cost 0.4%. Impact cost is probably 0.2%. For a total of 0.6% in friction. Lets round it up to 1% to give us a margin of comfort.

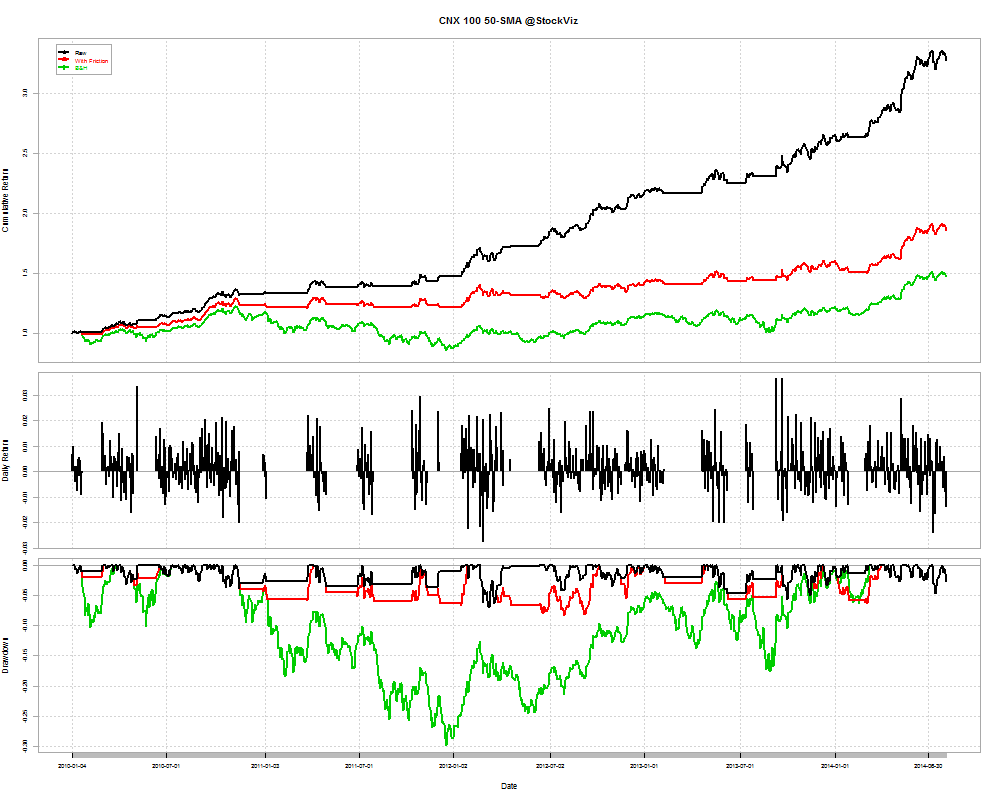
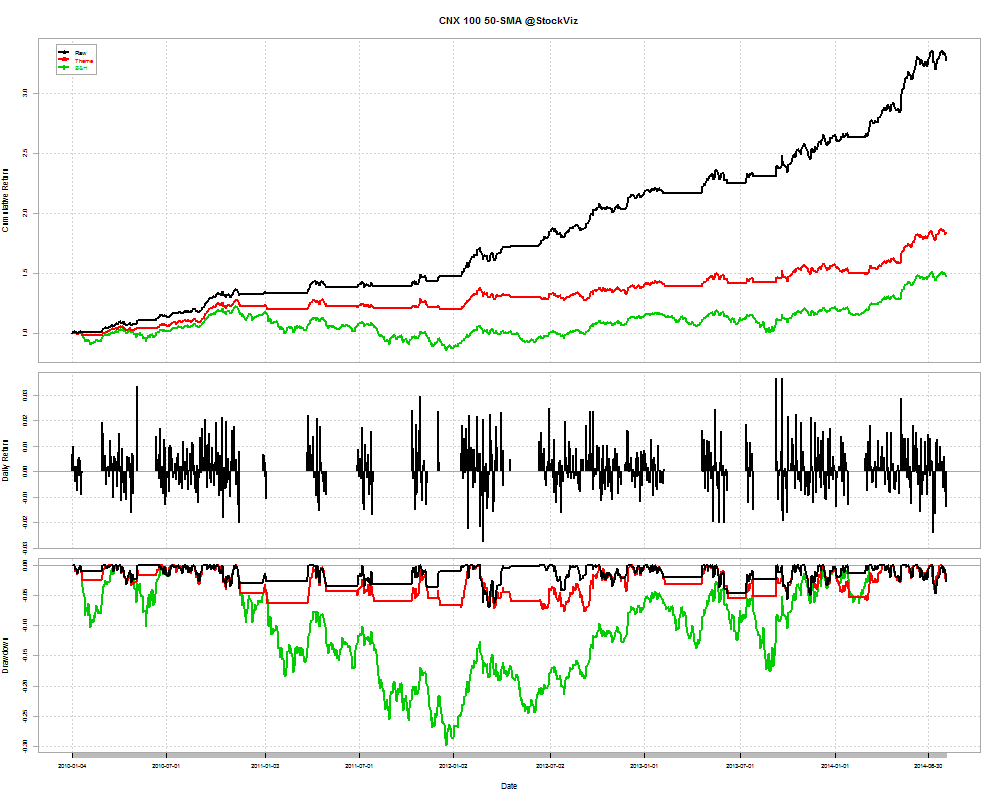
Whenever a trade happens, we will deduct 1% from the notional amount to account for this friction. From the start of 2010 to now, there were 1146 trading days, out of which, the strategy would have resulted in trades for 56 of them. Now lets compare the Raw 50-day CNX 100 with the Buy-and-Hold (B&H) and Friction scenarios.

CNX 100-friction-returns-2010

The investor still comes out as a winner with a cumulative return of 0.86 vs. 0.47 in buy-and-hold.

Accounting for tracking error

The above analysis used the CNX 100 index to model friction. However, in the real world, you cannot own fractional shares. This gives rise to tracking error. What would the numbers look like if we used the ETFs themselves?

CNX 100-etf-returns-2010

The investor still comes out as a winner with a cumulative return of 0.84.

Conclusion

Even after considering trading costs, impact costs and tracking error, this strategy comes out way ahead of a naive buy-and-hold strategy.

You can follow the Theme here.
CNX 100 50-Day Tactical Theme

Escaping the worst days

We had discussed how, by escaping the worst days, even if it means missing out on the best days, you can protect your portfolio from drawdowns and get superior results compared to a naive buy-and-hold strategy. See: The SMA Risk On/Off Switch

We ran the same filter on the CNX 100 index.

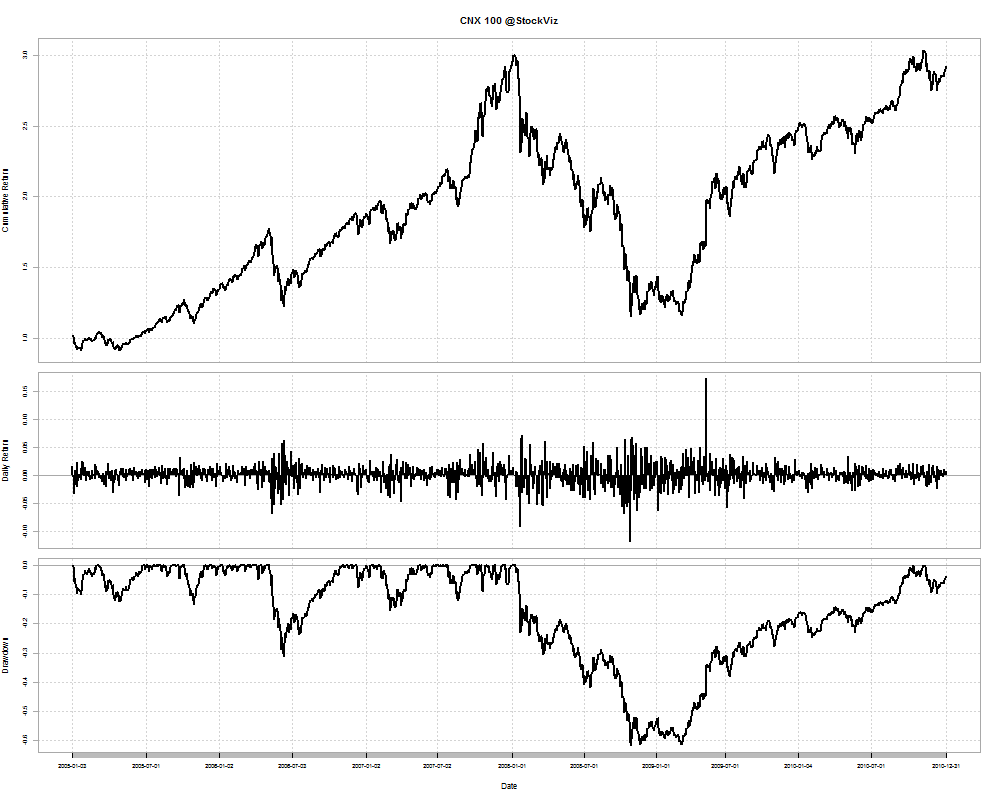
CNX 100 between 2005 and 2010

Naive Buy and Hold

buy-and-hold-returns-2005

Cumulative Return: 1.92

DrawDowns

bh-2005-2010

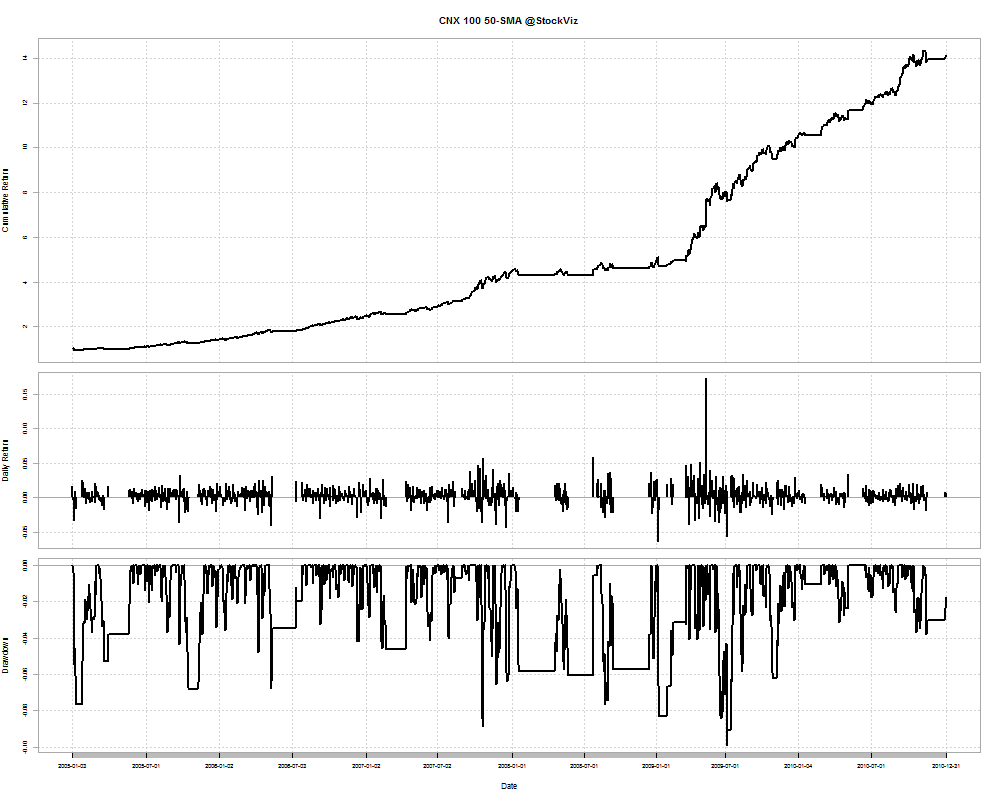
50-day SMA On/Off

CNX 100-50-day-sma-returns-2005

Cumulative Return: 13.12

DrawDowns

50SMA-2005-2010

CNX 100 from 2010 to now

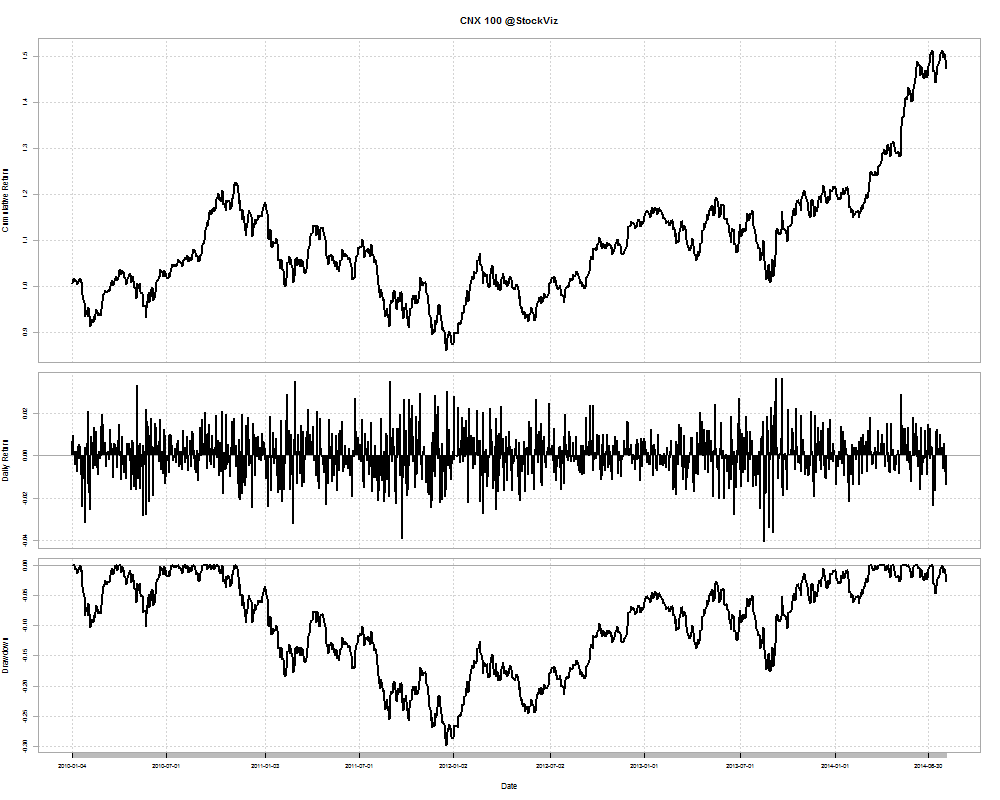
Naive Buy and Hold

buy-and-hold-returns-2010

Cumulative Return: 0.473696

DrawDowns

bh-2010-now

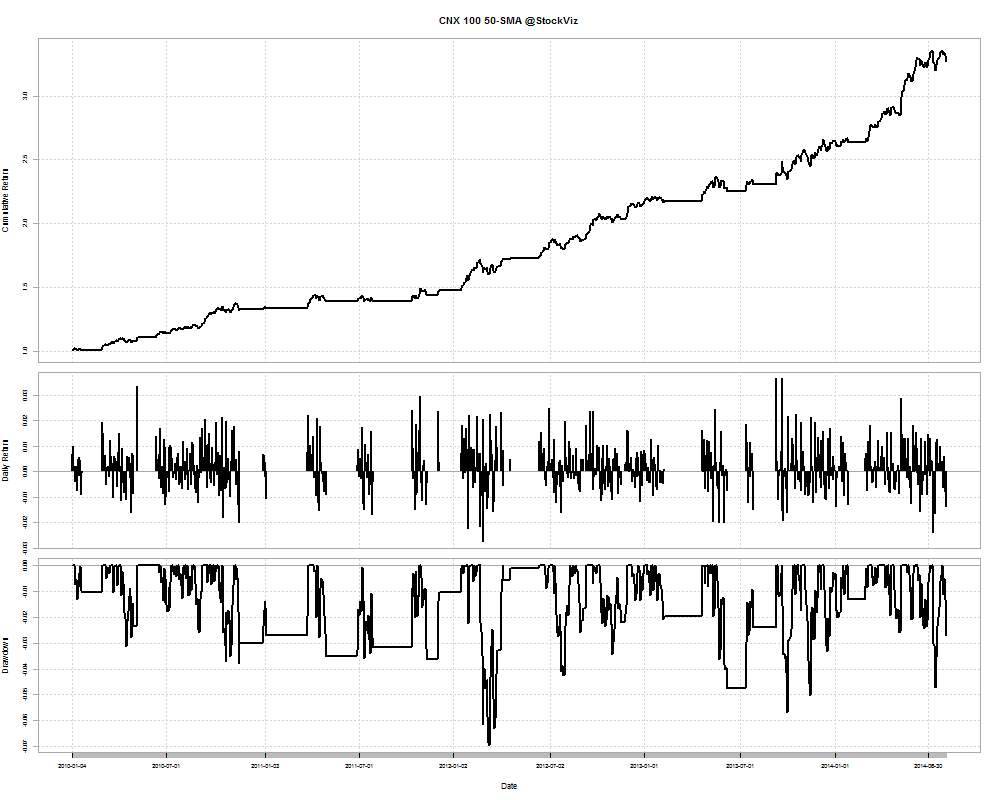
50-day SMA On/Off

CNX 100-50-day-sma-returns-2010

Cumulative Return: 2.270039

DrawDowns

50SMA-2010-now

The CNX 100 50-Day Tactical Theme

The 50-day signal can be used to go “risk on” and “risk off” between the NIFTYBEES and JUNIORBEES ETFs. When “risk on”, the Theme allocates equally between NIFTYBEES and JUNIORBEES and when “risk off”, moves to LIQUIDBEES.

You can follow the theme here.