Tag: NIFTYBEES

Analysis: RELIANCE

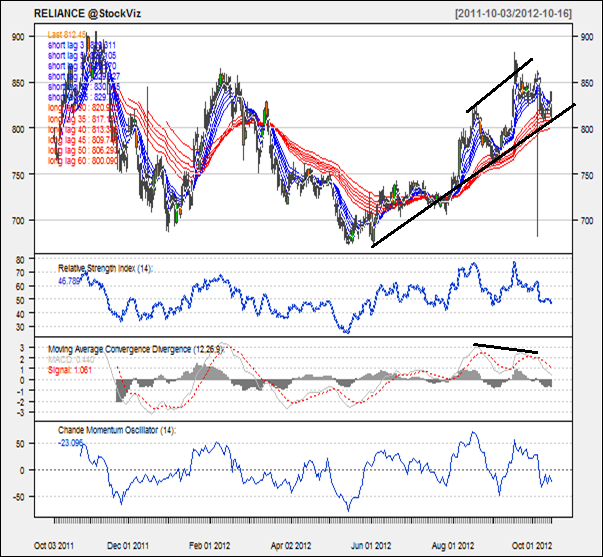
This week’s pick is [stockquote]RELIANCE[/stockquote]. Trading at around the same price as an year ago, the stock has made a meager return of 3% over the last 12 month period. The stock is in constant uptrend since May, with a few small corrections in between after it found the support at 670 levels.

Untitled

Oscillators like RSI and CMO are at currently at 47 and -23. At this level of RSI, the uptrend has no potential stops in the very near future. And looking at the previous highs of RSI, the stock can see an up-move till RSI reaches close to 75. The CMO as well is in the middle, and moving close to the -50 levels. If it gets too close to -50, it will signal a buy.

MACD line and signal line are drifting apart from each other and histogram levels are stagnant, but a higher high in the prices with lower highs in the MACD line is a divergence. This behavior can be suggesting the imminent change in the direction of the prices.

Looking at GMMA for a medium to long term outlook is not giving a lot of indication. The long term lines are moving close to each other (signaling a probable change of previous trend). The decreasing separation in the short term lines also suggests a lookout period for the near term.

image

Reliance’s average correlation of 0.73 with the Niftybees suggests that the correlation is quite strong and positive, and the movements will be of the similar magnitude as Niftybees. [stockquote]NIFTYBEES[/stockquote]

image

Reliance has volatility in the range of 0.2 to 0.6 for the most part, which is not a very big range. The volatility is currently at sky high levels of beyond 0.7, higher compared to the recent past. A constant eye is required on the scrip in case it makes a sudden move.

The up-trend is quite prominent. Looking at these technical, a short term buy is good but for the long term you might want to be cautious as the stock can check for the resistance levels at Rs. 900.
Enhanced by Zemanta

Analysis: ITC

This week’s pick is [stockquote]ITC[/stockquote]. Trading at 52 week high of Rs. 280, the stock has a return of close to 40% over the last 12 month period. The stock has been in a consistent uptrend for the last year, a small correction happened close to Rs. 250, but a pullback was seen from the Rs. 227 levels with affirming volumes. 

imageimage

Oscillators like RSI and CMO are at currently at the levels of 66 and 60. At this high level, there surely can be a correction in the short term. Although looking at the previous highs of RSI, the stock can see an up move till RSI reaches 80. MACD line and signal line are drifting apart from each other and histogram levels are on a rise. Not suggesting any corrections.

Looking at GMMA for a medium to long term outlook is not giving a lot of indication. The long term lines are moving away from each other (signaling a continuation of the previous trend). The increasing separation in the short term lines also suggests a positive outlook for the near term. The stock seems to be on a roll. It is a long term green flag for this stock.

image

ITC’s average correlation of 0.49 with the [stockquote]NIFTYBEES[/stockquote] suggests that the correlation is strong and positive, Although the movements will not be of the same magnitude as Niftybees.

image

ITC has volatility in the range of 0.4 to 0.6 for the most part (except for the high regions during 2010) which is not a very big range. The volatility is currently at 0.70, higher compared to the recent past. A constant eye is required on the scrip in case it makes a sudden move.

The up-trend is quite prominent. For a short term until the RSI levels start to decrease it is suggested to hold the scrip. And for the long term we do not have any standard to measure if it has any resistance at any levels. This stock can just be another example to prove the proverb “the trend is your friend” true.

Enhanced by Zemanta

PSU Banks vs. the Rest

image

PSU banks [stockquote]PSUBNKBEES[/stockquote] have under-performed the market this year, up just 7% vs. the sector’s [stockquote]BANKBEES[/stockquote] 22% and the market’s [stockquote]NIFTYBEES[/stockquote] 9%. 2011 was not kind to the dinosaurs either, -42% vs. the Nifty’s not so great -16%.

In fact, the only time the PSUs outperformed by a meaningful measure was during the panic of 2008, where they tanked less than the rest of the market.

The gloom and doom scenario includes rising NPAs, pension provisions and rising costs leading to more capital raises. Besides, given the experience of minority shareholders in the government owned Coal India [stockquote]COALINDIA[/stockquote], FIIs have been fleeing from public sector companies in general.

PSU banks are overexposed to bankrupt state electricity boards, with no glimmer of hope in the horizon. And given the weak monsoon, the direct exposure these banks have to the agriculture sector might land a double whammy in 2012.

But given the 35% drop since 2011, this sector is worth a second look. The Finance Minister is making the right noises regarding the deficit. The monsoon may not turn out to be all that bad after all. NPAs are getting worked through and it looks like banks will be exiting 2012 with a decent balance sheet. Besides, the yield curve is positive, so the banks don’t have to try too hard to make money. The 2012 budget has sanctioned Rs. 15,888 crore to be provided for capitalization of public sector banks and financial institutions to get them Basel III compliant, so the capital situation is not that bad.

PSUBNKBEES technical analysis charts

Currently the PSU Bank ETF looks like its resting on a weak support at Rs. 300 and the near-term upside seems limited. However, if it heads towards Rs. 250, be prepared to pull the trigger.

PSU banks should on every investors radar. Remember Warren Buffett: “Buy what everybody hates”


Returns on Reliance

RIL Logo

Image via Wikipedia

We had discussed how risk and return are two sides of the same coin (read the series here). Also, we looked at the high price correlation of Reliance vs. the Nifty 50 index. The question yet to be answered is this: given a choice between owning Reliance and owning the NIFTYBEES ETF, what should an investor do?

Lets look at the pros of owning the NIFTYBEES:

  1. The NIFTYBEES represent the broader market. Investors get a diversified, market-weighted portfolio.
  2. 8.73% of the NIFTYBEES is, in fact, Reliance. So investors do get a slice of exposure to Reliance.

Now what would be the disadvantages of owning the NIFTYBEES vs. owning Reliance outright?

  1. If Reliance out-performs the index, then investors only get a small (8.73%) of the increase
  2. Investors may not want to buy the entire index and might prefer a concentrated portfolio of just resource stocks, of which Reliance is one.

To answer this question, lets turn our heads to two measures: alpha and beta (discussed here.) Reliance has an alpha of -0.0002946529 and a beta of 1.027928. What this shows is that Reliance actually underperformed the index (a –ve alpha) and it more or less tracked the index (a beta close to 1; confirmed by our correlation study.)

We are in the process of rolling out alpha and beta of individual stocks against the Nifty 50 index. Stay tuned!