Tag: NIFTYBEES

Analysis: RAYMOND

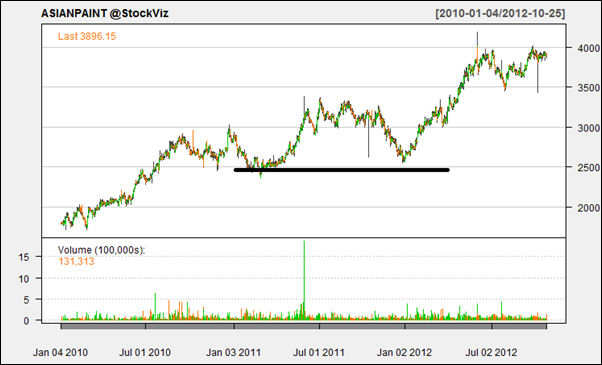
Today’s pick is [stockquote]RAYMOND[/stockquote]. The stock has made a 12% since the Rs. 335 levels of last October.

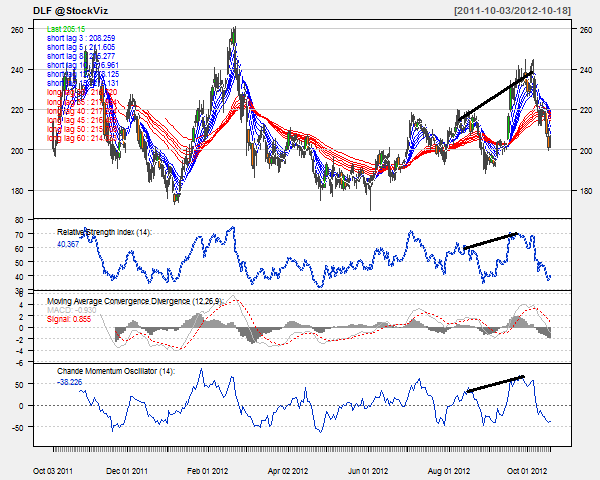
The up-trend since January this year has seen resistance around the 420 levels a few times. The stock has seen many corrections in the last one year, and is trading above the near-term support of 340.

image

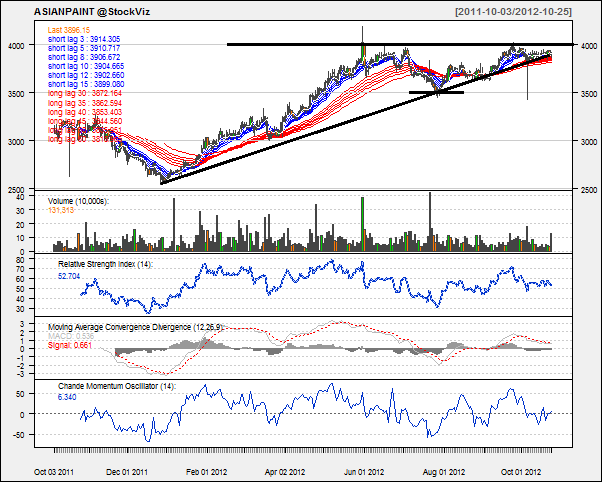
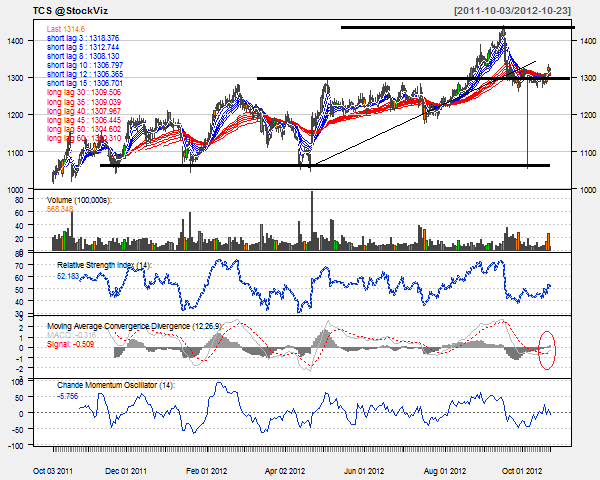
Oscillators RSI and CMO are at currently at 53 and -4. At this level of RSI, the stock has to decide on which way to go. CMO doesn’t suggest an imminent move either.

The MACD and signal lines are closing in. The histogram levels are on a decline suggesting a possibility of an up-move.

The GMMA chart for the stock is not suggesting a directional move, one way or the other. The short-term lines are very close to each other and the long-term lines are entangled.

image

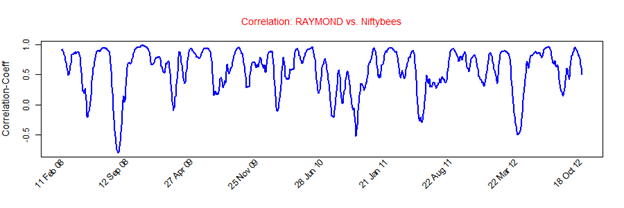
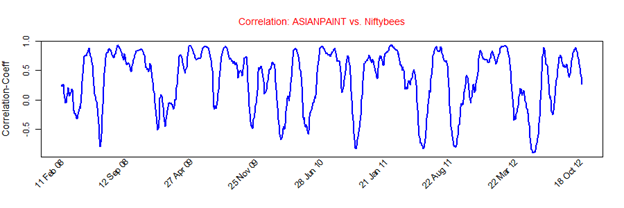
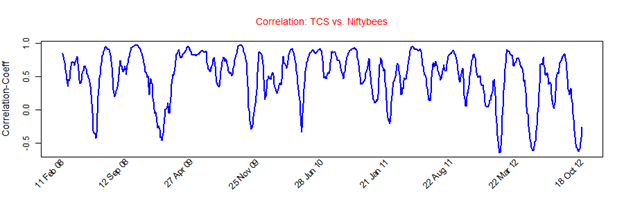
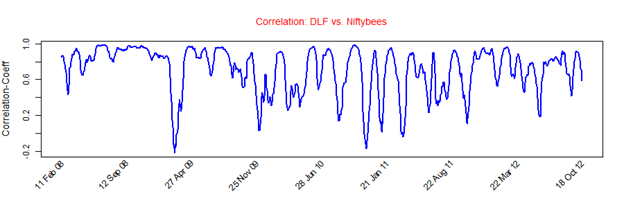
Raymond’s average correlation of 0.57 with the Niftybees is positive and strong. At this level, the stock will not replicate the Niftybees. [stockquote]NIFTYBEES[/stockquote]

image

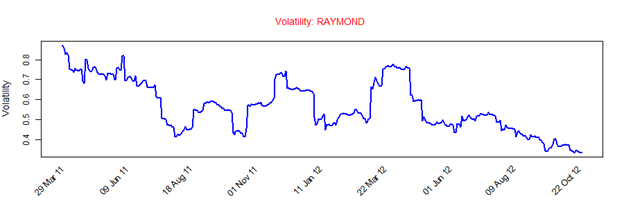
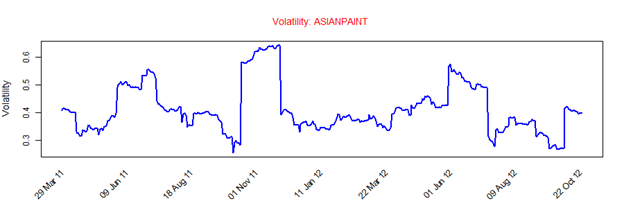
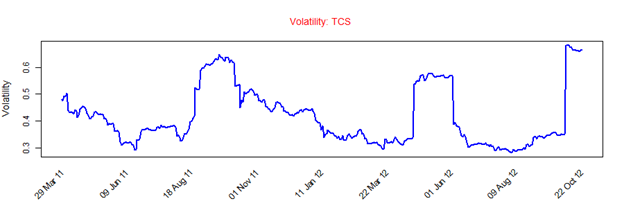
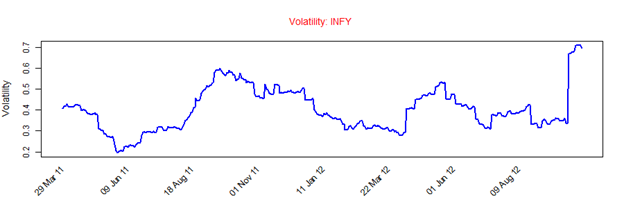
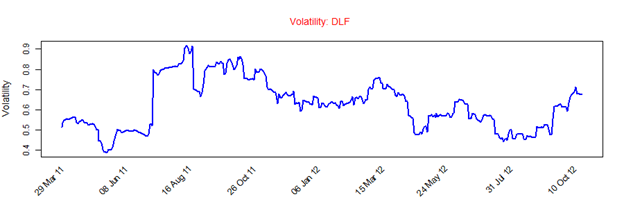
Raymond has a historical volatility in the range of 0.4 to 0.8. The scrip’s volatility is currently on a decline because of the consolidation phase the stock is undergoing.

Looking at these technicals, it appears that the stock is presently in the consolidation territory. A short-term hold is suggested. For the long-term outlook of the scrip, watch the long-term GMMA lines to surface a trend.

Enhanced by Zemanta

Analysis: ASIANPAINT

Today’s pick is [stockquote]ASIANPAINT[/stockquote]. The stock has made a 24% since the 3130 levels of October 2011.

The up-trend since January this year has seen resistance around the 4000 levels twice already; this will act as a near-term resistance level. The longer-term chart shows a support around 2500.

image 

The stock is currently exhibiting a long-term flag formation. A decisive breakout above the 4000 levels can initiate the next leg of up-trend.

image

Oscillators RSI and CMO are at currently at 52 and 6. At this mid-level RSI, the stock has still got around 20 points to reach either oversold or overbought levels. The current mid-range CMO is also unable to suggest any imminent move.

MACD line and signal line are also getting in a twist. The static histogram levels are adding onto the trendless-ness of the scrip.

The GMMA chart although seems to direct a good news for the long-term. The short-term lines are very close to each other and not directing anything, but the expanding long-term lines are giving out a good cue for the scrip. A continuity of the same behavior will decide upon the fate of the stock for the coming months.

image

ASIANPAINT’s average correlation of 0.35 with the Niftybees is positive but not strong. At this level the movements of the stock will not be able to replicate the same magnitude as Niftybees. [stockquote]NIFTYBEES[/stockquote]

image

ASIANPAINT has a historical volatility in the range of 0.2 to 0.7. The scrip’s volatility is currently in the middle of this range.

Looking at these technicals, it appears that the stock is presently in the consolidation territory. A short-term hold is suggested. For the long-term outlook of the scrip, a breakout of the flag in either direction would be a very strong signal.

Enhanced by Zemanta

Analysis: TCS

Today’s pick is [stockquote]TCS[/stockquote]. The stock has made a 29% since the 1020 levels of October 2011.

The up-trend since last year saw a tip-off near 1440 levels recently; this can act as a near-term resistance level for the stock. Although the stock has seen two major corrections in the last year, it is still trading above the near-term support of 1290 (long-term resistance) levels and above the long-term support of 1070 levels.

image

Oscillators RSI and CMO are at currently at 52 and -6. At this mid-level RSI, the stock has still got around 20 points to reach oversold levels. The current CMO level is also not suggesting any imminent move.

The MACD line just penetrated the signal line from below and the histogram levels are on a rise as well. Both these signal are giving a slight signal of a short-term up-trend for the stock.

The GMMA chart currently is not saying anything. Both the long and short-term set of lines are running very close to each other. A departure from the current scenario, either up or down will decide upon the future of the stock.

image

TCS’s average correlation of 0.50 with the Niftybees is positive but not very strong. At this level the movements of the stock will not be able to replicate the same magnitude as Niftybees. [stockquote]NIFTYBEES[/stockquote]

image

TCS has a historical volatility in the range of 0.2 to 0.7. The current high volatility is a result of the EMKAY trades and it should not be a cause of concern.

Looking at these technicals, it appears that the stock is presently trendless. A short-term hold is suggested. The long-term outlook of the scrip will be decided by how long-term lines of GMMA unravel themselves in the coming days.

Enhanced by Zemanta

Analysis: INFY

Today’s pick is [stockquote]INFY[/stockquote]. Even though the stock has experienced a high of 3000 and a low of 2150 during the last 12 months, it is still trading at roughly the same price as it was a year ago.

The stock has seen two drastic gap downs over the last 7 months. The up-trend since mid-July saw a tip-off near 2600 levels which might act as a near-term resistance level.

Looking at the chart for the last 2 months, a head and shoulder top might seem to be in formation if the current up-trend stalls and take a turn around 2450 levels on higher volumes.

image

Oscillators RSI and CMO are at currently at 39 and -30. At this level of RSI, the stock has still got around 15 points to reach oversold levels. The CMO will also take time to reach the oversold side. These technicals are not giving out any signal currently.

MACD line and signal line are closing in towards each other and histogram levels are dropping off as well. The behavior of histogram (a decreasing slope) can act as an early signal of the imminent short-term up-trend.

The GMMA chart for the long term signal is suggesting a change in direction (uptrend since July) for the scrip. The short term lines are moving up again suggesting an up-trend after the last fall. A penetration of the short term lines with good volumes can bring about the up-trend for the stock.

image

Infosys’s average correlation of 0.53 with the Niftybees is positive but not very strong. At this level the movements of the stock will not be of the same magnitude as Niftybees. [stockquote]NIFTYBEES[/stockquote]

image

Infosys has a historical volatility in the range of 0.2 to 0.6. The current volatility is is a result of the EMKAY trades and it should not be a cause of concern.

Looking at these technicals, it appears that the stock is presently nearing oversold territory. A short term buy would be a good idea but for the long term you might want to wait and watch until those long term lines of GMMA dis-entangle themselves to take a stand.

Enhanced by Zemanta

Analysis: DLF

Today’s pick is [stockquote]DLF[/stockquote]. Even though the stock experienced a strong uptrend around June, it is still trading at roughly the same price as it was a year ago. 

image

Oscillators RSI and CMO are at currently at 40 and -39. At this level of RSI, the stock is at oversold levels (according to the historical RSI levels). The CMO is closing in towards the oversold side. Both the technicals are showing a buy signal.

MACD line and signal line are drifting apart from each other and histogram levels are fairly stagnant. The behavior of histogram (a decreasing slope) can act as an early signal of the imminent short-term up-trend.

The GMMA chart is just too messy. The long-term lines are moving close to each other (signaling a probable change of previous trend) and the decreasing separation in the short term lines suggest that the traders should be on a lookout for a spike in volatility in the near-term.

image

DLF’s average correlation of 0.71 with the Niftybees proves to be a strong and positive correlation. At this level the movements of the stock will be of the similar magnitude as Niftybees. [stockquote]NIFTYBEES[/stockquote]

image

DLF has a historical volatility in the range of 0.4 to 0.9. The volatility is currently in the middle range and currently should not be a matter of concern to the traders.

Looking at these technicals, it appears that the stock is presently nearing oversold territory. A short term buy would be a good idea but for the long term you might want to be on your back foot. Resistance levels are around Rs. 240 (Rs. 260 long-term) and a very strong support is visible around 180 levels.

Enhanced by Zemanta