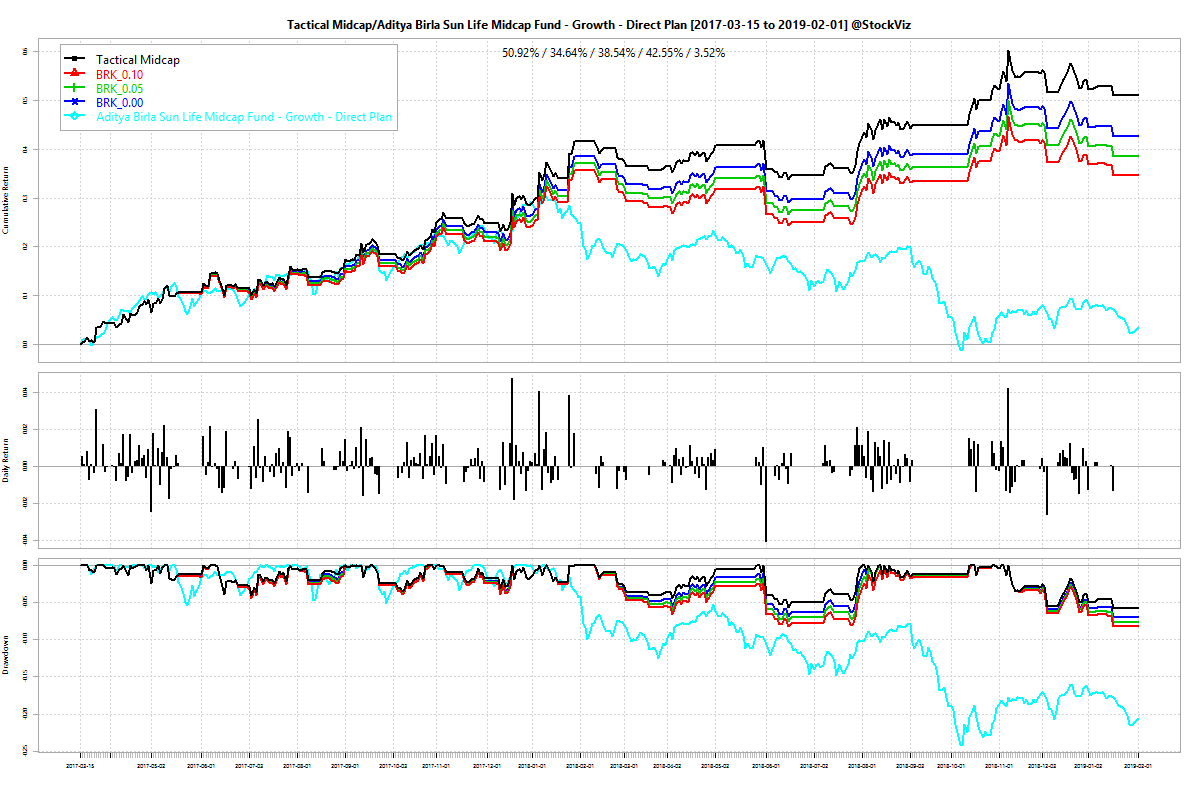
Tag: ETF

Most investors would be better off indexing

If you had invested in this fund in April 2006, would you still be invested in it?

Between 2006-04-03 and 2019-03-08 (13-years), SBI Magnum MIDCAP FUND – REGULAR PLAN – GROWTH has returned a cumulative 268.66% vs. NIFTY MIDCAP 100 TR’s cumulative return of 321.39%. Annualized returns are 10.96% and 11.96%, respectively.

A point of out-performance, a gallon of pain:

Between 2008-01-01 and 2013-01-01 (5-years), SBI Magnum MIDCAP FUND – REGULAR PLAN – GROWTH has returned a cumulative -27.09% vs. NIFTY MIDCAP 100 TR’s cumulative return of -1.54%. Annualized returns are -6.34% and -0.31%, respectively.

When it comes to discretionary active management, the problems are many:

  1. There are over 40 asset management companies. Almost all of them have a midcap fund. Almost all of them claim to be “value” investors.
  2. Value, as described in Graham And Dodd, cannot scale to the 10’s of thousands of crores that these funds collectively manage.
  3. So almost all funds are, at best, index plus a value and/or GARP and/or quality tilt.
  4. And occasionally, fund managers blow it. They hop over to other funds. Or retire.
  5. And occasionally, the investing style goes through a bad patch.
  6. And usually, the business of fund management (accumulating assets) wins over the profession of fund management (superior risk adjusted returns.)

There is no way that any investor can dodge all these minefields. So, the risk that a mutual fund investor takes = market risk + manager risk + style risk + capacity risk.

Investors should primarily allocate to index funds (take only market risk.) Actively managed discretionary mutual funds should be a niche.

EM Bonds out-performed EM Equities the last decade

A recent article in WSJ had this to say about emerging market bonds:

Research on hard-currency bonds since Britain and Prussia defeated France at the Battle of Waterloo in 1815 shows that on average the return from lending to governments issuing external debt in sterling or dollars delivered a return close to U.S. stocks, with lower volatility.

EM bonds giving better returns than US stocks seems counter-intuitive. There is an ETF that tracks the bond index that the article talks about: EMB – iShares JP Morgan USD Emerging Markets Bond ETF. The ETF was launched on December 2007 (not during the Battle of Waterloo,) so we cannot really put that claim to test. However, here are the last 10-years for EMB, EEM (iShares MSCI Emerging Markets ETF) and SPY (SPDR S&P 500 ETF Trust):
ETF.EMB-EEM-SPY.cumulative returns

EM bonds beat EM equities, but not US stocks (SPY). US mega-caps pretty much beat every other equity market. Here are the MSCI indices of USA, WORLD ex US and EM:
USA, WORLD ex-USA, EM cumulative returns

Can’t really single out EM for under-performance when everything trailed. Besides, if you look at performance since 1987, aggregate returns from EM have been on par with those of US with complementary periods:
USA, WORLD ex-USA, EM cumulative returns

So, should you ditch your EM equities portfolio and get into EM bonds and US stocks? Some analysts could look at a decade of EM equity under-performance, point to its valuation spread vs. US mega-caps, and conclude that EMs are a better place to be for the next decade. While others could point out that the US is the home to most of the world’s biggest tech monopolies so it deserves the out-performance. We will only know who is right once 2030 rolls in. Until then, diversify your portfolio and enjoy your life.

Code and annual return charts are on github.

SMA Strategies using ETFs

A simple moving average of an index is nothing but the average of closing prices of that index over a specified period of time. We did a quick backtest to see how an SMA based toggle between going long an index vs. cash performed.

Cumulative returns

NIFTY 50

NIFTY%2050

NIFTY MIDCAP 100

NIFTY%20MIDCAP%20100

NIFTY SMLCAP 100

NIFTY%20SMLCAP%20100

Feasibility

The backtest, unsurprisingly, shows that shorter the SMA look-back period, better the performance. However, the boost in performance comes at the expense of higher number of trades. Lower look-backs are only viable now thanks to brokerages where you would pay zero for these trades (however, you still pay the securities transaction tax.) To see how this would shake out in the real world, have a look at how our Tactical Midcap 100 Theme has performed in the last ~2 years:

The Theme used the M100 ETF (Motilal Oswal Midcap 100 ETF) with a 10-day SMA toggle to switch between the ETF and LIQUIDBEES. The blue line represents zero brokerage and 0.1% STT and the green line represents a brokerage of 5p and 0.1% STT. The chart shows it beating an actively managed midcap fund across all transaction fee scenarios.

The snag is that this strategy is tough to scale. The M100 ETF just doesn’t trade enough for this strategy to absorb more than Rs. 10 lakhs. And there is no small cap ETF on the horizon to implement the strategy in that space.

The second problem is that M100 trades to a wide premium/discount to NAV (see: ETF Premium/Discount to NAV.) This is another layer of risk that an investor could do without.

However, things seem to be moving in the right direction. Reliance Capital launched a new ETF recently that tracks the NIFTY MIDCAP 150 index. Their ETFs usually trade better – tighter spreads, narrower tracking errors, better liquidity. Hopefully, it will emerge as a stronger alternative to M100 and allow these strategies to scale. We setup the Tactical Midcap 150 Theme that uses the RETFMID150 ETF instead of the M100 ETF for those who are interested.

In Part II, we will see how adding a simple check on the SMA can reduce drawdowns.

Code and charts are on github.

MSCI USA Momentum Index

In our previous post, Momentum: Peek under the hood before you invest, we compared a couple of momentum ETFs listed in the US. The most popular one, MTUM, was launched in April 2013. For an investor who is considering it, a five-year sample size is hardly enough. Thankfully, the ETF tracks the MSCI USA Momentum Index. And even though the index itself was launched in February 2013, MSCI has back-filled index levels going back from 1975.

USA Momentum vs. S&P 500 Annual Returns

msci-usa-mom.sp500.annual

USA Momentum vs. S&P 500 Cumulative Returns

msci-usa-mom.sp500.cumulative

It looks like the Momentum Index is highly correlated with the S&P 500 index and for a little bit more volatility, investors end up with quite a bit of excess returns. Does it make sense to swap out the staid old market-cap weighted SPY with MTUM?