Tag: ETF

The Non-Existent ETF Volumes

ETFs don’t trade in India

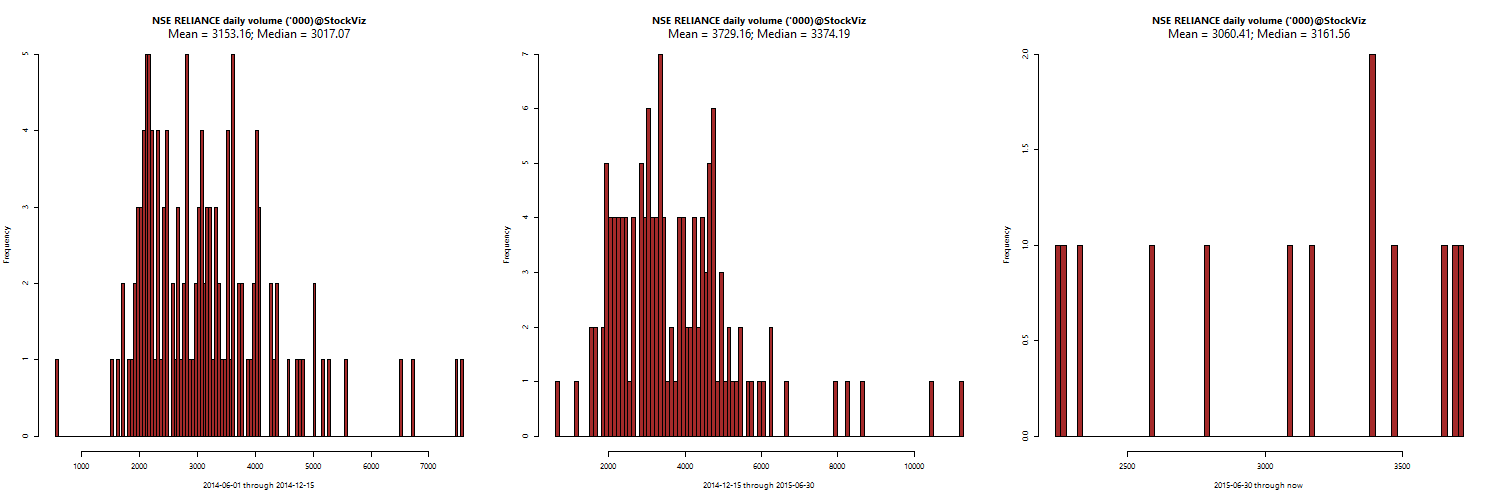
The NIFTYBEES ETF – an ETF that is indexed to the NIFTY – has less daily volume than RELIANCE. Median daily volumes of NIFTYBEES is around 31,000 whereas RELIANCE sees more than 3161,000.

NIFTYBEES:
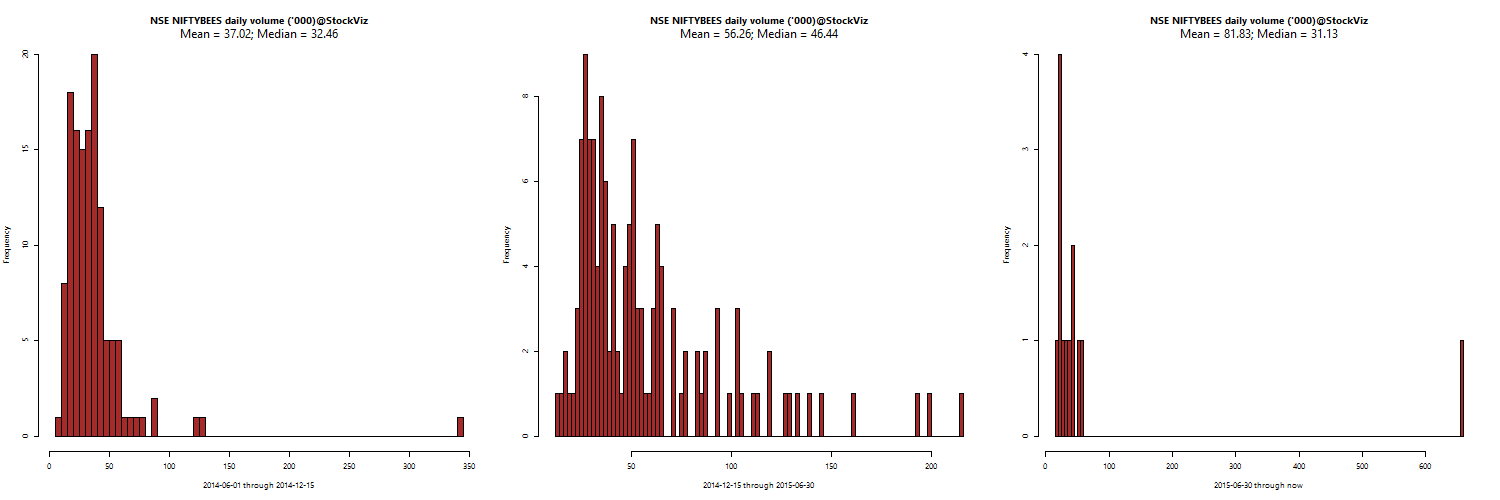
niftybees.volume

RELIANCE:
RELIANCE.volume

In spite of paying dealers to provide liquidity

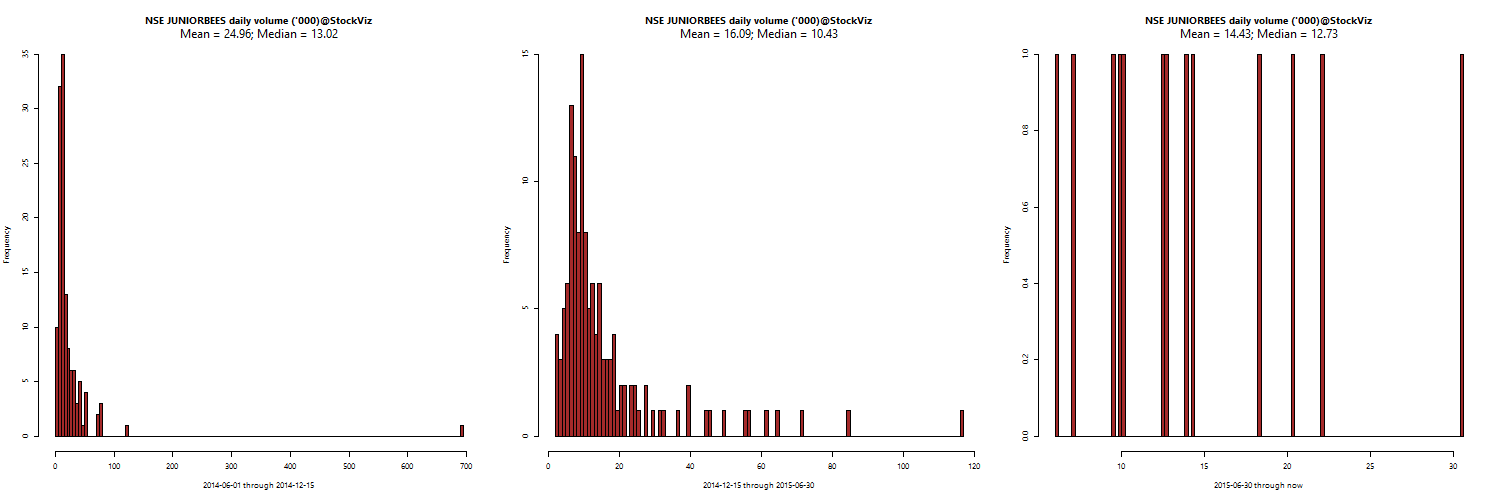
The NSE introduced a Liquidity enhancement scheme (LES) for market making in equity exchange traded funds (ETFs) effective from December 15, 2014 till February 28, 2015. It was then extended to June 30, 2015 (see appendix). The results have been mixed.

BANKBEES:
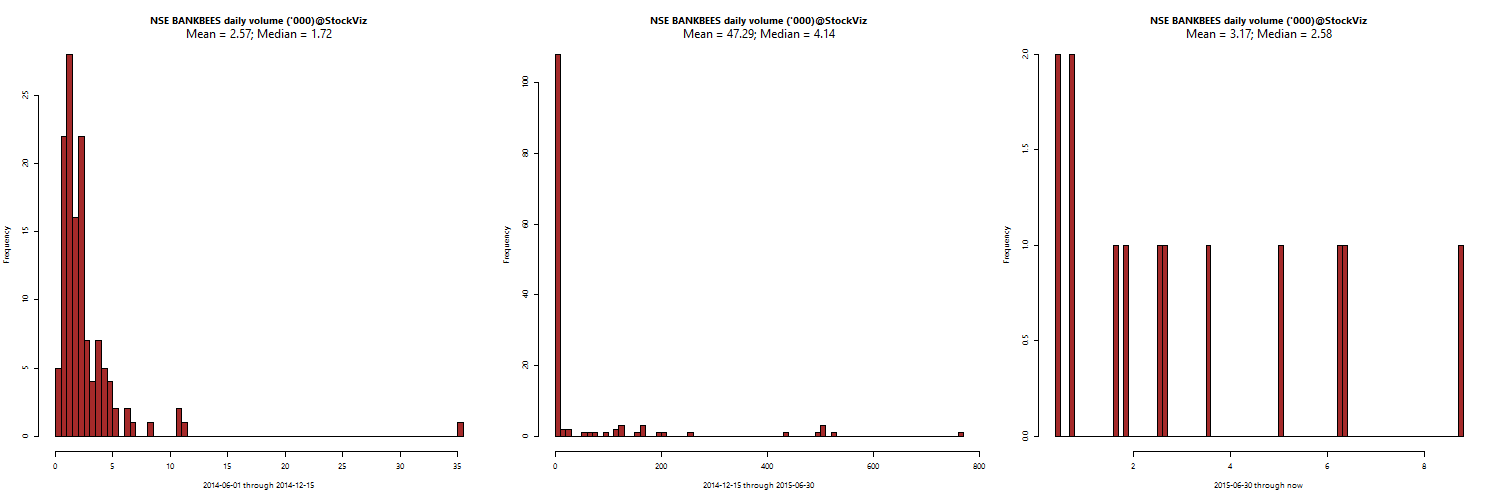
BANKBEES.volume

JUNIORBEES:
JUNIORBEES.volume

M100:
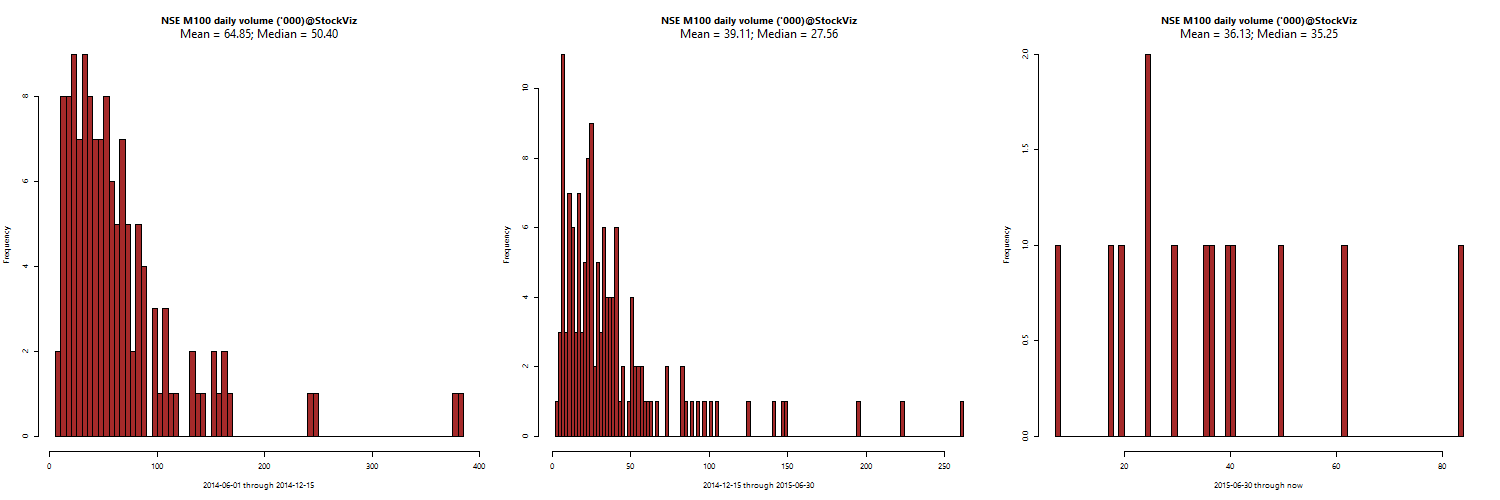
M100.volume

Daily volumes of M100 went down during the program. Here is the full list, volumes in ‘000s:
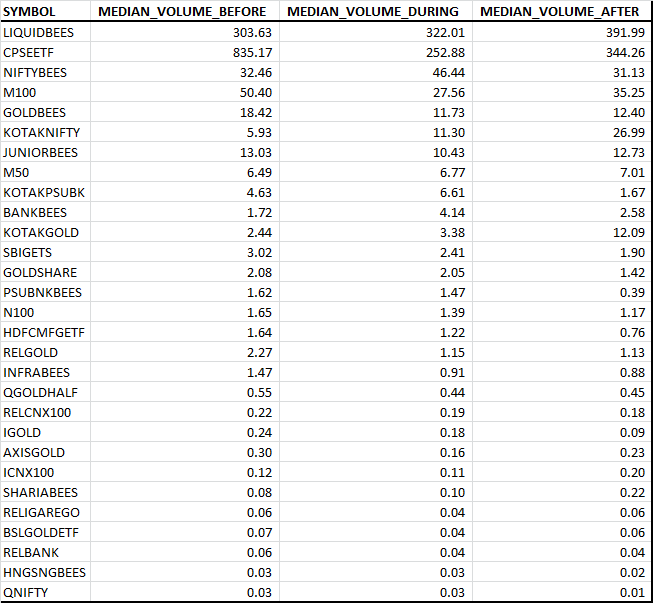
etf volumes

The program might have resulted in tighter bid-ask spreads but there was no surge in volumes. Retail investors remain disinterested in ETFs.

Appendix
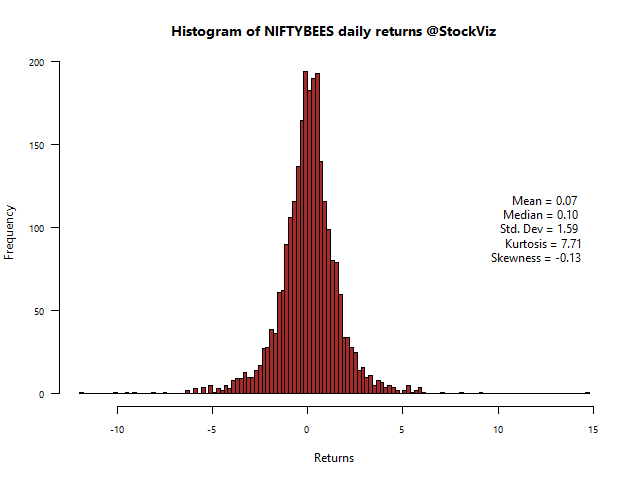

ETFs vs. Indices

ETFs (Exchange Traded Funds) offer investors a convenient way to gain exposure to a particular index. Since these funds are not actively managed, they are measured by their how cheap they are (in terms of asset management fees) and their tracking error. Before we begin, some key terms:

Kurtosis

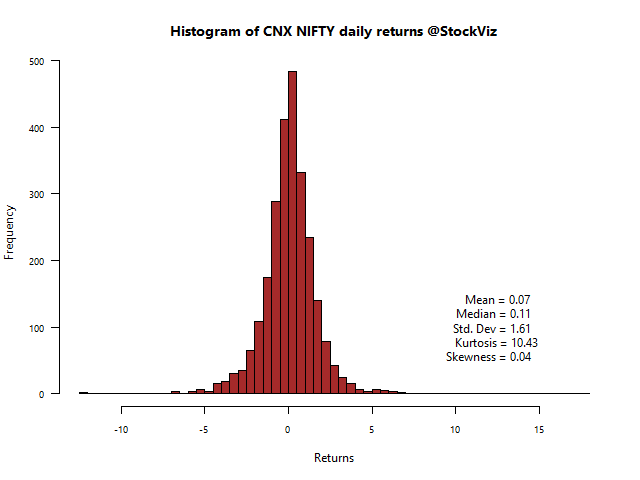
Kurtosis is a measure of “peakedness” of a distribution. For a normal distribution, Kurtosis is 3. Positive excess Kurtosis indicates fat tails while negative indicates peakedness.

Skew

Skewness is a measure of asymmetry of a distribution. Positive skew indicates a long right tail while a negative skew indicates a long left tail.

How effective have Indian ETFs been? Lets pull up some histograms and see for ourselves.

NIFTYBEES vs. CNX Nifty

NIFTYBEES-returns-histogram

CNX NIFTY-returns-histogram

The Nifty ETF actually shows a -ve skew and a lower kurtosis compared to the index. This is how tracking error and fees manifests itself in daily returns. However, their impact on cumulative returns is minimal. The story for less liquid and higher-fee ETFs are different.

PSUBNKBEES vs. CNX PSU BANK

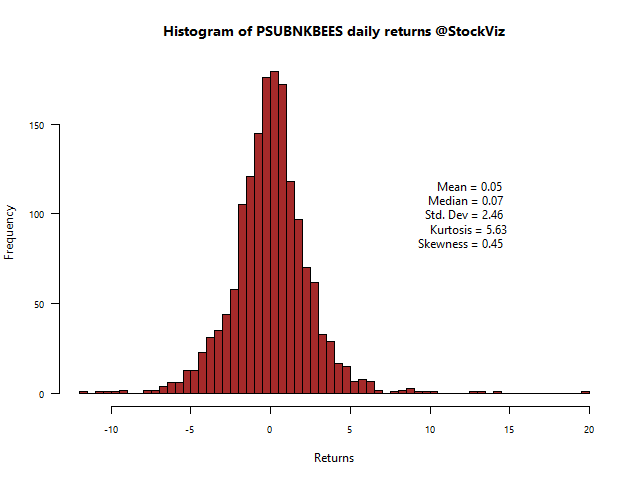
PSUBNKBEES-returns-histogram

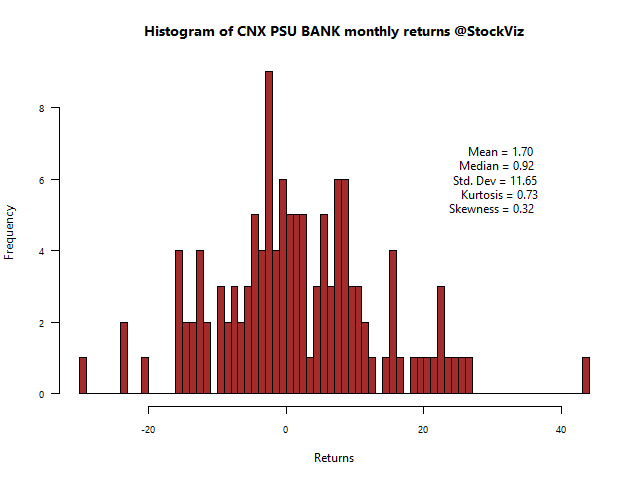
CNX PSU BANK-returns-histogram

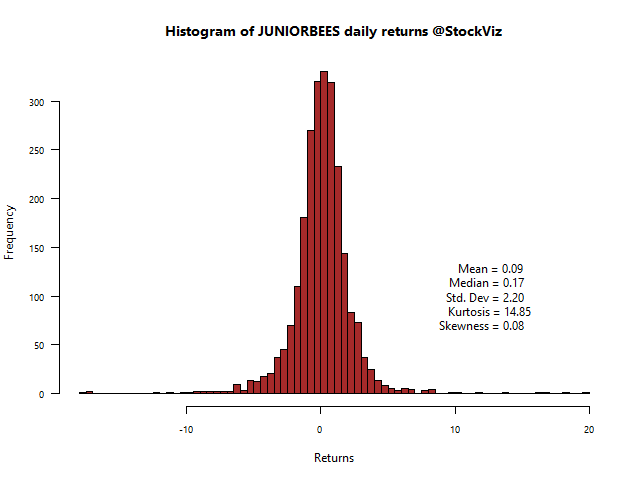
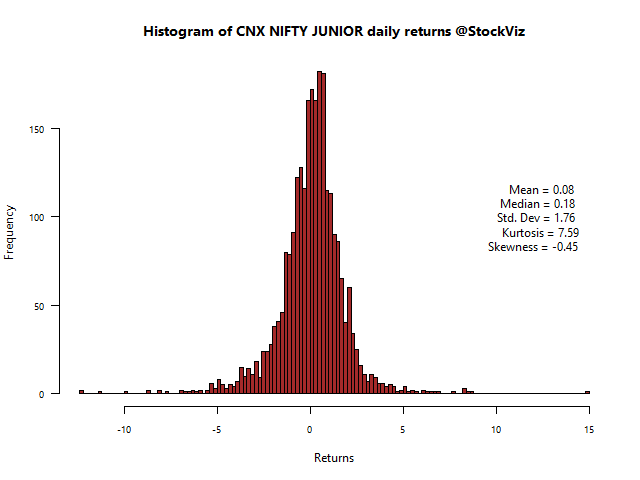
Notice the big difference in kurtosis and skewness? This is tracking error personified. The story for the Juniors’ are not that different.

JUNIORBEES vs. CNX NIFTY JUNIOR

JUNIORBEES-returns-histogram

CNX NIFTY JUNIOR-returns-histogram

Given that there really isn’t much of a push either from investors or from asset management firms on ETFs, the dynamics are unlikely to change in the short term.

To SIP an ETF or Not?

The two holy grails of investing: dollar cost averaging and low-cost investing come together if you systematically invest in an index ETF. We took a look at returns on doing an SIP on JUNIORBEES, an ETF that tracks the Junior Nifty index, that was introduced in 2003.

Summary of Returns

Start Year (Jan) IRR
2004 10.77%
2005 9.48%
2006 8.66%
2007 8.47%
2008 9.81%
2009 8.70%
2010 4.91%
2011 7.40%
2012 8.58%
2013 5.33%

The experiment

The question we set out to answer was: What would typical returns be if you systematically invested in a low-cost index ETF over different periods of time?

So we assume that the investor buys Rs. 5,000 worth of JUNIORBEES at the closing price on the last day of each month. We accumulate the units, the cost basis and the P&L over different periods of time, starting at 2004 and moving forward in one-year increments.

2004 Junior Bees SIP

The dollar cost averaging ensures that you buy more ETF units when the index goes down and less of it when it trades higher. And by tracking the IRR we ensure that we normalize returns for the investment period.

2008 Junior Bees SIP

Conclusion

We expected nominal returns to be higher than what we observed. Between 2004 and 2014, inflation was often running in double digits. So even a 10% IRR would actually be negative real returns. Investors probably would have made better returns if they had kept the money in a bank fixed deposit instead. So from a purely returns perspective, an SIP on an index ETF doesn’t make sense.

Caveat: Just because the real returns were negative with this approach in the past, doesn’t mean that it will be so in the future.

On why passive investing is a risky strategy

If you are buying an investment fund, there are two main strategies you’ll encounter – active management and passive management. Passive investing is essentially the replication of an index or benchmark. For example, buying the NIFTYBEES ETF that replicates the Nifty 50 index. The aim of active investing is to deliver returns that are superior to the stock market that the companies sit within. An actively managed fund can offer you the potential for much higher returns than what a particular market is already providing. The debate as to which of these strategies is better has been raging on for the better part of the last 20 years. Whenever stock-market indices recover from a crash, the debate re-emerges.

The problem with passive investment is that passive management is only theoretically possible.

any evaluation of passive investment funds to be complete should include withdrawal activity during draw-downs, something that can be viewed as active management by the part of the investor imposed on the passive fund.

Also, most funds that call themselves “active” are actually “passive.”

the representation of closet index funds and traditional index funds have risen to the point where they now represent approximately 40% of the active universe—making the exercise of differentiating them from true active managers more important than ever.

Traditional passive investing, using indices weighted according to market capitalisation, works best in the kind of long bull markets that ignore fundamentals, because at the end of the day, you effectively end up buying high and selling low.

Investors should be careful of simplistic arguments and biased data while allocating capital. While I remain a fan of ETFs to get broad-market exposure, it is by no means the be-all-end-all of investment choices.

Sources:
Passive Investing in Stock Indices Involves Substantial Risks
Re-thinking the Active vs. Passive Debate


India ETFs 2011 Scorecard

SYMBOL NAME 2011 Performance
KOTAKPSUBK Kotak Mahindra – PSU Bank ETF -42%
PSUBNKBEES Benchmark – PSU Bank ETF -41%
INFRABEES Benchmark – Infrastructure ETF -40%
RELBANK Reliance – Bank ETF -37%
BANKBEES Benchmark – Bank ETF -33%
JUNIORBEES Benchmark – Nifty Junior ETF -32%
M50 Motilal Oswal – M50 ETF -30%
NIFTYBEES Benchmark – Nifty ETF -24%
SHARIABEES Benchmark – Sharia ETF -20%
HNGSNGBEES Benchmark – Hang Seng ETF -3%
GOLDBEES Benchmark – Gold ETF 29%

If you thought a down 25% was bad, Indian banks took it in the chin in 2011. Public Sector Banks lost about 41% while the sector as a whole shed about 33%. So much for “safe” Indian banks. The actively managed Motilal M50 performed worse than the NIFTY. In spite of the year-end weakness, the yellow metal trounced the rest of the market fair and square.