While introducing S&P 500 sector ETFs, we showed how the cross-correlations between them were unstable. This makes developing simple strategies challenging. One common momentum strategy is to simply go long whatever worked best in the previous period.
Rules of Rotation
For ETFs: XLY, XLP, XLE, XLF, XLV, XLI, XLB, XLK, XLU, and SPY
Calculate rolling returns over n months. Where n = 1, 3, 6, 12.
For the n+1th month, go long the ETF that had the highest return in Step 1.
In Step 2, if the selected ETF has -ve returns, stay in cash and earn zero.
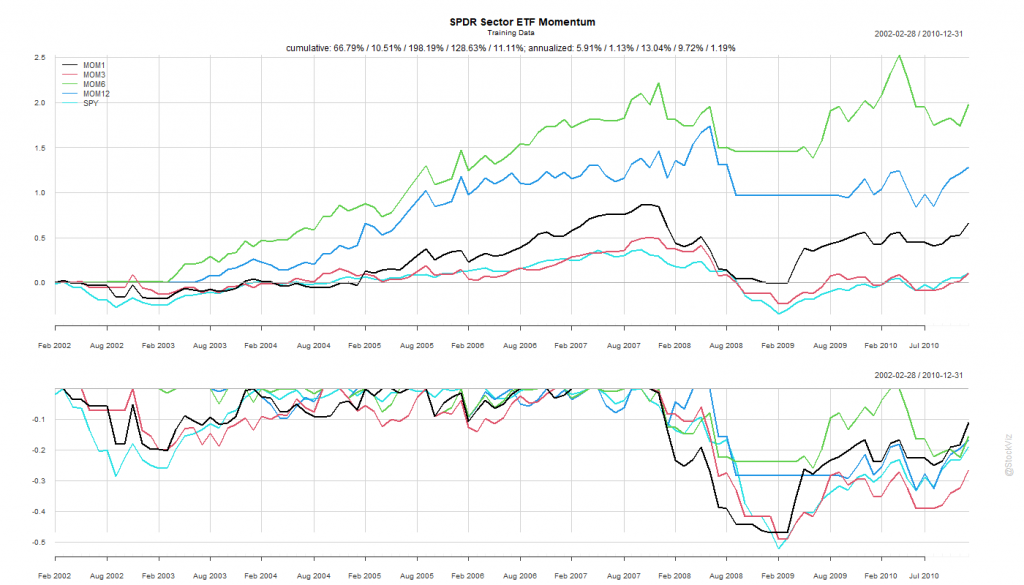
We split the dataset into Before 2010 and After 2011.
Pick your Fighter
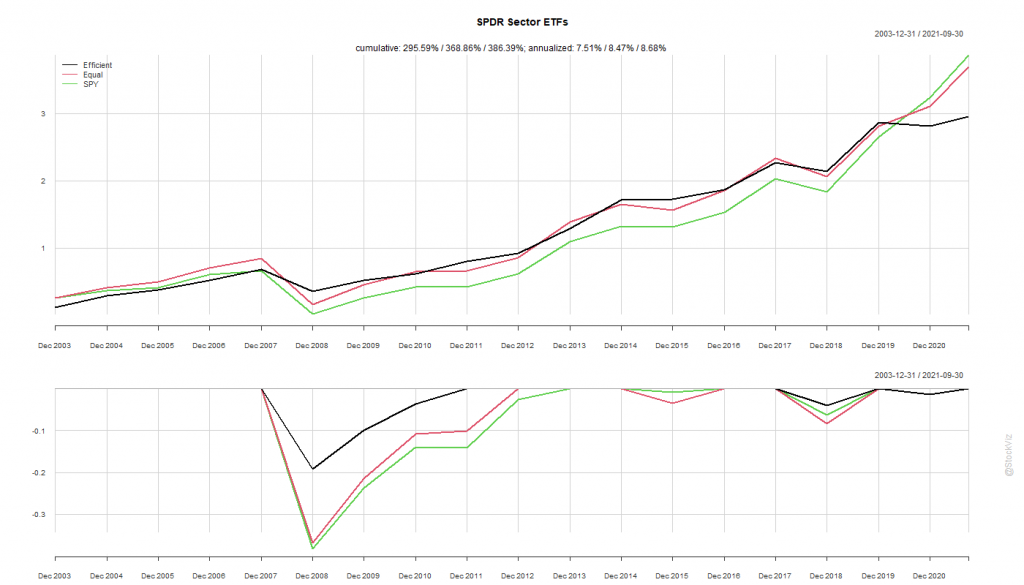
The Before 2010 dataset shows rotation by all look-back periods to be better than buying-and-holding the S&P 500.
Probably because of the prolonged dislocation caused by the GFC in 2008 and 2009, all rotation strategies based on the rules above exhibited great stats.
The 6-month look-back rotation strategy – MOM6 – gave an annualized return of 13.04% vs. S&P 500’s 1.19%. Coming out of the crisis, this would have been the fighter to bet on.
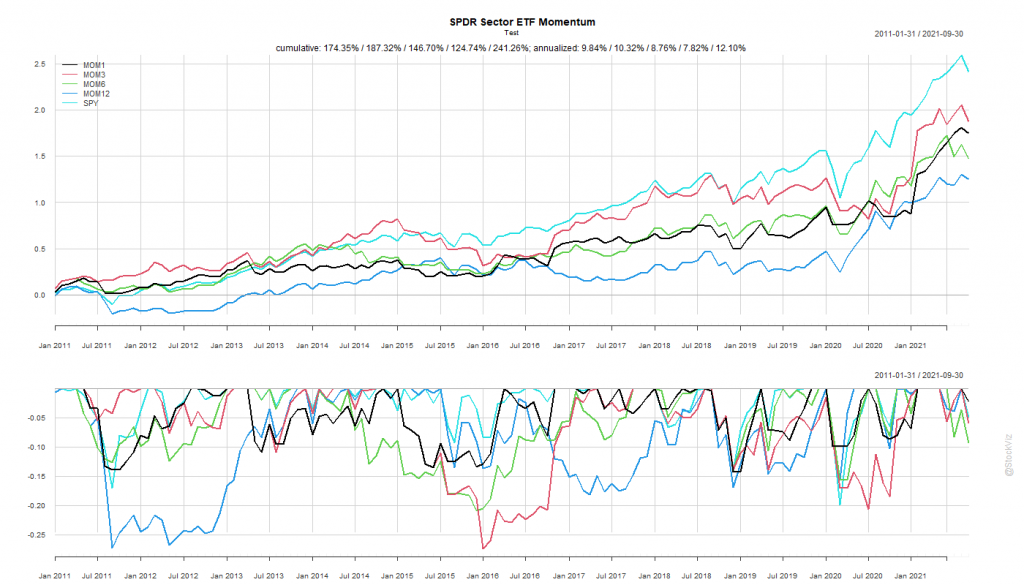
The SPY Rope-a-Dope
In boxing parlance, a “Rope-a-Dope” is
When you maintain a defensive posture on the ropes in an attempt to outlast or tire your opponent. It is most recognized and was actually given that name by Muhammad Ali when he employed the technique to defeat George Foreman.
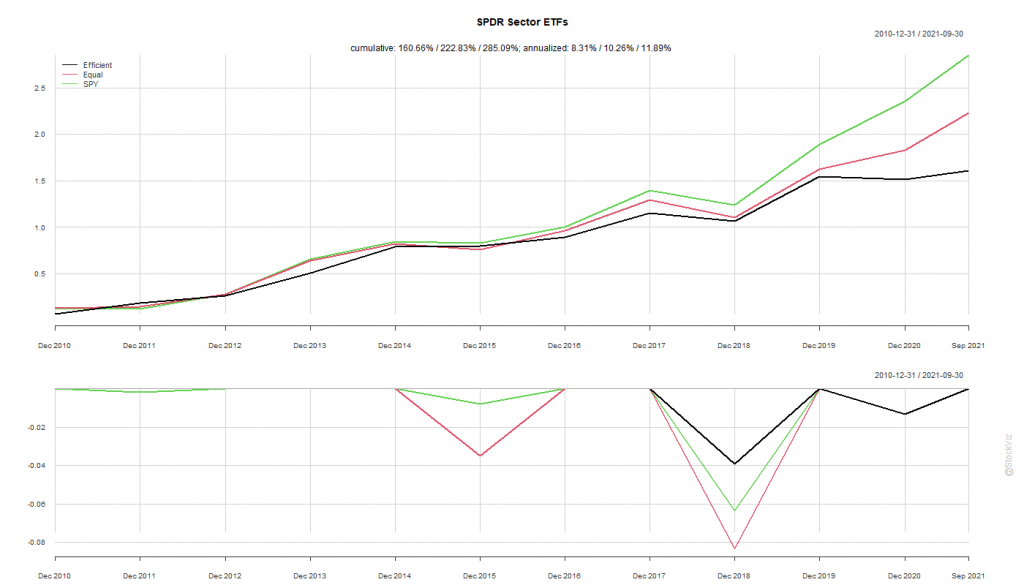
The After 2011 dataset is a prime exhibit of why “sure-things” don’t exist in finance.
The S&P 500 spent the next decade demolishing everything.
MOM6, the winner from our first round, went on to underperform the S&P 500 for the next 10 years by ~4%
By simply holding onto the ropes, a passive buy-and-hold S&P 500 investor would’ve come out miles ahead of someone who employed this rotation strategy.
State Street Global Advisors (SSGA) is known for its monster S&P 500 SPY ETF. With roughly $390 billion in AUM, SPY is one of the largest ETFs out there. Apart from SPY, they are also known for their SPDR “Spider” sector ETFs.
SYMBOL
FUND
LAUNCH_YEAR
XLB
Materials Select Sector SPDR Fund
1998
XLE
Energy Select Sector SPDR Fund
1998
XLV
Health Care Select Sector SPDR Fund
1998
XLI
Industrial Select Sector SPDR Fund
1998
XLY
Consumer Discretionary Select Sector SPDR Fund
1998
XLP
Consumer Staples Select Sector SPDR Fund
1998
XLF
Financial Select Sector SPDR Fund
1998
XLU
Utilities Select Sector SPDR Fund
1998
XLK
Technology Select Sector SPDR Fund
1998
XLRE
Real Estate Select Sector SPDR Fund
2015
XLC
Communication Services Select Sector SPDR Fund
2018
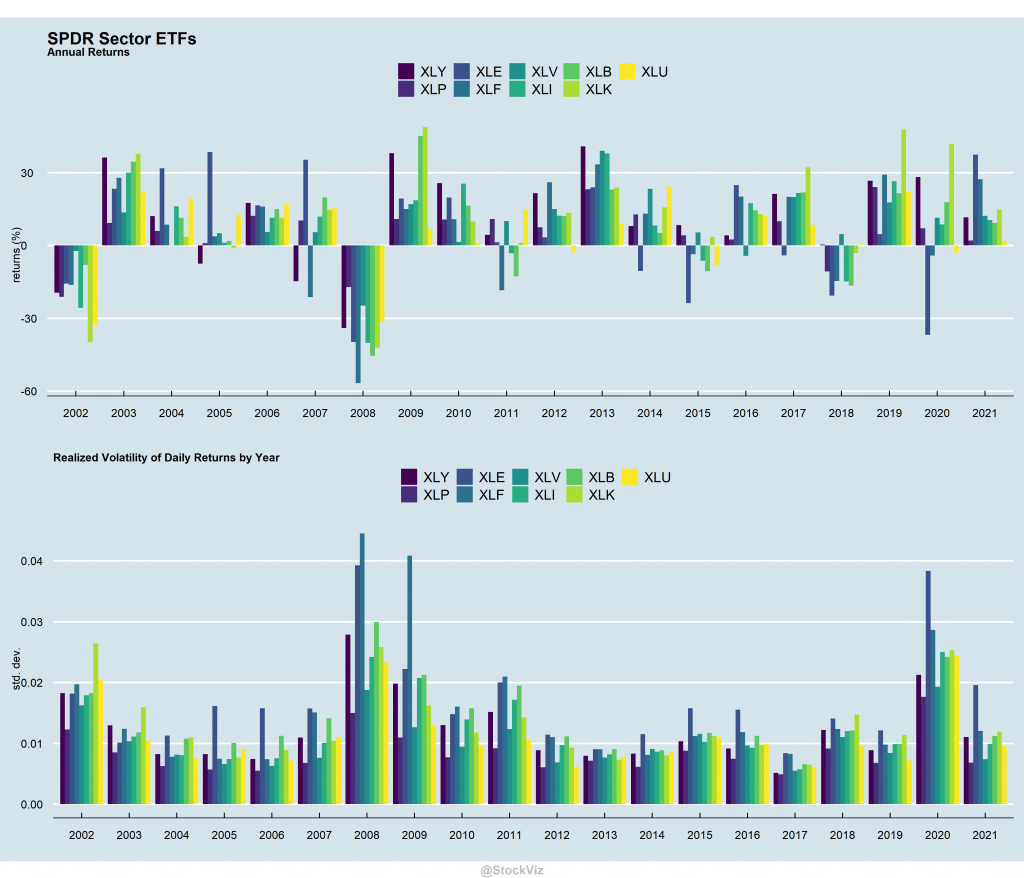
Sector ETFs
These ETFs allow investors to take a concentrated bet on a specific sector and are often used as a benchmark for professionals who specialize in those sectors.
Markets go through cycles where some sectors do well and some don’t. Some sectors are extremely volatile and some barely move.
Cross-correlations are all over the place.
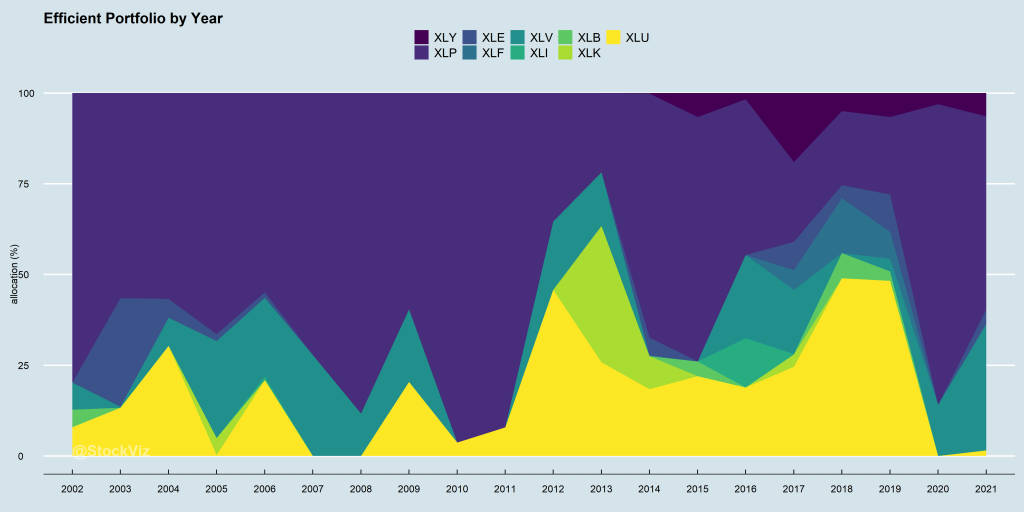
Given unstable cross-correlations and volatility, a naïve use of optimizers is a bad idea. For example, if you use these as inputs to generate an “efficient” portfolio, the weights wary widely from year to year.
Consumer Staples (XLP) ends up gobbling up most of the allocation, followed by Utilities (XLU.) The performance of such a portfolio depends on what you are looking for.
The efficient portfolio, given its large exposure to staples and utilities, has experienced lower drawdowns than both equity-weighted and S&P 500. This shows up in their Sharpe Ratios.
For the longest time in the US, actively managed mutual funds ruled the roost. Then came Jack Bogle with his index fund and the ceaseless mantra of “costs and taxes matter” and the dynamic shifted, slowly at first and then suddenly, in favor of indexing. It was only a matter of time before people figured out the tax loophole of ETFs and now, there are over 2500 ETFs listed in the US.
Unlike in India, where mutual funds are “pass through,” US mutual fund investors pay capital gains tax on assets sold by their funds. When there are large-scale redemptions, say, during a market melt-down, funds are forced to sell their holdings. This generates capital gains taxes, meaning that investors have to pay tax on assets that had fallen sharply in value1.
ETFs, on the other hand, don’t have to subject their investors to such harsh tax treatment. ETF providers offer shares “in kind,” with authorized participants serving as a buffer between investors and the providers’ trading-triggered tax events.
A Plethora
Of the ETFs that survive today, the number of launches every year has trended higher.
While Equity ETFs dominate launches, the share of fixed income, alternatives, etc. has increased as well.
Most of the AUM resides in “vanilla” strategies – typically market-cap based.
The winner HAS taken all
Plot the assets of each ETF, in billions, in log-scale and you can tell that this is a game of scale.
Of the total 2577 ETFs, 2022 (78.5%) have less than a billion dollars in assets. You need to filter for $10 billion and up to just see the x-axis.
The top 3 issuers: Blackrock, Vanguard and SSGA manage ~80% of all ETF assets.
Where there is an ETF, there’s an Index
Until last year, ETFs were supposed to be a “passive” entity. There were no “actively managed” ETFs. In order to be passive, an ETF needed to follow an index. And indices had to be rules based – however convoluted the rules. And issuers needed a third-party to provide the index.
The rise of ETFs (and passive investing, in general) put index providers in the middle of all the a action. They became a crucial cog in world finance that can make or break entire economies. So powerful, in fact, that China blackmailed MSCI to include its domestic stocks in its Emerging Markets Index, which is tracked by close to $2 trillion in assets2. And India has been working on inclusion of Indian sovereign bonds in global bond indices3.
We can see industry consolidation here as well. The top 5 index providers control ~75% of ETF AUM (more if you include index funds.) S&P Global and MSCI are as close to “pure-play” index providers as you can get and their stock market performance is off-the-charts.
Fee Squeeze and Innovation
The problem with index ETFs/funds is that buyers only care about two things: expense ratio and tracking error. This resulted in a massive fee war that saw the vanilla-passive industry consolidate around Blackrock and Vanguard. For example, Vanguard’s S&P 500 ETF’s expense ratio is 3bps.
So, what next?
International ETFs
The first wave was ETFs providing international diversification. However, the “home-bias” is pretty strong with AUM under international ETFs barely making a quarter of the total.
On a weighted average basis, these ETFs charge about 30bps. However, since these are mostly cap-weighted, the fee-war is just as intense here.
Leveraged/Inverse ETFs
Many investors have mandates that prevent them from trading derivates outright. This is especially true for Indian investors taking the LRS route to invest in the US. However, Wall Street has your back.
Leveraged ETFs give you 2x or 3x the daily returns of a benchmark index like the S&P 500 or the Nasdaq 100. Feeling bearish? Inverse ETFs do the opposite.
Caveat: These are NOT buy-and-hold investments and are more suitable for day-traders. The discussion requires a separate post.
On a weighted average basis, these ETFs charge about 100bps. While lucrative, they are mostly niche.
Active ETFs
An ETF’s tax-free wrapper make it an order of magnitude more attractive than an identical mutual fund. New issuers/managers have taken advantage of this and launched actively managed ETFs.
On a weighted average basis, active ETFs charge about 50bps. These are still early days for this category – they barely make 5% of total ETF assets. Liquidity and tracking errors during market crisis are yet to be tested.
Conclusion
There is a plethora of choices when it comes to ETFs in the US. If you plan to wander away from the plain-vanilla stuff, please take the time to read the prospectus and understand how it works.
If you are looking for simple, pre-canned investment strategies to invest in the US, check out freefloat.us
Over the last few years, most brokers in the US have started offering no-frills accounts with zero-brokerage and fractional shares. However, new investors who are just getting started are either over-served by advisors or under-served by social media. In this post, we list out ETFs that every investor should be aware of if they are interesting in building a diversified portfolio.
We filtered for
Assets under management (AUM) – larger the better
Cost (expense ratio) – lower the better
Liquidity and popularity – higher the better
We cover equities, bonds, real-estate and commodities across the US, DM (Developed Markets) and EM (Emerging Markets.)
VTI
The Vanguard Total Stock Market Index Fund ETF is a $250 billion whale of a fund that is probably the only equity ETF a small-ticket first-time investor should consider.
Covering the entire US equity market, it is as passive as they come. With an expense ratio of 3bps (you pay $3 for every $10,000 investment,) it is the cheapest as well.
The iShares Core U.S. Aggregate Bond ETF is one of the largest bond ETFs on the planet with $90 billion in assets. It has everything from treasuries, agencies, CMBS and ABS to investment-grade corporates. You pay 4bps for the privilege.
Split your funds 60% into VTI and 40% into AGG and you basically have a portfolio that has traditionally outperformed 99% of the hedge funds out there.
With the Big Two out of the way, if you still have some risk appetite and time on your hands, you can reach out for more returns (potentially.)
SCHF
The Schwab International Equity ETF tracks all Developed Markets other than the US. With an AUM of $27 billion and an expense ratio of 6bps, it is a decent equity fund if you feel that US stocks are over valued.
Its largest exposure is to Japanese stocks followed by British, France, Germany, Canada and Switzerland. Unlike some other funds in this space, it also includes South Korea.
One caveat though, the fund is not currency hedged. The topic of buying hedged vs. unhedged ETFs is a topic that we will not get into right now. Suffice to say that hedging is not free – it is a price you pay to insulate yourself from fluctuations and you should weigh the cost vs. its benefits over your investment time horizon.
The Vanguard Total International Bond ETF provides exposure to Developed Market (ex-US) investment-grade government and corporate bonds. It is a monster of a fund with $136 billion in assets. An 8bps expense ratio is a wonderful bargain.
We are not fans big fans of EM/FM (Emerging/Frontier Markets) investing from the US through ETFs. In the recent past, these markets have only been a source of risk and not returns. Gains in local currencies, when converted to US Dollars, haven’t compensated for the additional risk. However, for investors who believe that the future is going to be different, these ETFs are worth considering.
EEM, EMXC and FRDM
The iShares MSCI Emerging Markets ETF is perhaps the largest in this space. $32 billion in AUM and a 70bps expense ratio, it is the go-to ETF for EM investors.
However, the wrinkle is that Hong Kong and China form more than 37% of the portfolio. For investors worried about geopolitical risk, this may be a point of concern. This is where EMXC comes in.
The iShares MSCI Emerging Markets ex China ETF is a minnow by comparison (less than $1 billion in AUM) but it doesn’t include China and Hong Kong, making it palatable. However, there’s another wrinkle while investing in EM – some of those countries are ruled by despots. What if you want to invest in EMs that are democratic and respect personal freedom? Enter FRDM.
The Freedom 100 Emerging Markets ETF tracks the Life + Liberty Freedom 100 Emerging Markets Index. The Index is a freedom-weighted EM equity strategy that uses human and economic freedom metrics as primary factors in the investment selection process. And this means excluding China, Hong Kong and India – 3 of the largest markets in EM.
The iShares JP Morgan USD Emerging Markets Bond ETF an index of US-dollar-denominated sovereign debt issued by EM countries. It holds USD-denominated rather than local-currency debt. This eliminates direct currency risk for US investors. With $20 billion in AUM and an expense ratio of 39bps, its an attractive fund for investors looking to diversify into EM bonds.
Now that we have equities and bonds out the way, lets look at real estate. A REIT is a publicly traded security that invests in real estate through properties or mortgages. For the most part, in the past, their returns were correlated to interest rates. From investopedia: In a study done by the S&P, which analyzed six periods beginning in the 1970s where the yield of the 10-year Treasury grew significantly, of these six periods of interest rate increases, REIT returns increased during four of them.
VNQ and VNQI
VNQ, The Vanguard Real Estate ETF has about $75 billion in AUM and charges 12bps. It captures much of the US real estate market.
VNQI, Vanguard Global ex-U.S. Real Estate ETF has about $5 billion in assets and an order-of-magnitude larger than the closest alternative. It contains property companies from both developed and emerging countries, excluding the United States. Japan, China and Hong Kong are the top three geographies where it invests. Like with any other EM/FM investments, caveat emptor!
Some investors view gold as a tail-risk and inflation hedge and some prefer to add commodities to their portfolio to ride on emerging market demand. While it is debatable whether these assets live up to their expectations in the future, there have been lengthy stretches in the past where gold and commodities have outperformed other asset classes.
GLD and PDBC
GLD tracks the gold spot price, less expenses and liabilities, using gold bars held in London vaults. With about $65 billion in management and 40bps in expense ratio, its probably the best way to add exposure to the yellow metal in your portfolio.
PDBC holds a diverse basket of futures contracts on 14 commodities across the energy, precious metals, industrial metals and agriculture sectors. Has about $6 billion in AUM and its 59bps expense ratio is a bargain compare to the effort involved in actively managing a futures portfolio in a tax-efficient manner.
There are over 2500 ETFs listed in various US stock exchanges. We hope that our short list of 12 ETFs above helps investors get started. Do watch the discussion below:
Already have a basic portfolio and looking for quantitative strategies on US stocks and ETFs? Head over to freefloat.us
A wise man once said, the decision to go passive is a very active one.
At first, going passive meant buying and holding a broad-based index fund. But that was over 40 years ago. Since then, in the US, the market has evolved and the number of indices, index funds and ETFs have exploded. Think of a theme, strategy, asset class, market or geography, there is an ETF for that.
As of today, there are 2,319 ETFs in the US. And given the intense competition over the last decade, fees have been driven to single-digit basis-points in most cases. Given this fee pressure, US based issuers looked east and landed on Europe a couple of years ago. And there too, competition quickly reduced fees and expanded access.
The next big virgin market is India.
Given this back drop and the small but increasing interest in passive indexing, if a DIY investor wishes to just buy and hold a market-cap based index, which one should she buy?
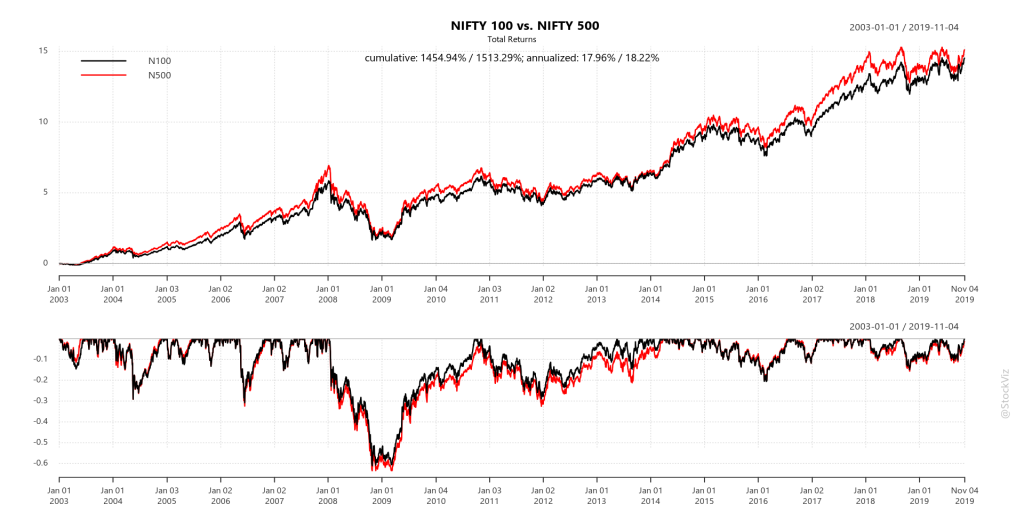
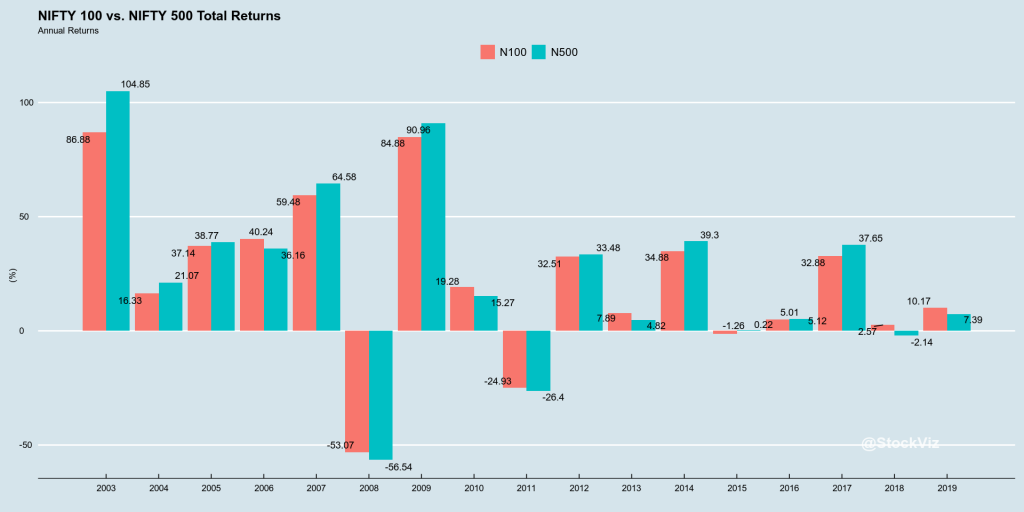
The most practical choices boil down to NIFTY 50, NIFTY NEXT 50 (collectively forming the NIFTY 100) and the NIFTY 500 indices.
Given the fee differentials between the NIFTY 100 and NIFTY 500 based ETFs/funds, the big question to ask is: Is there any advantage of reaching below the 100 mark? Is 100 enough?
Market-caps follow a power-law. For NIFTY 100, 80% of the index is covered by the top 35 stocks and for NIFTY 500, the number is 82. So unless the rest of the stocks in the index deviate to an extreme degree in terms of total returns (change in price + dividends,) the top 35/80 stocks power most of the returns.
Cumulative ReturnsAnnual Returns
So, the answer is No. Unless NIFTY 500 based ETFs/funds achieve fee and liquidity parity with the NIFTY 100 based ones, investors are not missing out on anything by sticking with the mega-caps.
Check out the goodies on pluto. Questions? Slack me!