Equities
| MINTs | |
|---|---|
| JCI(IDN) | -0.27% |
| INMEX(MEX) | -2.26% |
| NGSEINDX(NGA) | +0.14% |
| XU030(TUR) | -4.70% |
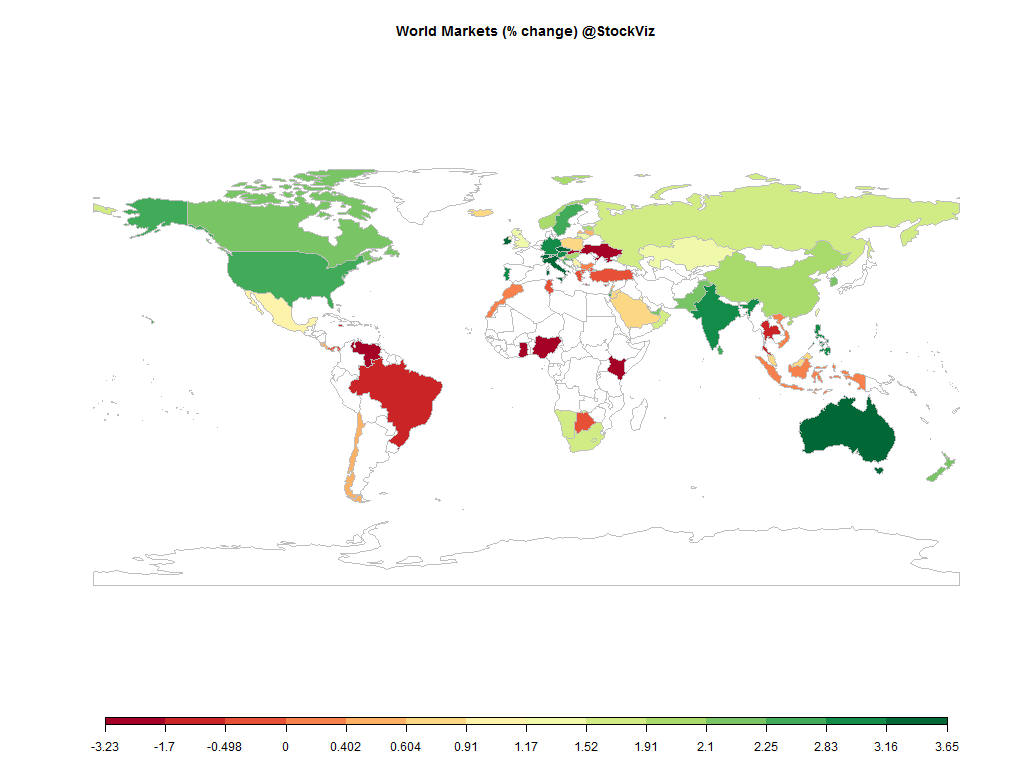
| BRICS | |
|---|---|
| IBOV(BRA) | -6.06% |
| SHCOMP(CHN) | +2.87% |
| NIFTY(IND) | -1.03% |
| INDEXCF(RUS) | -3.30% |
| TOP40(ZAF) | -2.54% |
Commodities
| Energy | |
|---|---|
| Ethanol | -4.06% |
| RBOB Gasoline | -4.46% |
| Brent Crude Oil | -4.02% |
| Heating Oil | -1.74% |
| WTI Crude Oil | -5.35% |
| Natural Gas | -2.77% |
| Metals | |
|---|---|
| Gold 100oz | -3.05% |
| Palladium | +1.49% |
| Platinum | -1.18% |
| Silver 5000oz | -1.35% |
| Copper | -4.80% |
Currencies
| MINTs | |
|---|---|
| USDIDR(IDN) | +0.70% |
| USDMXN(MEX) | +2.26% |
| USDNGN(NGA) | -0.03% |
| USDTRY(TUR) | +3.28% |
| BRICS | |
|---|---|
| USDBRL(BRA) | +4.95% |
| USDCNY(CHN) | +0.00% |
| USDINR(IND) | +0.90% |
| USDRUB(RUS) | +2.83% |
| USDZAR(ZAF) | +2.53% |
| Agricultural | |
|---|---|
| Coffee (Arabica) | -4.47% |
| Coffee (Robusta) | -0.56% |
| Corn | -6.67% |
| Cotton | +0.03% |
| Wheat | -7.62% |
| White Sugar | -3.08% |
| Orange Juice | +2.83% |
| Feeder Cattle | -2.46% |
| Cattle | -2.62% |
| Cocoa | -3.88% |
| Lean Hogs | +2.41% |
| Lumber | -4.10% |
| Soybean Meal | -1.83% |
| Soybeans | -2.34% |
| Sugar #11 | -5.94% |
Credit Indices
| Index | Change |
|---|---|
| Markit CDX EM | -0.39% |
| Markit CDX NA HY | -0.72% |
| Markit CDX NA IG | +3.51% |
| Markit iTraxx Asia ex-Japan IG | -0.56% |
| Markit iTraxx Australia | -2.39% |
| Markit iTraxx Europe | -0.14% |
| Markit iTraxx Europe Crossover | +7.87% |
| Markit iTraxx Japan | -1.57% |
| Markit iTraxx SovX Western Europe | +1.59% |
| Markit LCDX (Loan CDS) | +0.00% |
| Markit MCDX (Municipal CDS) | +0.01% |
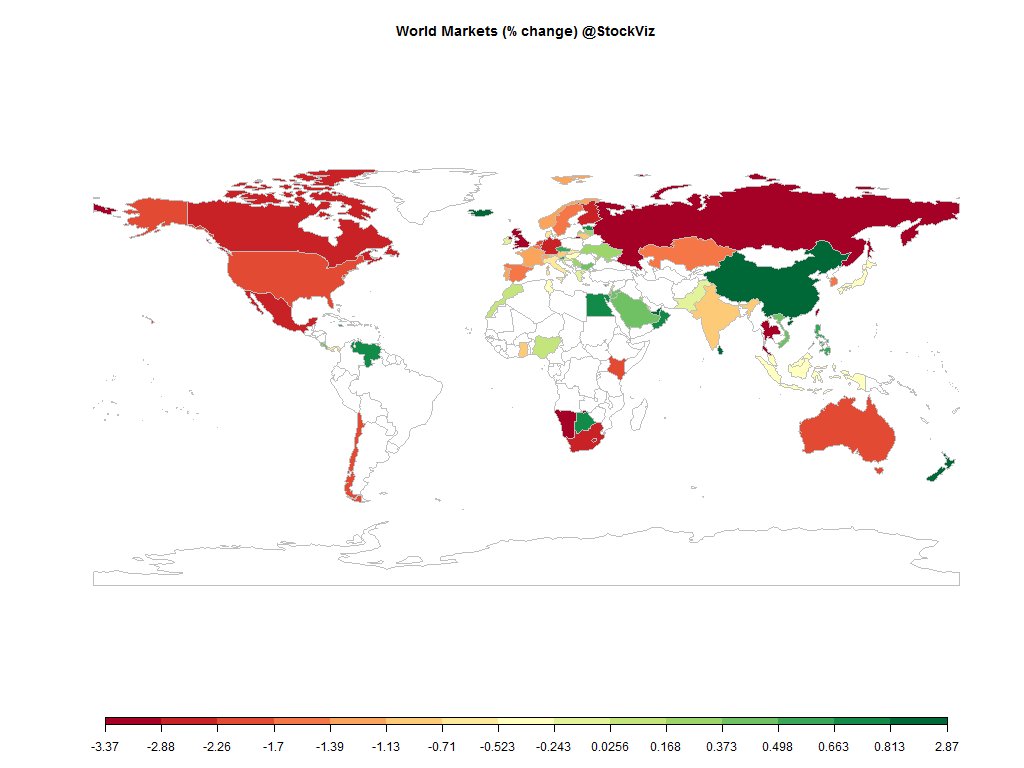
An uneasy week that saw most indices weak. The entire commodity complex came crashing down. Gold, copper, silver, oil, grains… pretty much every commodity was down.
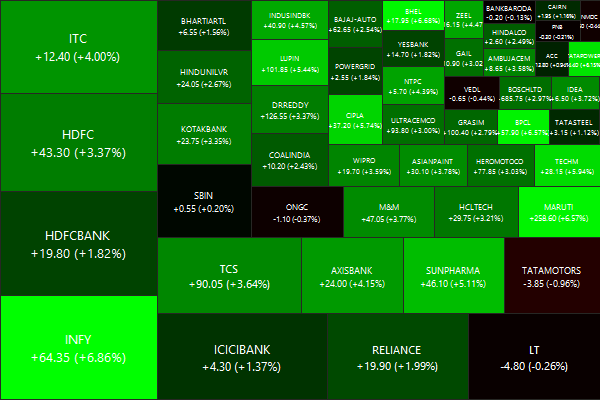
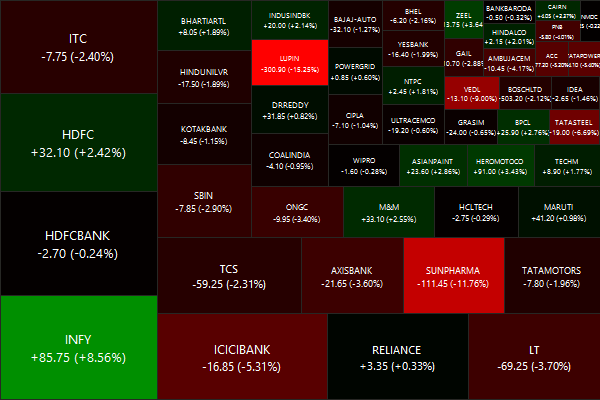
Nifty Heatmap
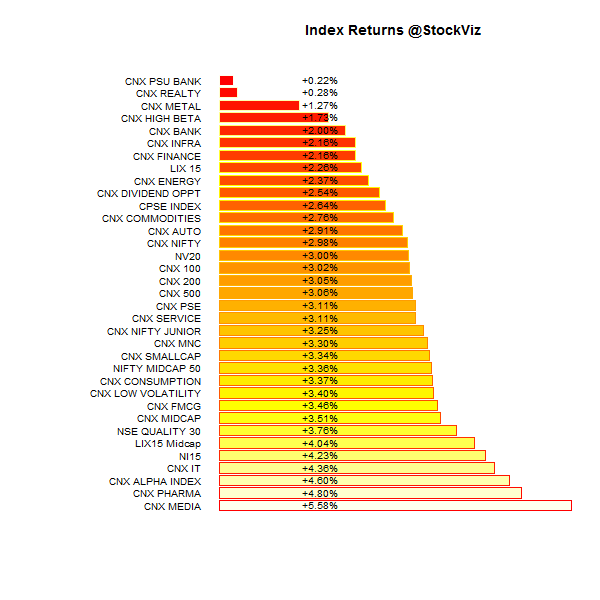
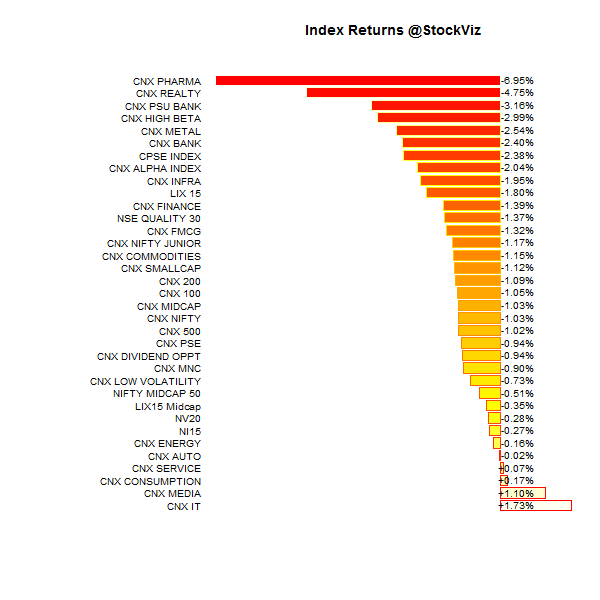
Index Returns
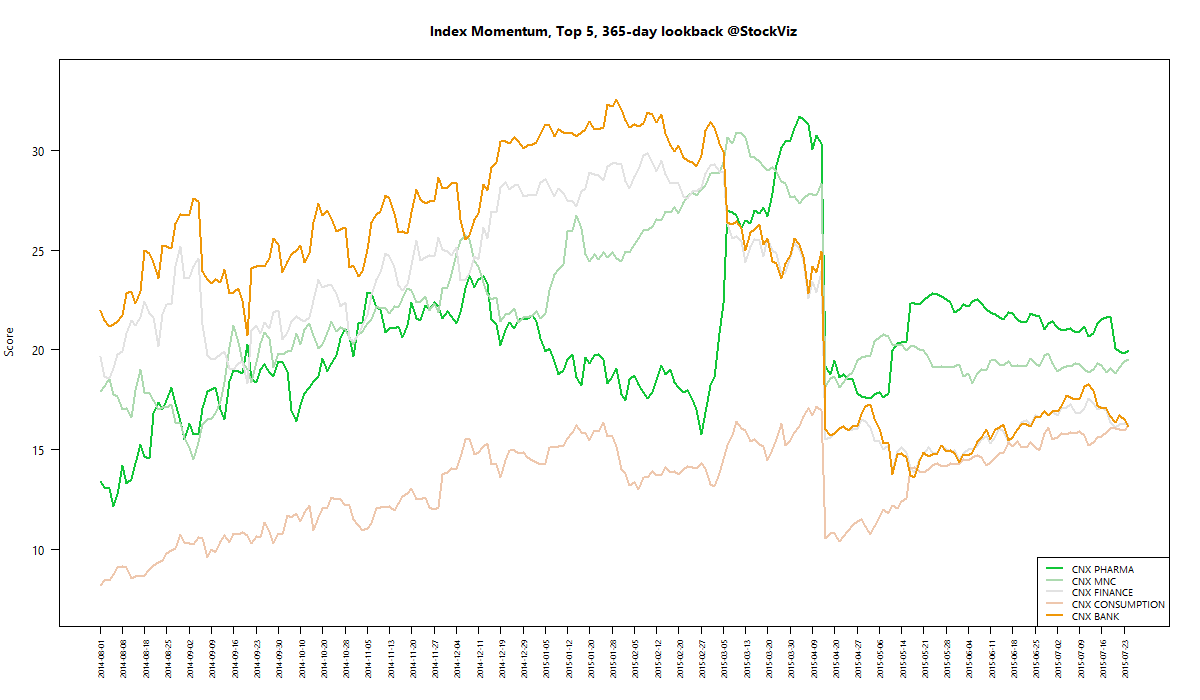
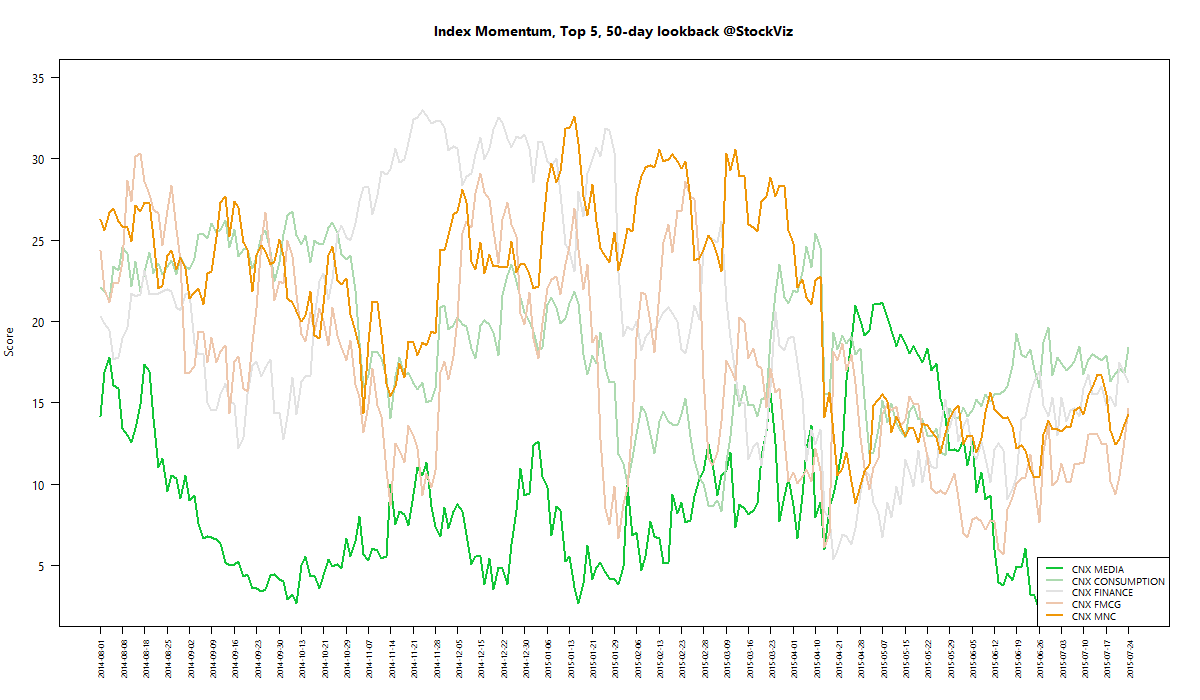
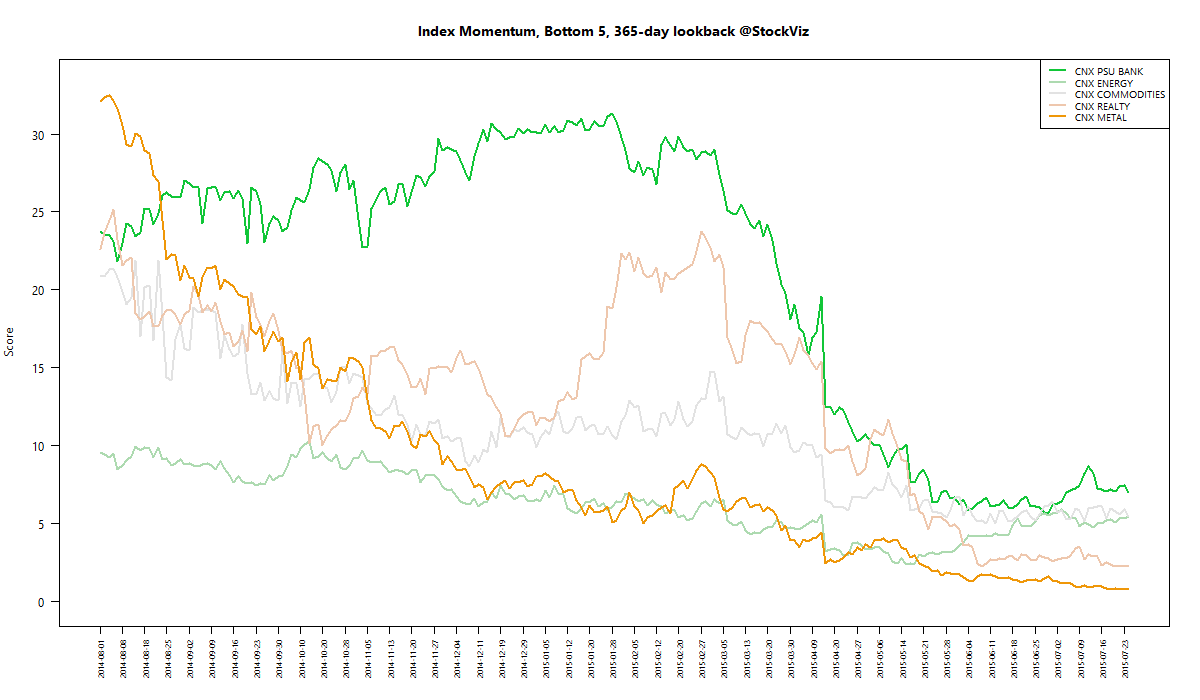
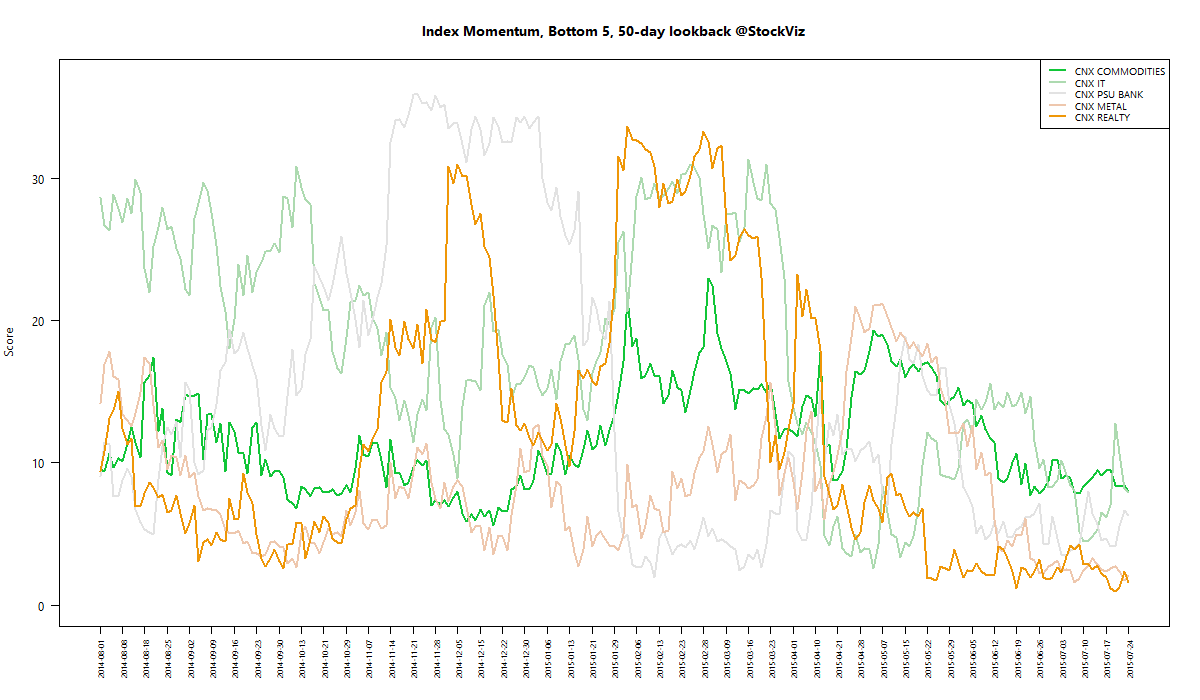
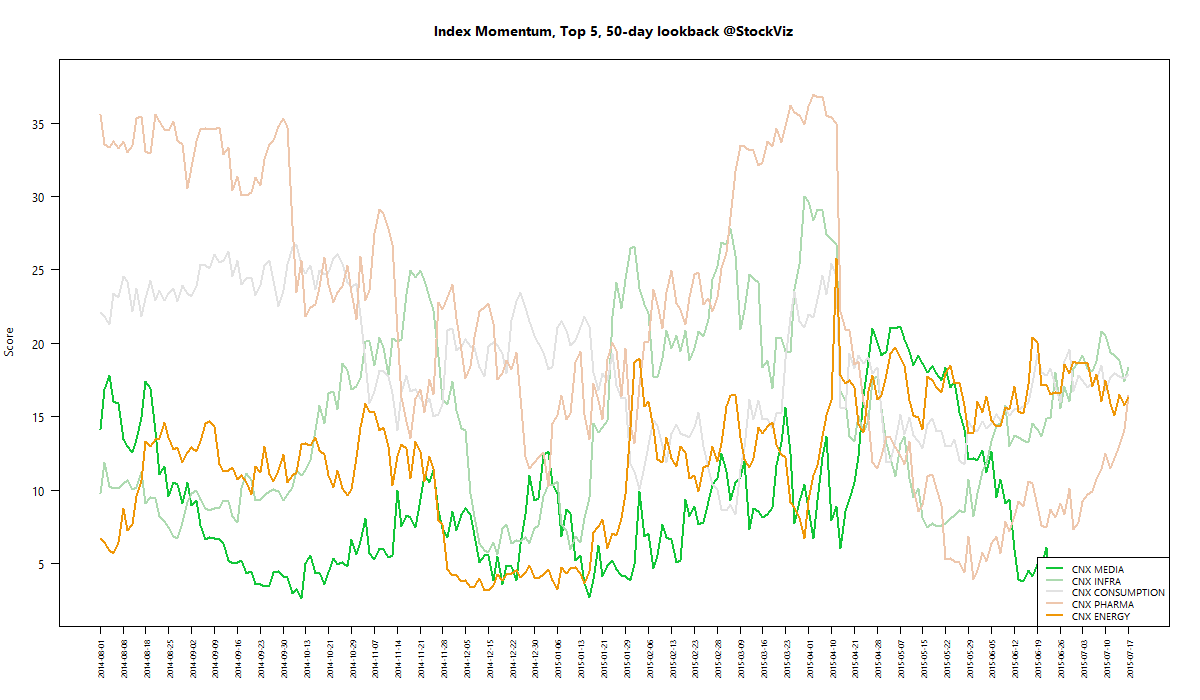
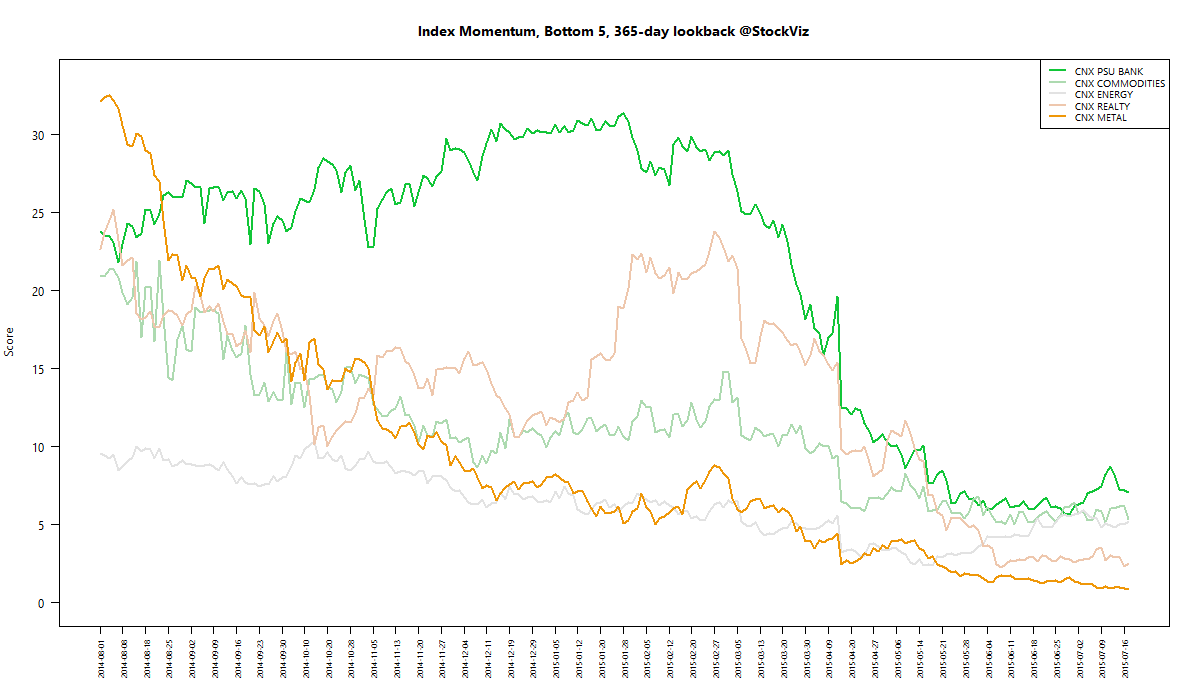
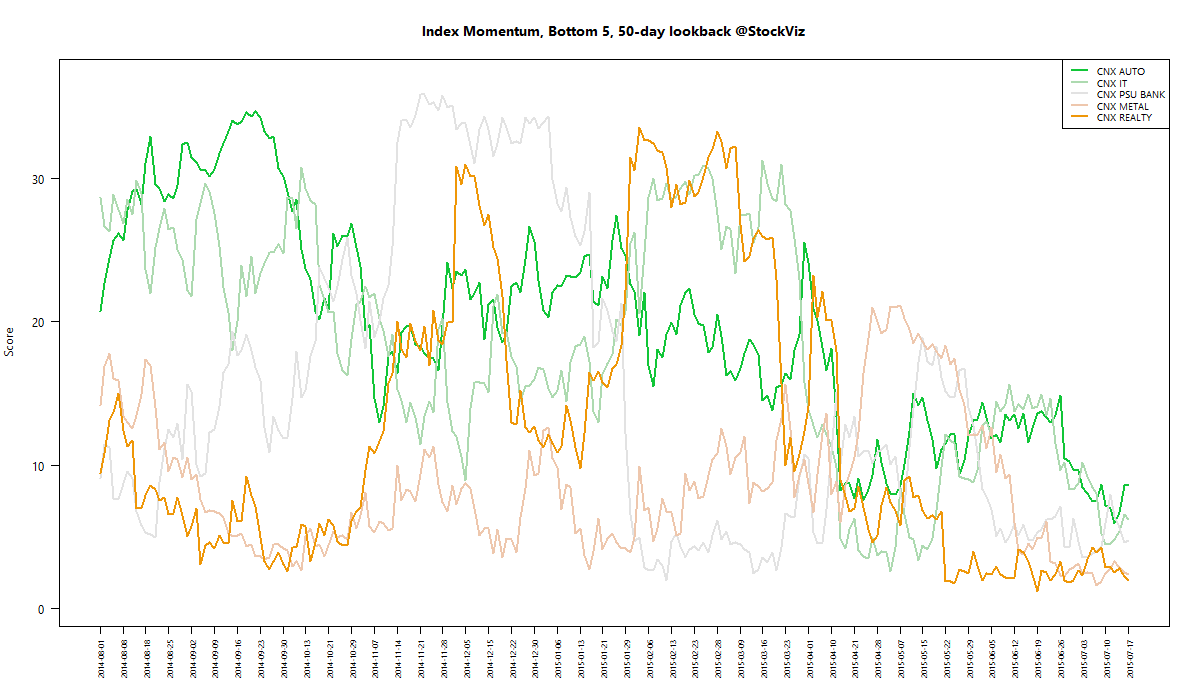
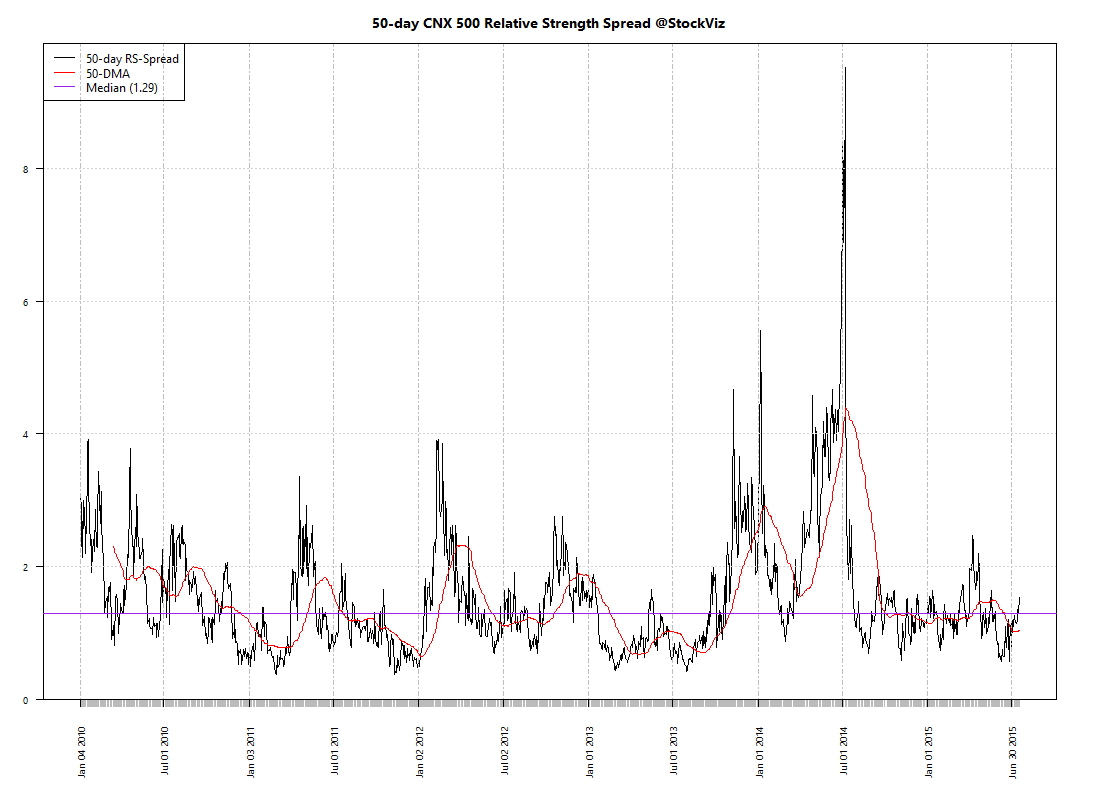
For a deeper dive into indices, check out our weekly Index Update.
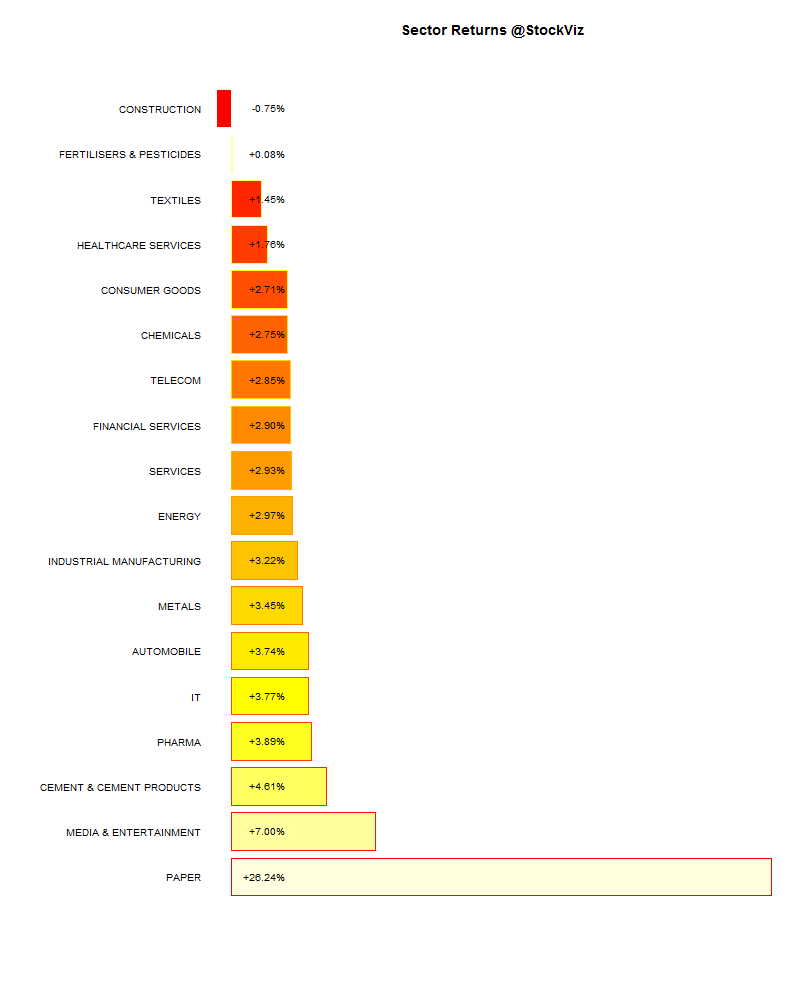
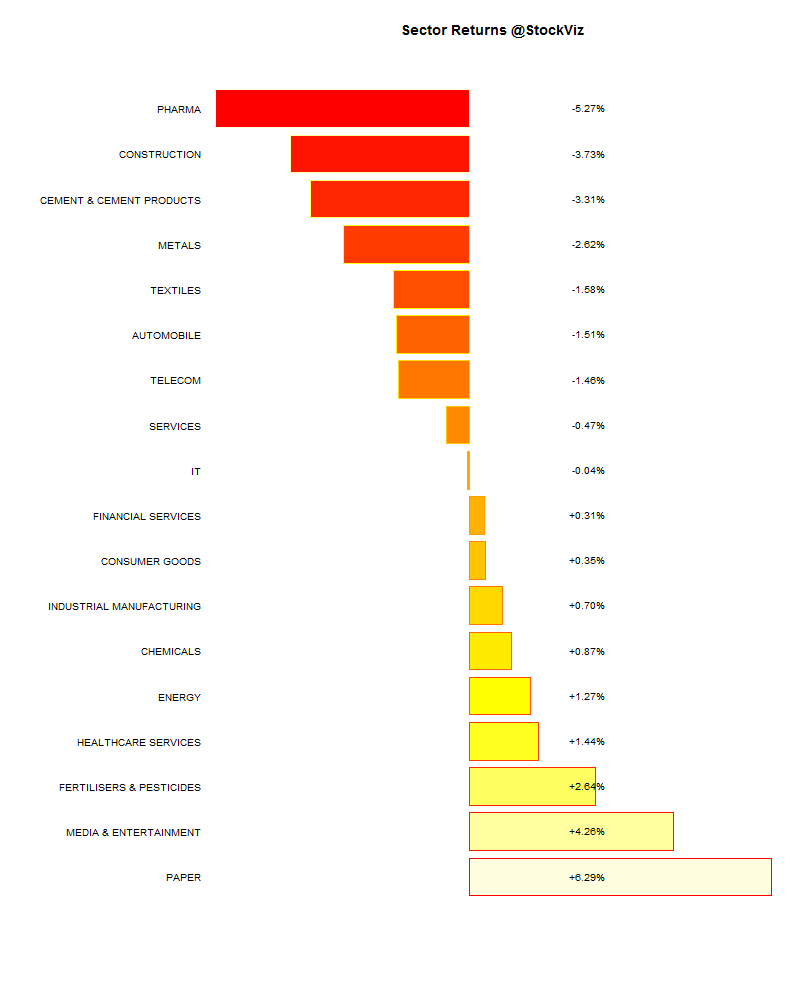
Sector Performance
Market Cap Decile Performance
| Decile | Mkt. Cap. | Adv/Decl |
|---|---|---|
| 1 (micro) | -1.58% | 73/62 |
| 2 | +0.74% | 69/66 |
| 3 | +8.28% | 69/66 |
| 4 | -0.03% | 71/63 |
| 5 | +1.95% | 70/66 |
| 6 | +0.73% | 65/70 |
| 7 | +0.40% | 72/63 |
| 8 | +1.34% | 70/65 |
| 9 | -0.35% | 63/72 |
| 10 (mega) | +0.01% | 70/65 |
Looks like there was an outlier that bumped up a microcap stock…
Top Winners and Losers
| INFY | +8.56% |
| ABIRLANUVO | +8.56% |
| IBULHSGFIN | +8.86% |
| LUPIN | -15.25% |
| SUNPHARMA | -11.76% |
| CONCOR | -11.74% |
Sunpharma’s warning, Lupin’s disappointment and Infy’s optimism…
ETF Performance
| INFRABEES | +1.50% |
| JUNIORBEES | -0.66% |
| NIFTYBEES | -1.12% |
| CPSEETF | -2.56% |
| PSUBNKBEES | -2.76% |
| BANKBEES | -2.94% |
| GOLDBEES | -3.13% |
Gold got shellacked…
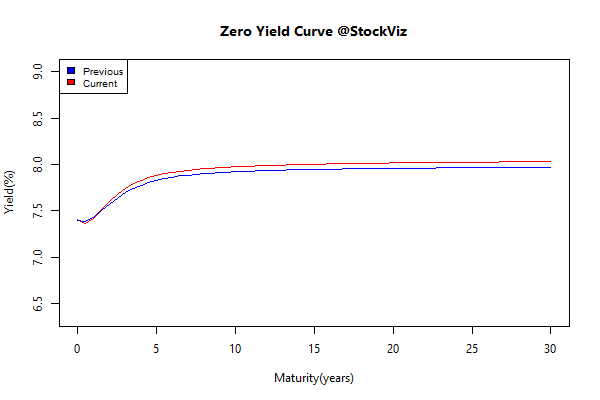
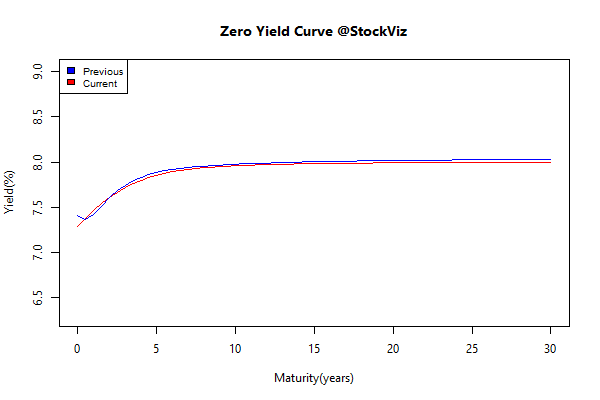
Yield Curve
Bond Indices
| Sub Index | Change in YTM | Total Return(%) |
|---|---|---|
| 0 5 | +0.02 | +0.12% |
| 5 10 | -0.04 | +0.35% |
| 10 15 | -0.01 | +0.22% |
| 15 20 | -0.02 | +0.34% |
| 20 30 | -0.02 | +0.36% |
The long end of the curve was in the green after a long time…
Investment Theme Performance
| Quality to Price | +3.77% |
| Magic Formula | +1.09% |
| Financial Strength Value | +0.58% |
| Balance Sheet Strength | -0.21% |
| Momentum | -0.34% |
| Tactical CNX 100 | -0.89% |
| High Beta | -1.31% |
| Next Trillion | -1.68% |
| ASK Life | -1.68% |
| CNX 100 Enterprise Yield | -1.76% |
| PPFAS Long Term Value | -1.91% |
| ADAG stocks | -1.97% |
| Low Volatility | -3.38% |
| The RBI Restricted List | -5.15% |
A mixed bag. Momentum ended flat as Kitex got whacked…
Equity Mutual Funds
Bond Mutual Funds
Thought for the weekend
Big money is in buying and holding great businesses acquired at reasonable valuations. Owning such businesses will produce gut-wrenching roller coaster rides which the investor has to have the willingness to take. They can’t avoid those rides by jumping out and trying to get back in, and attempts to do so are likely to be unsuccessful. So, the best strategy is to stay put and bear it.
Source: Sanjay Bakshi