This is a review of the 6th chapter of John J. Murphy’s Technical Analysis of the Financial Markets.
Continuation Patterns
Continuation patterns are shorter terms patterns that indicate that a current price action is nothing more than a pause in an existing trend and that the previous trend will resume later.
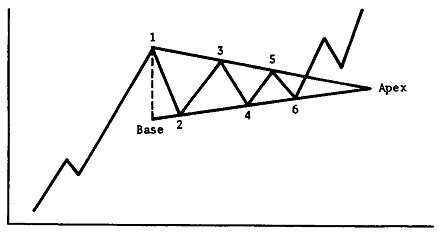
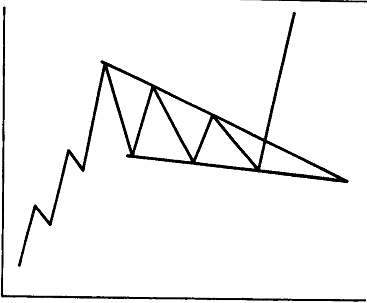
Triangle
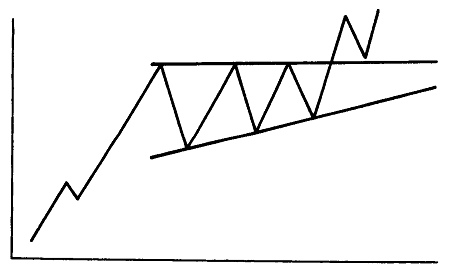
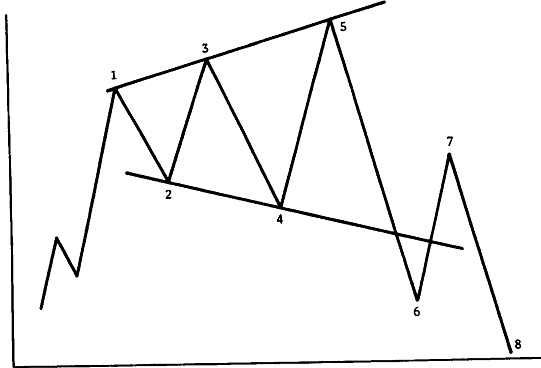
There are three types of triangles:
- Symmetrical (coil): Formed out of two trendlines where the upper one descending and the lower line ascending.
- Ascending: Formed out of a rising lower line and a flat upper line.
- Descending: Formed out of a flat lower line and a descending upper line

The Broadening Formation (Megaphone Top)
 It looks like a triangle turned backwards and represents an out-of-control market. Volume tends to increase along with the wider price swings.
Flags and Pennants
Flags and Pennants represent brief pauses in a one-directional market and they need to be preceded by sharp, straight line moves.
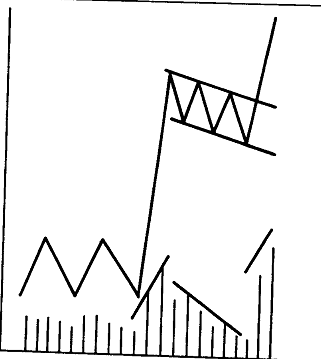
A flag should slope against the trend and volume should dry up during the formation and build again during the breakout. The flag usually forms during the mid-point of the move.
A Pennant represents a small symmetrical triangle. 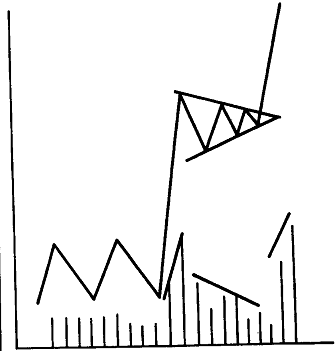 Volume should be light during its formation. The move after the pennant should duplicate the move before its formation.
Both patterns are short-term and should be completed within 1-3 weeks with volumes drying up during their formation.
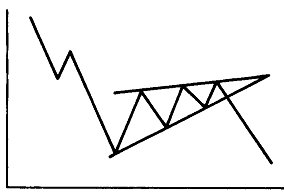
The Wedge
The wedge formation is very similar to a symmetrical triangle, except that it has a prominent slant. A falling wedge is considered bullish whereas a rising wedge is considered bearish.
The Rectangle (Trading Range)
It usually just represents a consolidation area after which the previous trend resumes. A decisive close outside the upper/lower boundary signals a completion.
The Measured Move (Swing)
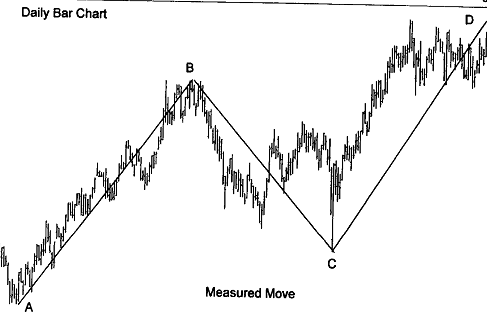
It describes the movement of a stock when a major advance or decline is divided into two equal and parallel moves. The moves should be fairly orderly and well defined.
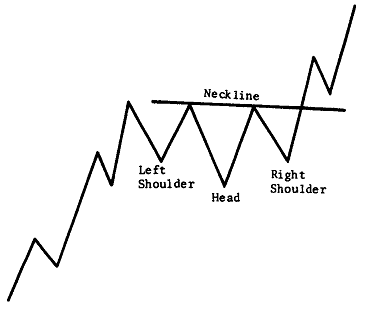
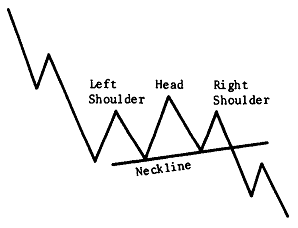
The Continuation Head & Shoulders
The price action looks similar to a Rectangular pattern except that the middle trough, in an uptrend, tends to be lower than the other two shoulders. In a downtrend, the middle peak exceeds the other two peaks.
Next: Chapter 7 – Volume & Open Interest