Tag: mutual funds

Long-term Gilt Funds

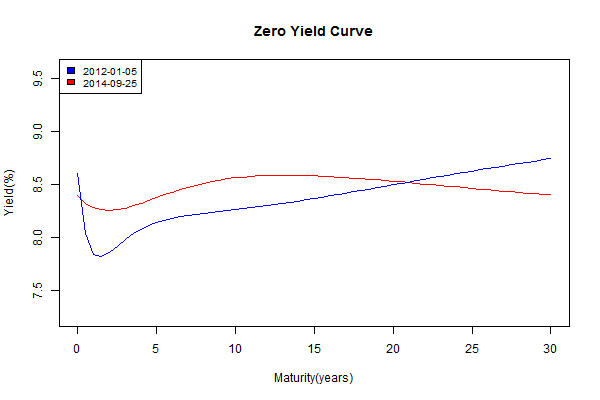
With the consensus on RBI rate cuts beginning next year, investors have been lapping up long-term government bonds (gsecs or gilts, if you wish.) The long-end has been bid so hard that the yield curve is flat as a pancake.

zero.curve.2012-01-05.2014-09-25

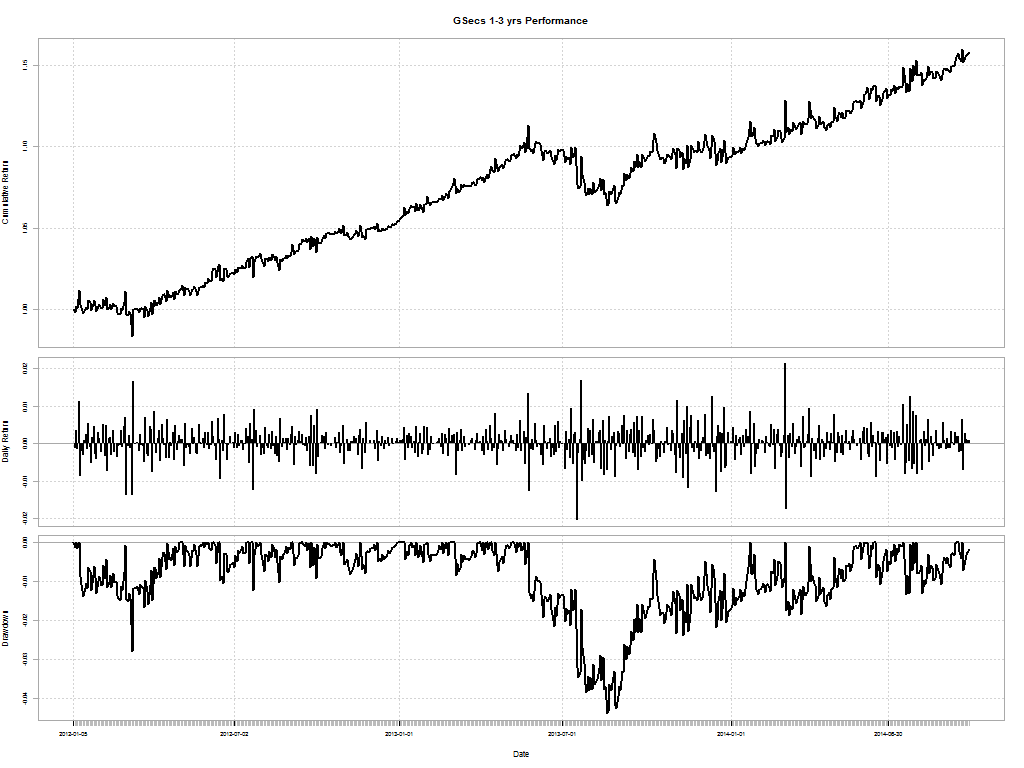
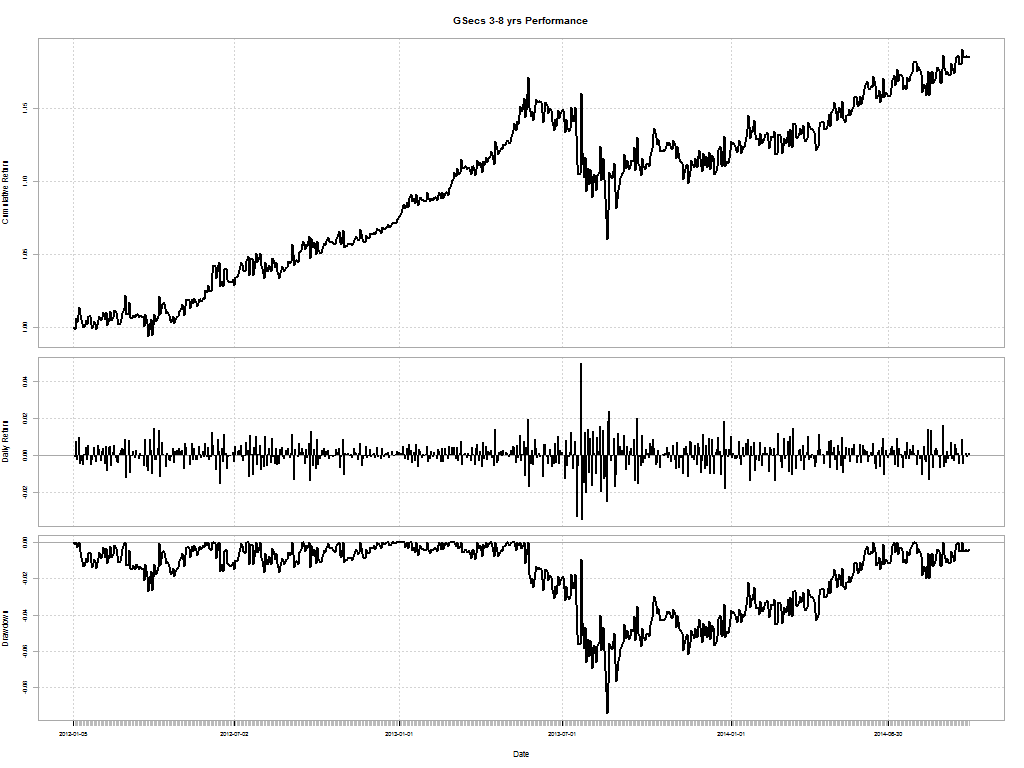
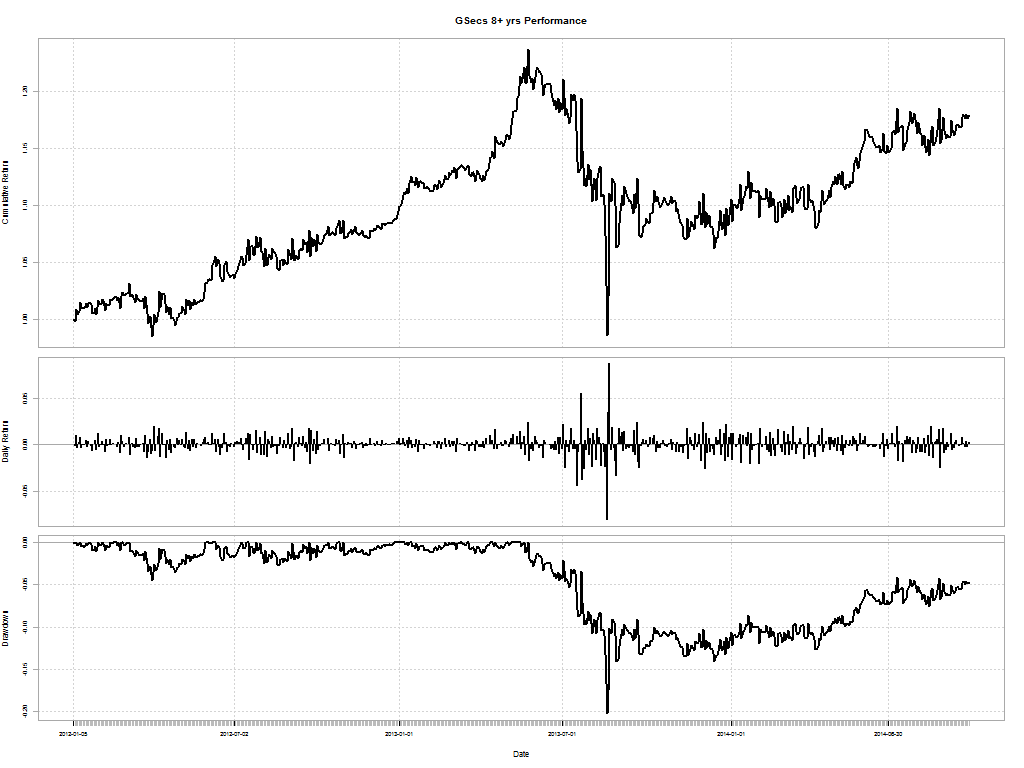
GSec Total Return Indices have tracked this, except for the hiccup back in May last year.

Short-term:

GSEC_SUB_1-3.2012-01-05.performance

Medium-term:

GSEC_SUB_3-8.2012-01-05.performance

Long-term:

GSEC_SUB_8.2012-01-05.performance

Drawdowns

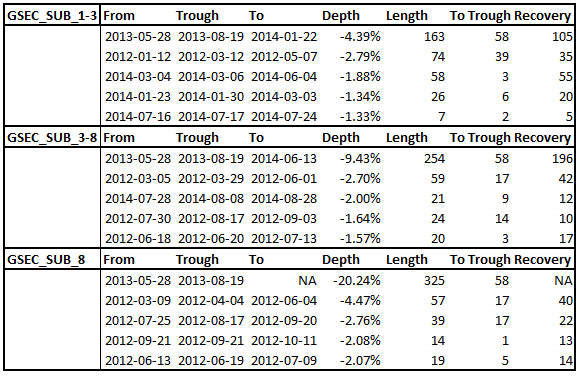
May’13 was a rude reminder to investors who thought that you cannot lose money investing in government bonds. You can. Investors in the long-end of the curve are yet to recover from the drawdown last year.

gsec draws

Should you expect actively managed gilt funds to do better?

UTI – GILT ADVANTAGE vs. ICICI Prudential Long Term Gilt

UTI’s fund has a much shorter duration compared to ICICI’s (4.1 vs. 7.35 years.) And the returns that the funds have posted exemplify the importance of incorporating the fund portfolio’s duration into your decision making.

Since 2012-01-05, UTI – GILT ADVANTAGE-LONG TERM has returned a cumulative 24.59% vs. ICICI Prudential Long Term Gilt Fund’s cumulative return of 20.16%.

UTI – GILT ADVANTAGE vs. Birla Sun Life Gilt Plus

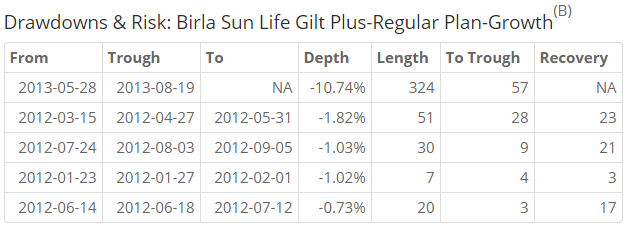
Since 2012-01-05, UTI – GILT ADVANTAGE has returned a cumulative 24.59% vs. Birla Sun Life Gilt Plus’s cumulative return of 14.79%. And BSL’s fund is yet to recover from the May’13 drawdown.

birla gilt drawdown

UTI – GILT ADVANTAGE vs. HDFC Gilt Fund-Long Term

Since 2012-01-05, UTI – GILT ADVANTAGE has returned a cumulative 24.59% vs. HDFC Gilt Fund-Long Term’s cumulative return of 22.01%. Of the three funds we compared, this is the closest any gilt fund has come to matching UTI’s returns.

UTI – GILT ADVANTAGE vs. GSEC SUB 3-8 TRI

Since 2012-01-05, UTI – GILT ADVANTAGE-LONG TERM has returned a cumulative 24.59% vs. GSEC SUB 3-8’s cumulative return of 18.55%. The fund beat the sub-index hands-down.

Conclusion

It looks like the UTI Gilt Advantage fund is a well managed fund that has beat its peers and benchmarks. But as the standard disclaimer reads, “past performance does not necessarily predict future results.”

You can run the comparison tool here: FundCompare


Please don’t treat the information here as investment advice.
If you want advice on investing in mutual funds, please get in touch with Shyam.
You can either WhatsApp him or call him at 080-2665-0232.
He is an AMFI registered IFA who can advice you on HDFC, ICICI Pru, UTI and Birla Sun Life funds.
Are Index Funds trying to beat the Index?

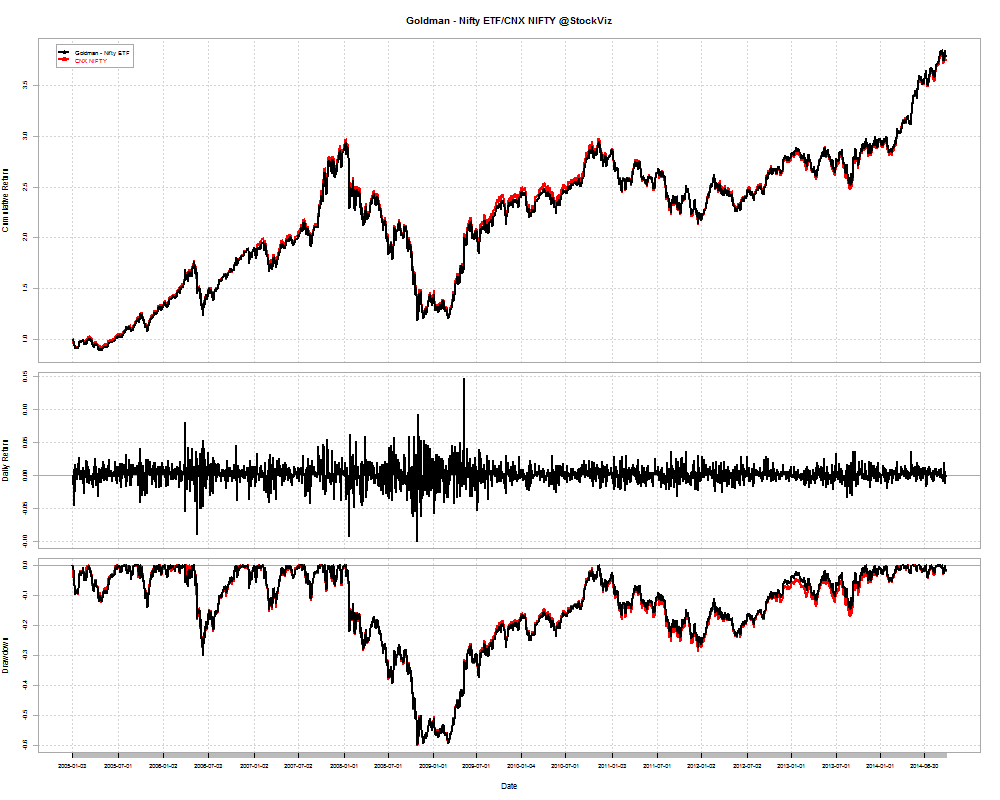
Ideally, Index Funds should just track an index. Its the holy-grail of passive indexing – don’t try to be smart picking stocks, just invest in an index tracking fund and let the market work for you. Index Funds are supposed to only focus on reducing tracking error and fees. The NIFTYBEES ETF does the job pretty well:

NIFTYBEES

Since 2005-01-03, Goldman – Nifty ETF has returned a cumulative 275.22% vs. CNX NIFTY’s cumulative return of 278.36%. Chalk up the difference to asset management fees. But the story with Index Funds offered by leading AMCs is a head scratcher.

IDFC Nifty Fund

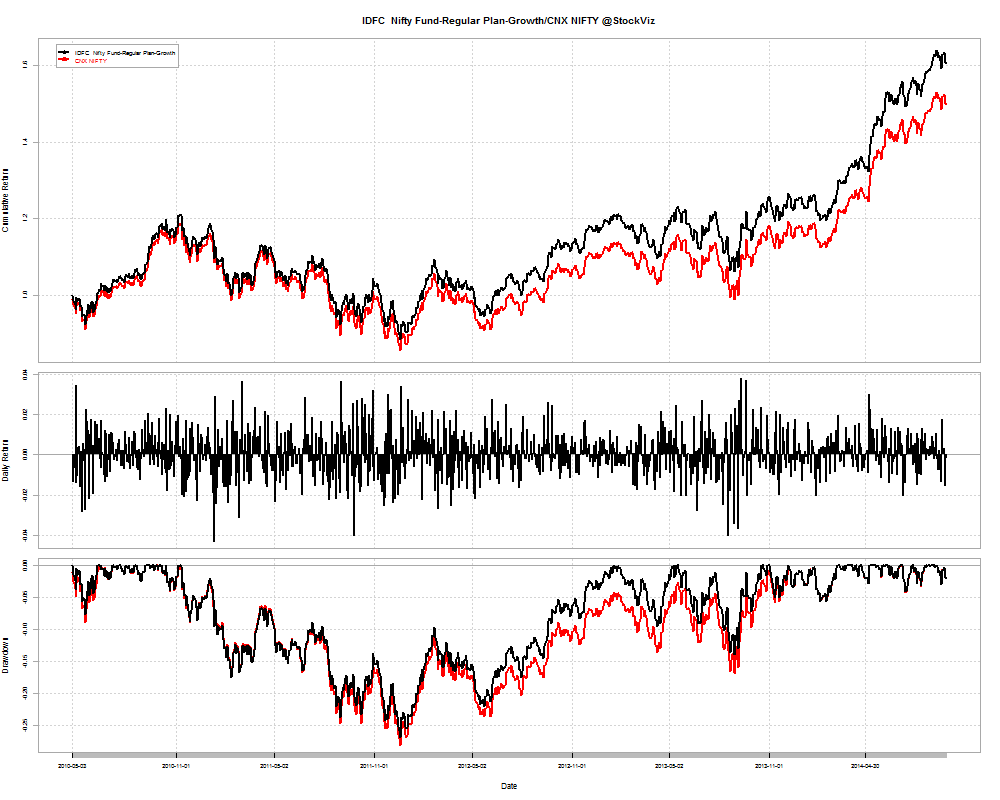
Since 2010-05-03, IDFC Nifty Fund-Regular Plan-Growth has returned a cumulative 61.17% vs. CNX NIFTY’s cumulative return of 51.62%.

IDFC nifty

LIC NOMURA MF Nifty Index Fund

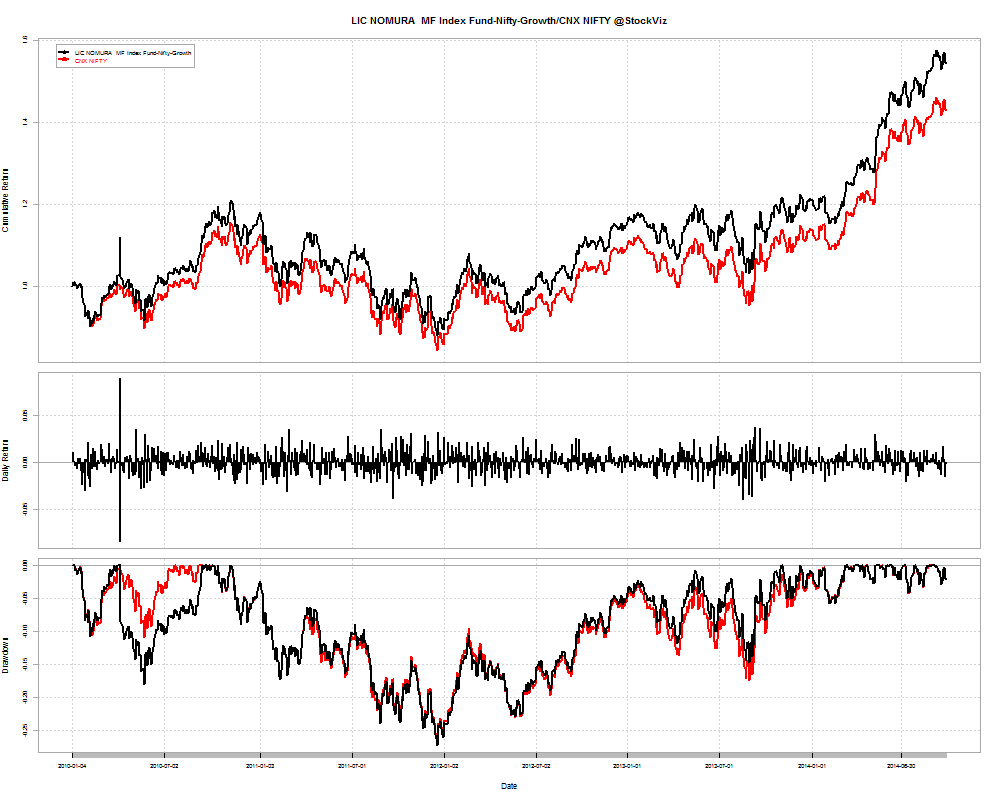
Since 2010-01-04, LIC NOMURA MF Index Fund-Nifty-Growth has returned a cumulative 54.78% vs. CNX NIFTY’s cumulative return of 52.95%.

lic nifty

Taurus Nifty Index Fund

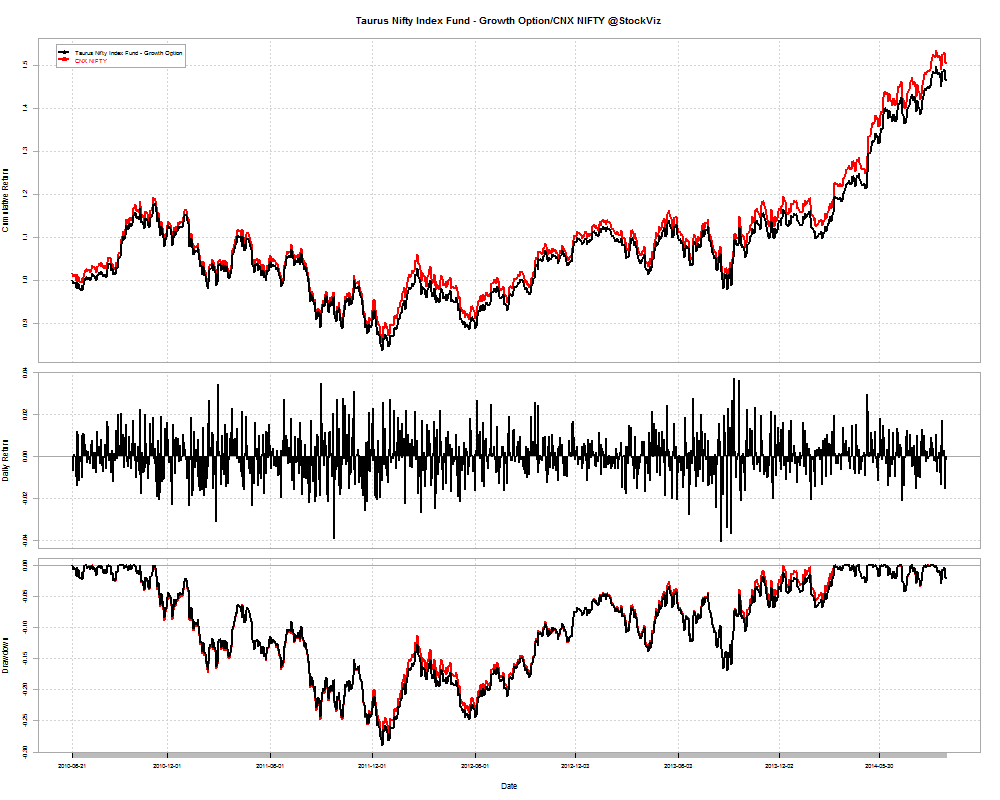
Since 2010-06-21, Taurus Nifty Index Fund – Growth Option has returned a cumulative 46.82% vs. CNX NIFTY’s cumulative return of 52.06%. Oops!

taurus nifty

IDBI NIFTY Index Fund

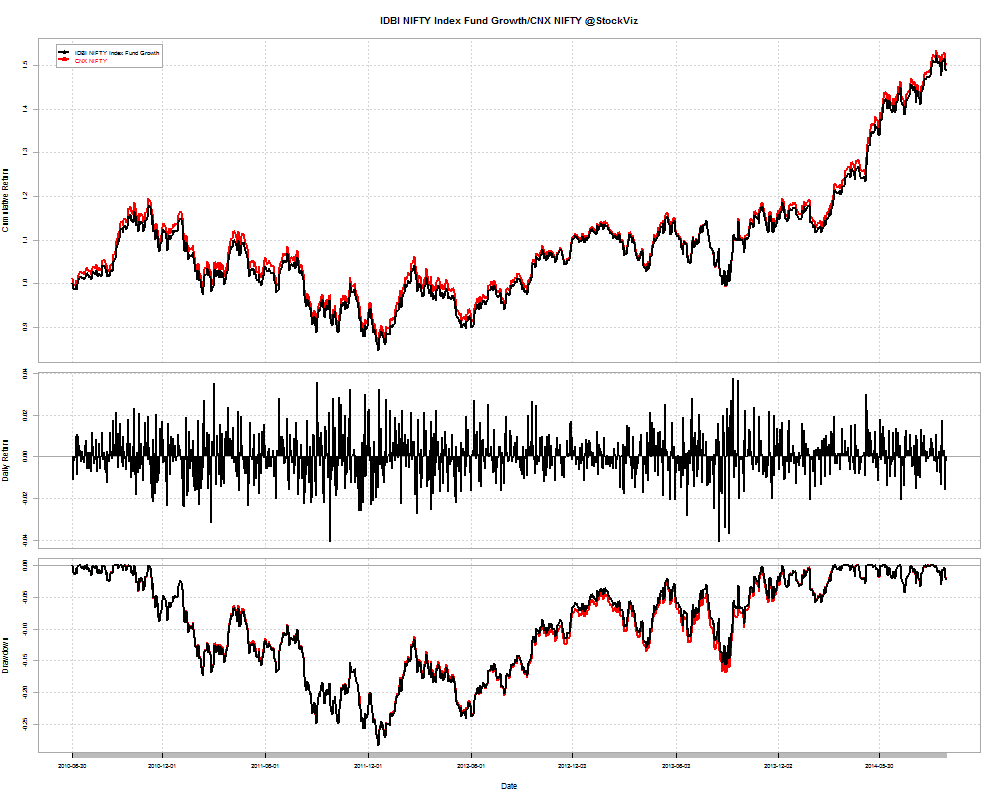
Since 2010-06-30, IDBI NIFTY Index Fund Growth has returned a cumulative 49.48% vs. CNX NIFTY’s cumulative return of 52.25%.

IDBI Nifty

Question

If the NIFTYBEES ETF can track the index with a 0.09% tracking error and an expense ratio of 0.5%, why would anybody invest in any of the NIFTY Index Funds?

You can run the comparison tool here: FundCompare


Please don’t treat the information here as investment advice.
If you want advice on investing in mutual funds, please get in touch with Shyam.
You can either WhatsApp him or call him at 080-2665-0232.
He is an AMFI registered IFA who can advice you on HDFC, ICICI Pru, UTI and Birla Sun Life funds.
Comparing: ICICI Prudential Corporate Bond Fund

We ran the Fund Comparison tool to get an idea of how the ICICI Corporate Bond fund stood relative to its peers. Here are some quick takes.

Outperformed GSecs

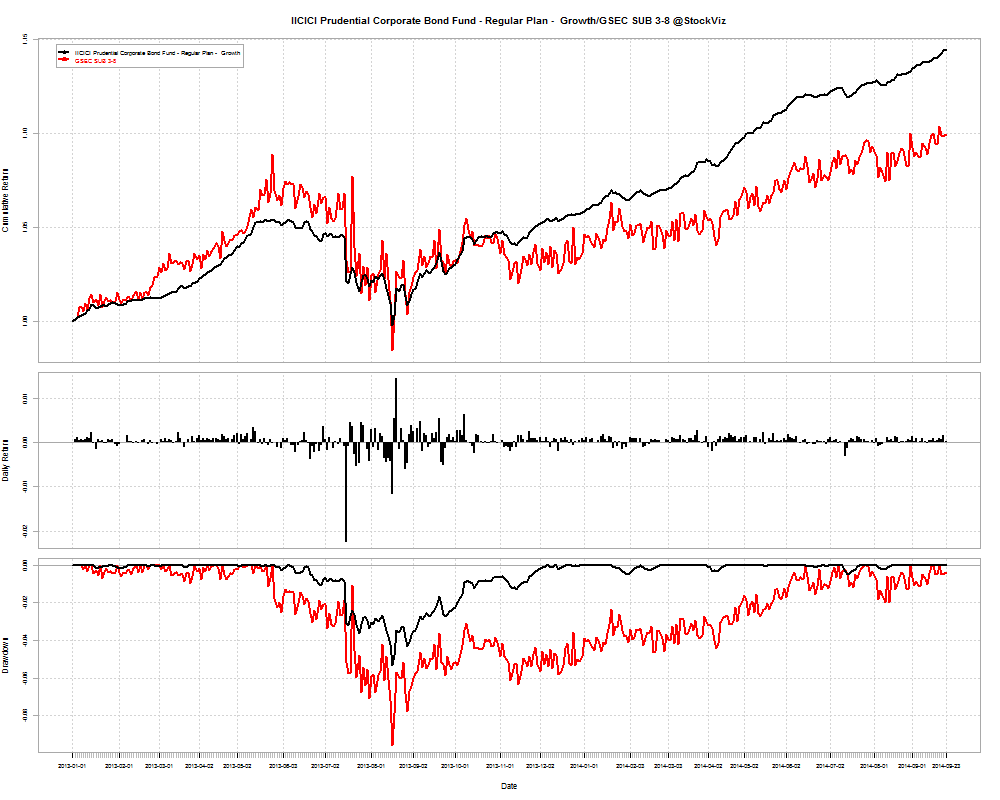
Since 2013-01-01, IICICI Prudential Corporate Bond Fund has returned a cumulative 14.51% vs. GSEC SUB 3-8’s cumulative return of 10.21%.

ICICI Prudential Corporate Bond Fund vs GSEC SUB 3-8

Outperformed Principal Debt Opportunities Fund

Since 2012-01-02, ICICI Prudential Corporate Bond Fund has returned a cumulative 25.68% vs. Principal Debt Opportunities Fund’s cumulative return of 24.74%. But ICICI had a deeper drawdown in 2013.

ICICI Prudential Corporate Bond Fund Drawdowns:

icici drawdown

Principal Debt Opportunities Fund Drawdowns:

principal drawdown

Outperformed UTI Gilt Advantage Fund

Since 2013-01-01, ICICI Prudential Corporate Bond Fund has returned a cumulative 14.51% vs. UTI – GILT ADVANTAGE-LONG TERM’s cumulative return of 12.88% while having a shallower drawdown in 2013: -5.33% vs. -8.18%

Conclusion

The ICICI Prudential Corporate Bond Fund could be attractive to investors looking to benefit from corporate credit improving on the back of a recovering economy and riding the RBI’s expected rate cuts coming down the pike.

You can run the comparison tool here: FundCompare


Please don’t treat the information here as investment advice.
However, if you want advice on investing in mutual funds, please get in touch with Shyam.
You can either WhatsApp him or call him at 080-2665-0232.
He is an AMFI registered IFA who can advice you on ICICI Pru, UTI and Birla Sun Life funds.
Quantitative Comparison of Mutual Funds

How do you compare two Mutual Funds and what should be the basis for such a comparison? There is the question of returns, obviously. But higher returns can be achieved by taking on more risk. And then there’s the question of draw-downs. What were the periods of bad performance and how long did it take the asset manager to make up for those losses? How do you compare risk-adjusted returns of two funds? What if you want to compare returns to whatever benchmark index you wanted?

Mutual Fund Comparison Tool

You can compare over 800 funds to each other and any benchmark index you choose. For example, are you confused between ICICI Top 100 and DSP BlackRock Top 100? Punch it in and hit compare.

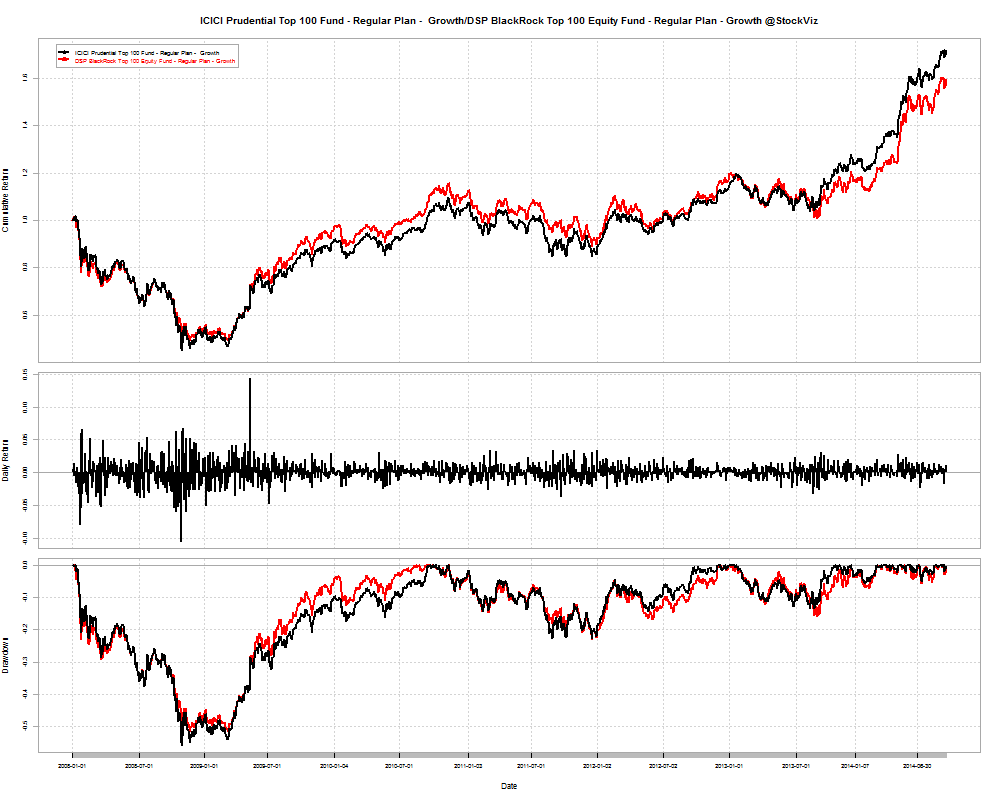
Since 2008-01-01, ICICI’s Top 100 Fund has returned a cumulative 71.64% vs. BlackRock’s Top 100’s 59.49%.

And as you can see from the wealth chart below, BlackRock’s under-performance has been recent.

icici dsp top 100

However, during the depths of the 2008 crisis, BlackRock managed to go down 51.73% vs. ICICI’s 55.66% and spent 632 days in the red vs. ICICI’s 656 days.

Now, how about comparing ICICI’s Top 100 vs. their own Top 200?

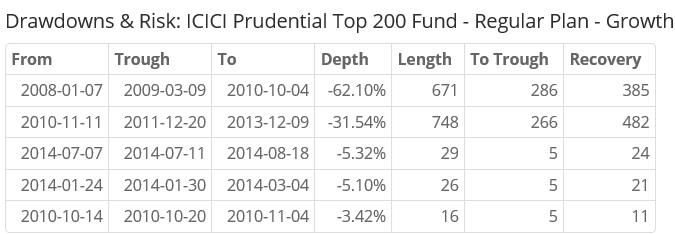
Since 2008-01-01, ICICI Top 100 has returned a cumulative 71.64% vs. Top 200’s cumulative return of 48.57%. And the Top 200 fund really shit the bed during 2008.

icici 200

Confused between value funds and midcap index funds? Do famous managers live up to their reputations?

Since 2010-01-04, PPFAS Long Term Value Fund has returned a cumulative 50.62% vs. BSE MID CAP’s cumulative return of 44.71%. And the fund’s worst period was between 2013-08-28 and 2013-10-11, where it lost -5.84%.

Go ahead, check out the tool: FundCompare


Please don’t treat the information here as investment advice.
However, if you do want advice on investing in mutual funds, please get in touch with Shyam.
You can either WhatsApp him or call him at 080-2665-0232.
He is an AMFI registered IFA who can advice you on ICICI Pru, UTI and Birla Sun Life funds.
Mutual Fund League Tables

AMFI puts out AUM statistics of mutual funds once a quarter. Here are some key take aways.

The Top 5 Dominate

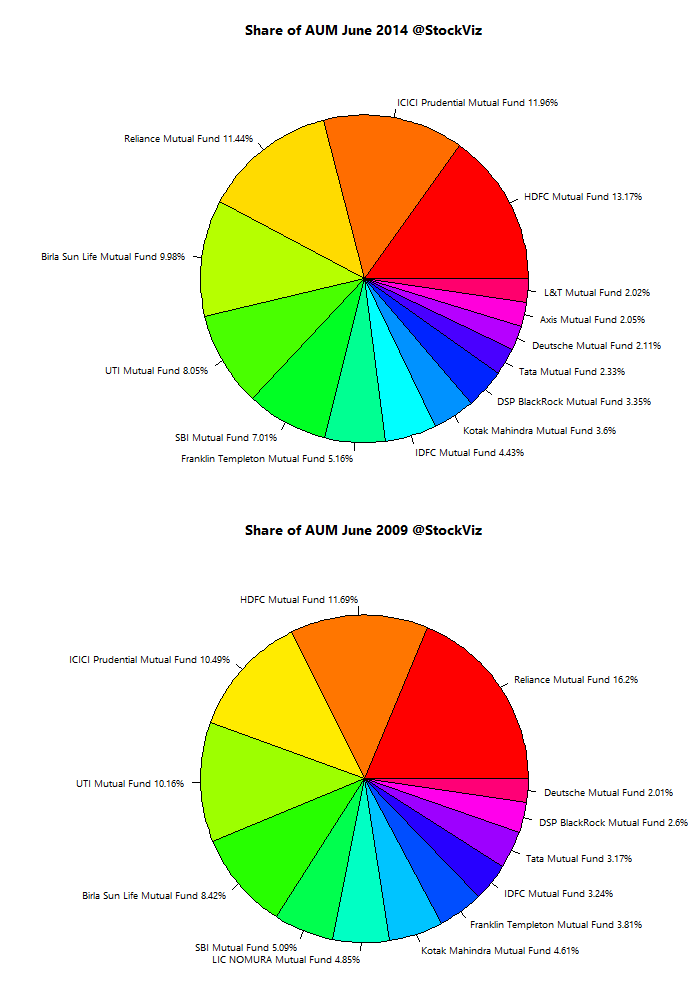
Between 2009 and 2014, the top 5 players have remained the same: HDFC, ICICI, Birla Sun Life and Reliance. And their share has remained more-or-less the same: 56.96% in 2009 and 54.6% now.

32 out of a total of 46 funds have less than 2% share, 29 have less than 1%

mutual-fund-aum-share

There are way too many schemes

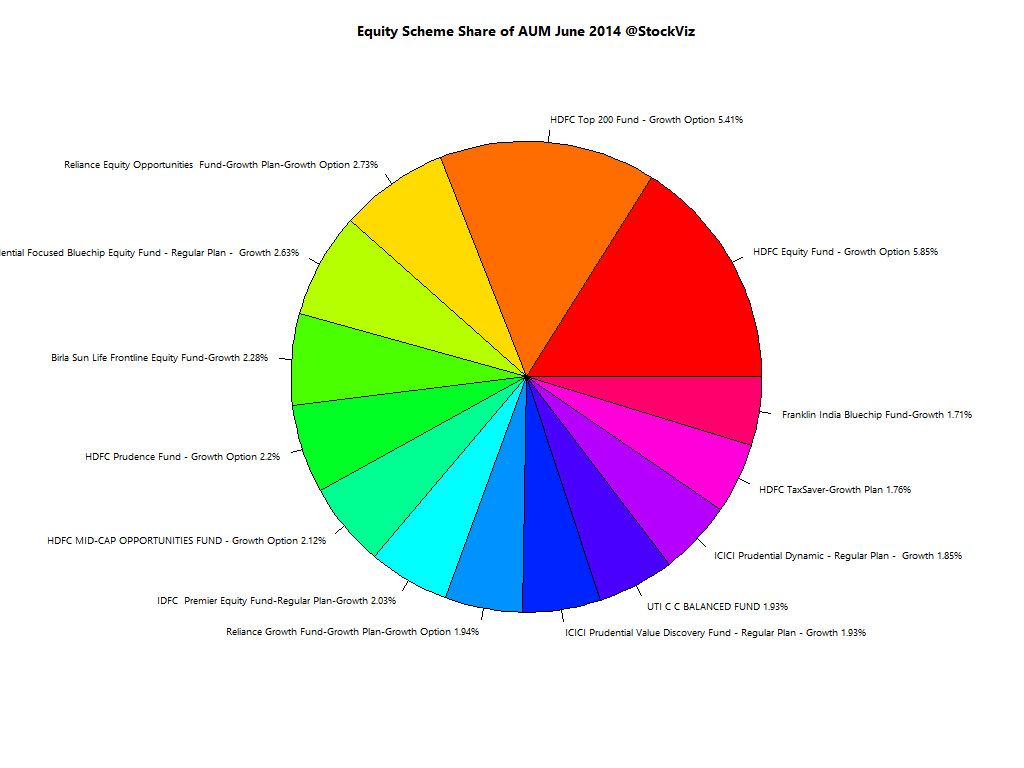
There are 1066 equity schemes (all permutations and combinations.) The top 2 schemes (both from HDFC) have more than 10% of AUM and the top 10 have about 30%. The rest of them fight for scraps.

equity-scheme-aum-share

Direct plans even the playing field

… a bit.

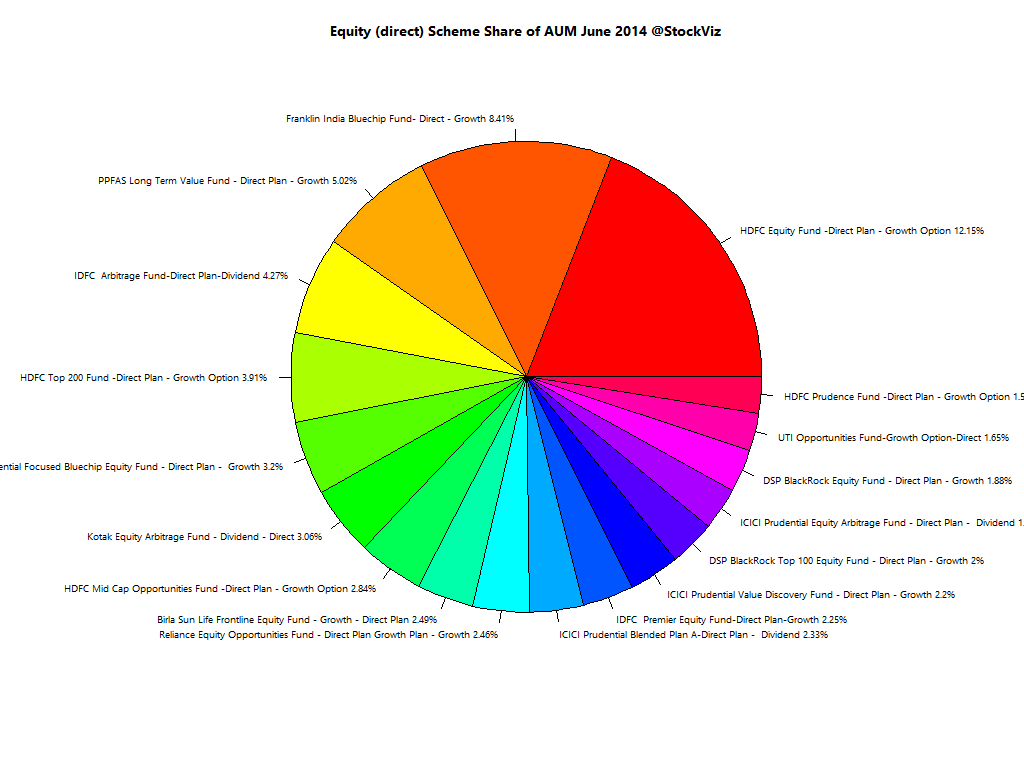
PPFAS has a 5% share of all direct plans.

direct-scheme-aum-share

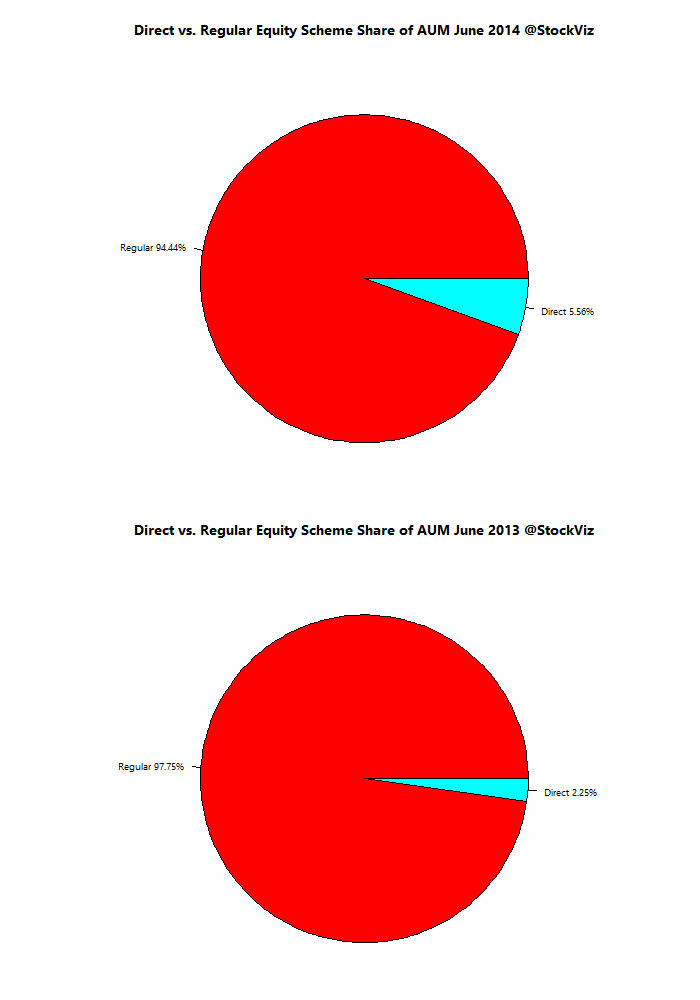
However, Direct plans are yet to make a dent

Equity AUM under direct plans have doubled since last year. This ought to be giving distributors sleepless nights…

direct-regular-scheme-aum-share