About 40 companies have published second quarter results so far. Here are some quick charts of the income and profit growth:
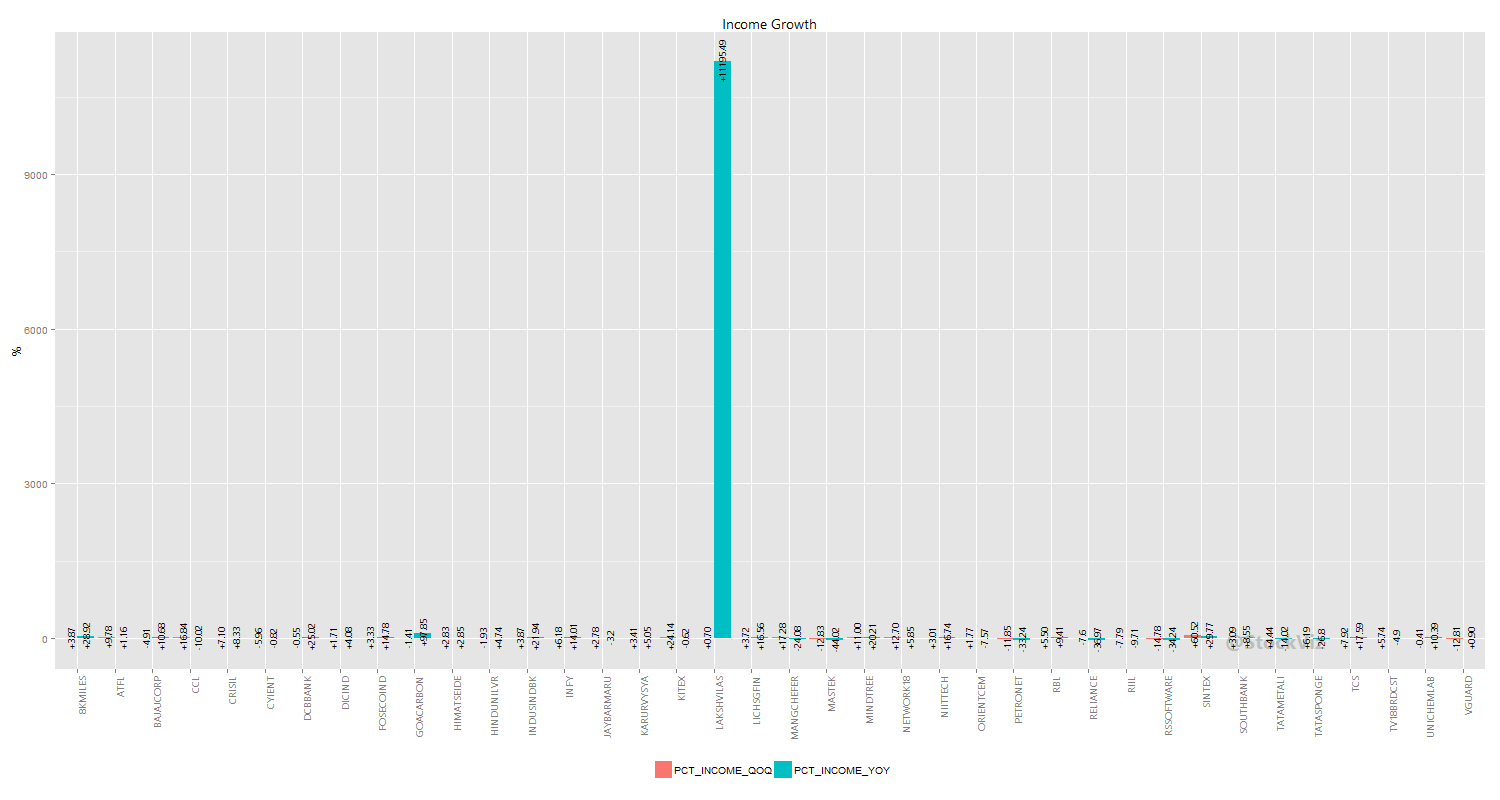
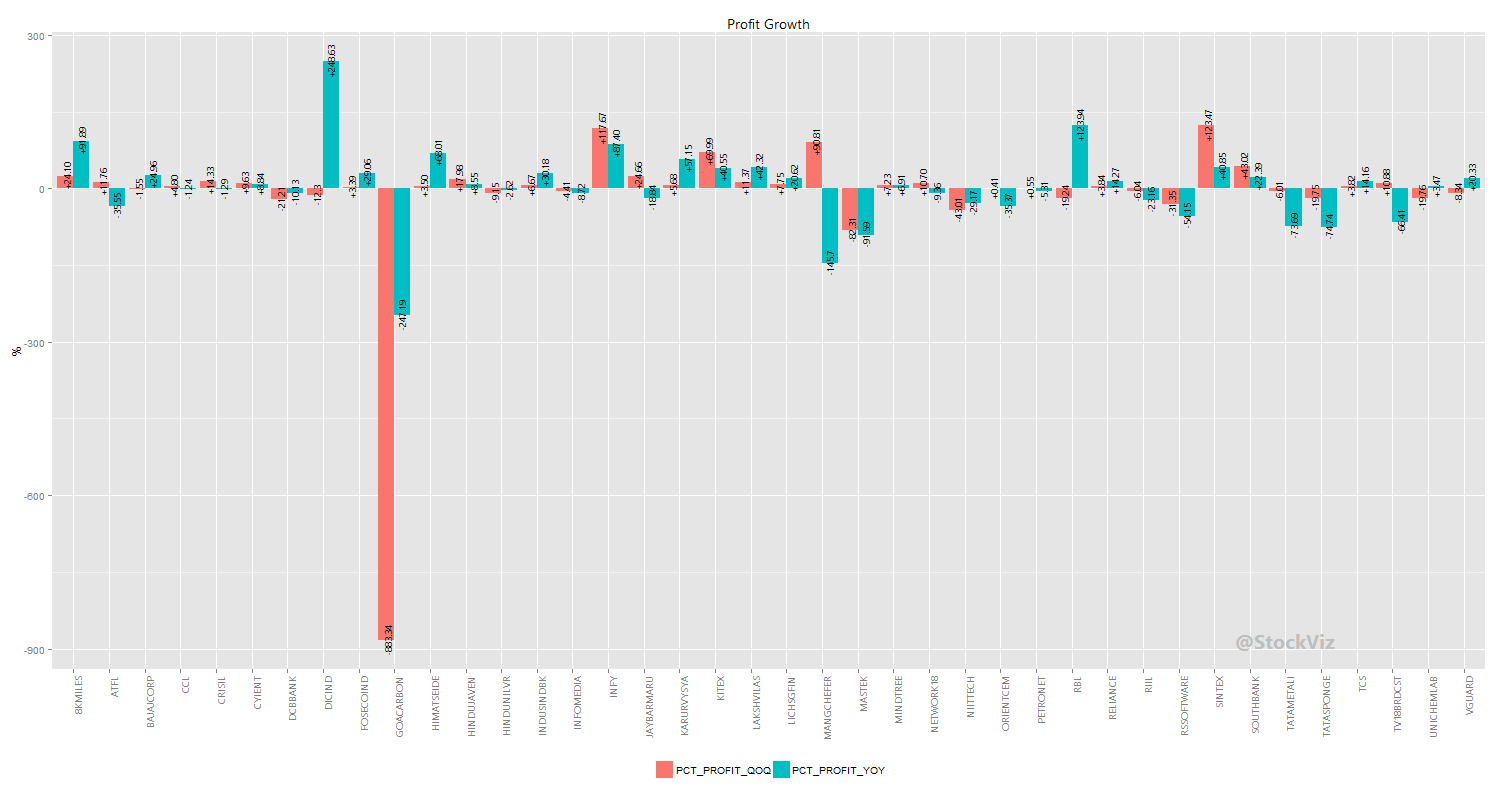
With the outliers removed:
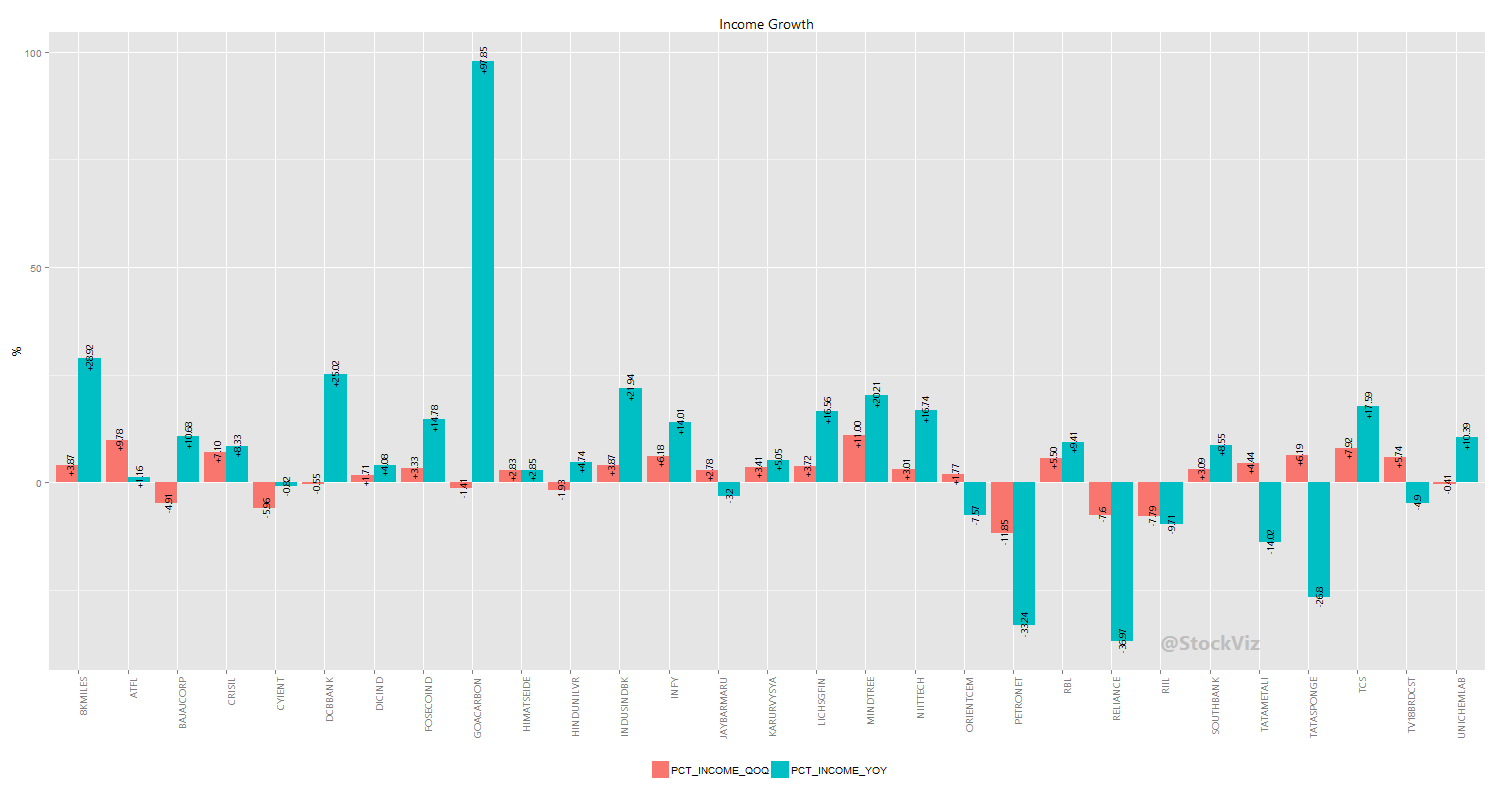
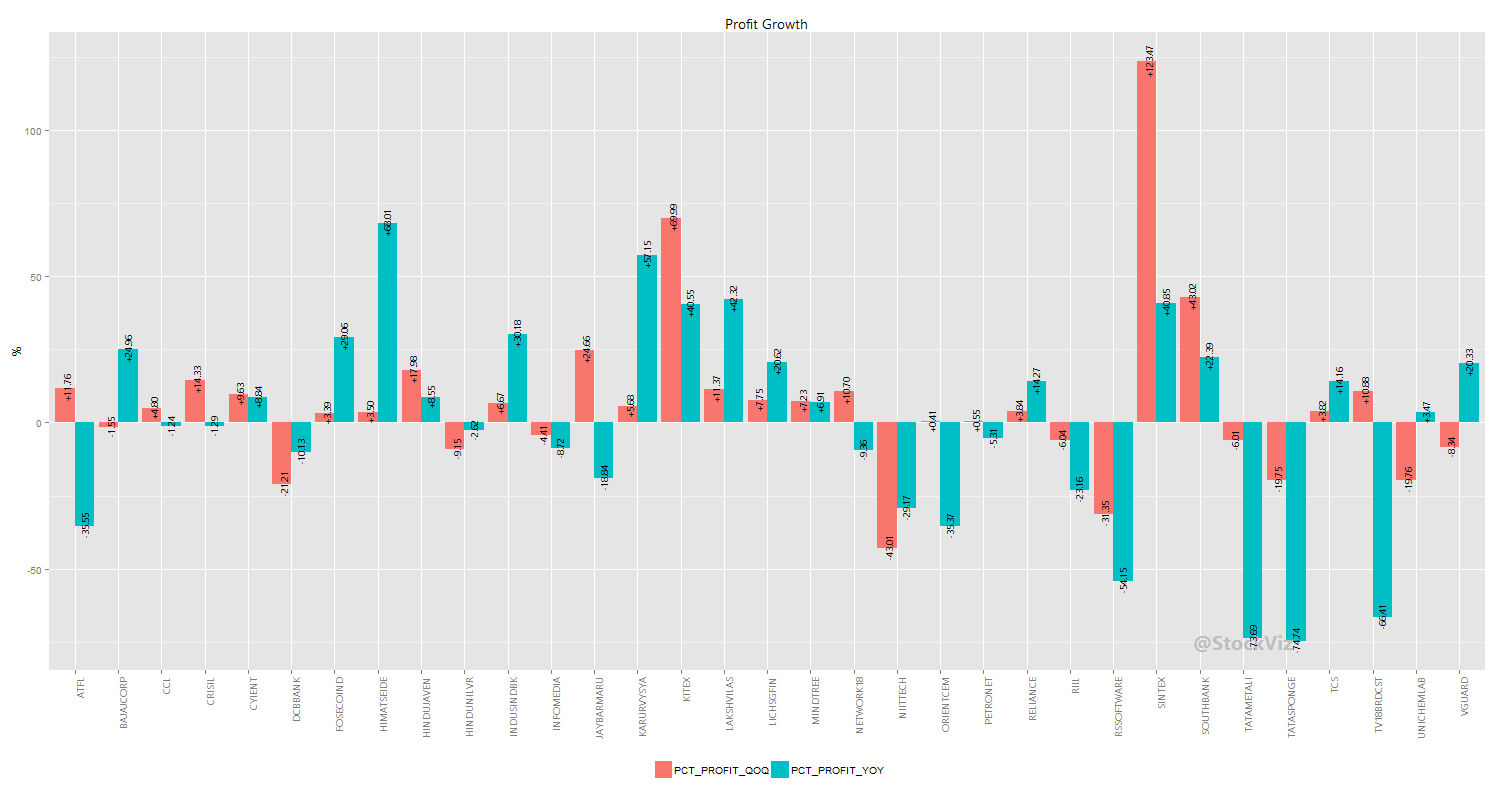
Stay tuned…
Invest Without Emotions
About 40 companies have published second quarter results so far. Here are some quick charts of the income and profit growth:
With the outliers removed:
Stay tuned…
The Securities and Exchange Board of India (Sebi) is checking if ecommerce portals can be used to sell mutual funds. (ET)
Let’s see what the pros and cons are.
Do you know what the fastest growing region for ecommerce sales are? Tier 2 and Tier 3 cities. (DNA)
The biggest problem with the distributor (IFA) driven model is that it has high fixed costs. IFAs rather have a small number of big clients than a large number of small clients. By pushing funds through ecommerce portals, which have typically traded negative margins for increased market share in the past, the number of small-ticket mutual fund investors could potentially explode.
In the distributor driven model, the producer (asset management companies) bear a large portion of the marketing costs. For example, if HDFC is coming out with a new fund, they will take out newspaper and TV ads, send out fliers, etc. But ecommerce portals pay for their own marketing. Smaller brands (AMCs,) who cannot match the big guys in their marketing budgets might benefit disproportionately. I recently went shopping for some RAM for the laptop. I ended up buying ‘Dolgix’, a brand that I had never hear of before from some vendor in Nehru Place, because the specs matched and there’s a 7-day return policy in case it turned out to be a turd. Expect similar buying patterns to emerge when people go fund shopping.
There are 42 AMCs in India with a mind-boggling number of schemes that have their own toggles and switches. There is a huge overlap between funds and schemes, mostly because of marketing reasons. With more investors being made aware of these choices, a significant portion of them will look for advice. If not on the first buy, then definitely on their next. Tech savvy IFAs/IAs will benefit for the increased mind-share.
We are yet to see a “direct-only” AMC. But if the digital channel finds wide adoption, then it is not a stretch to see a whole crop of online-only AMCs with a significant cost advantage over traditional AMCs spring up.
Unsophisticated investors herd into investments that have strong recent performance. Self-directed first-time investors might end up with lower long-term returns because of this. Which could lead them to abandon mutual funds subsequently. Also, AMCs might experience higher volatility in fund-flows as investors switch to “hot” funds.
Allowing ecommerce portals to distribute funds makes sense. The pros outweigh the cons.
Based on our RS-Spead metric, we ranked mutual funds based on their relative outperformance vs. CNX 500 over a one year period. See if you can find a pattern here.
*We have stared the fund that made it to the top-10 list the previous year.
There is no unqualified “best” fund out there. Among the top 5 fund houses (HDFC, ICICI Pru, Birla Sun Life, Reliance and UTI,) all funds within a class (large-cap, mid-cap, Top-100, etc…) will eventually put in roughly the same performance numbers. They will all revert to mean. Investors are probably better served with a negative list of funds and fund houses to avoid than a list of the “best” funds.
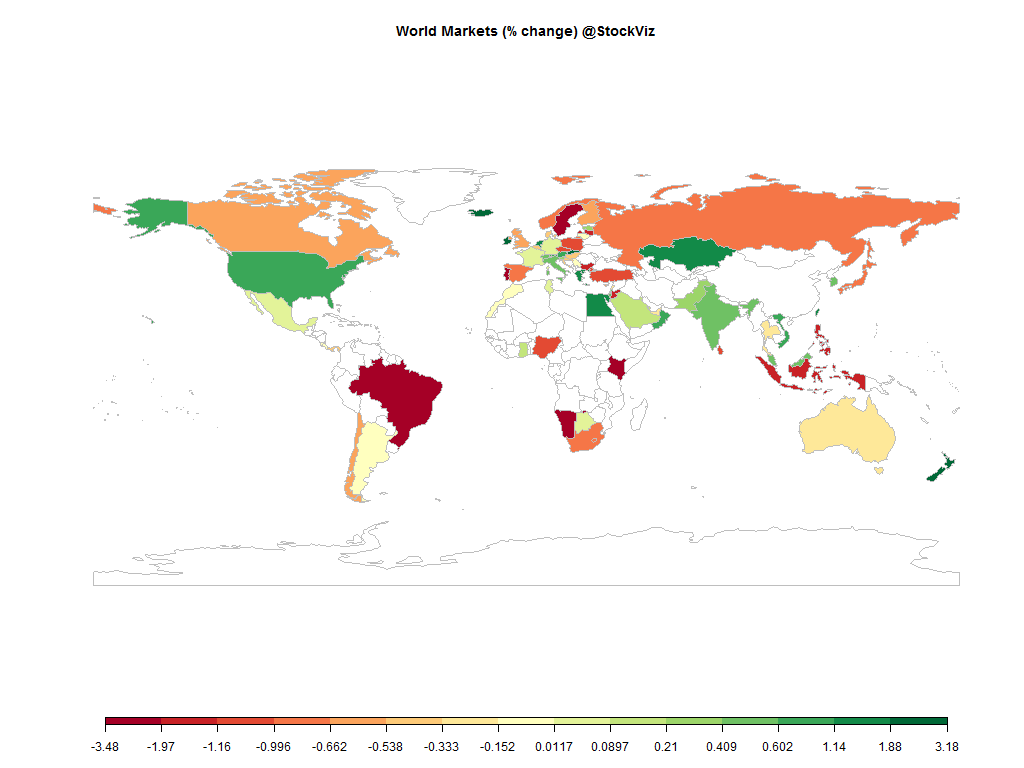
| MINTs | |
|---|---|
| JCI(IDN) | -1.47% |
| INMEX(MEX) | +0.07% |
| NGSEINDX(NGA) | -1.10% |
| XU030(TUR) | -1.05% |
| BRICS | |
|---|---|
| IBOV(BRA) | -3.27% |
| SHCOMP(CHN) | +6.54% |
| NIFTY(IND) | +0.59% |
| INDEXCF(RUS) | -0.66% |
| TOP40(ZAF) | -0.73% |
| Energy | |
|---|---|
| Brent Crude Oil | -4.00% |
| Ethanol | -0.20% |
| Natural Gas | -3.08% |
| RBOB Gasoline | -6.00% |
| WTI Crude Oil | -4.35% |
| Heating Oil | -5.54% |
| Metals | |
|---|---|
| Copper | -0.41% |
| Palladium | -1.68% |
| Gold 100oz | +1.96% |
| Platinum | +3.61% |
| Silver 5000oz | +2.53% |
| MINTs | |
|---|---|
| USDIDR(IDN) | +0.95% |
| USDMXN(MEX) | -0.17% |
| USDNGN(NGA) | -0.05% |
| USDTRY(TUR) | -0.71% |
| BRICS | |
|---|---|
| USDBRL(BRA) | +5.00% |
| USDCNY(CHN) | +0.14% |
| USDINR(IND) | +0.12% |
| USDRUB(RUS) | -0.53% |
| USDZAR(ZAF) | -1.93% |
| Agricultural | |
|---|---|
| Cotton | +3.23% |
| Feeder Cattle | +2.54% |
| Lean Hogs | -11.45% |
| Wheat | -2.75% |
| Orange Juice | +18.33% |
| Soybeans | +1.64% |
| Cocoa | +1.34% |
| Coffee (Arabica) | -4.16% |
| Coffee (Robusta) | -0.49% |
| Corn | -1.24% |
| Soybean Meal | +1.76% |
| Sugar #11 | +0.70% |
| Cattle | +4.10% |
| Lumber | +5.94% |
| White Sugar | +0.05% |
| Index | Change |
|---|---|
| Markit CDX NA HY | -0.72% |
| Markit CDX NA IG | +3.83% |
| Markit iTraxx Asia ex-Japan IG | -4.14% |
| Markit iTraxx Australia | -2.90% |
| Markit iTraxx Europe | -1.84% |
| Markit iTraxx Europe Crossover | +4.46% |
| Markit iTraxx Japan | -0.38% |
| Markit iTraxx SovX Western Europe | +0.27% |
| Markit LCDX (Loan CDS) | +0.00% |
| Markit MCDX (Municipal CDS) | +0.56% |
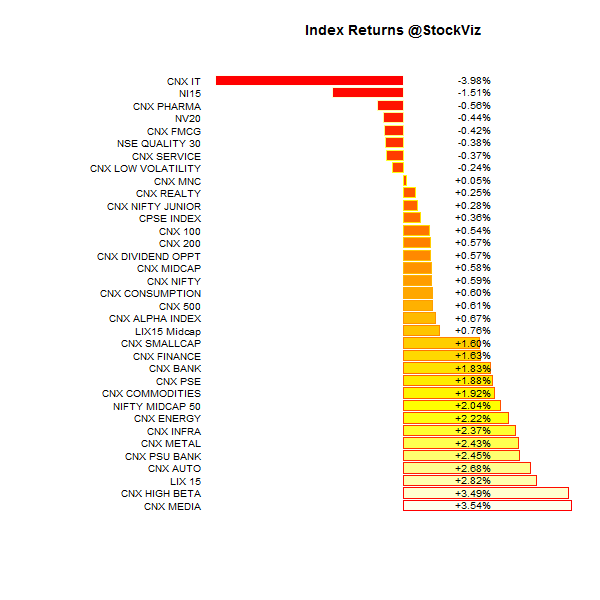
For a deeper dive into indices, check out our weekly Index Update.
| Decile | Mkt. Cap. | Adv/Decl |
|---|---|---|
| 1 (micro) | +1.34% | 76/59 |
| 2 | +3.26% | 81/53 |
| 3 | +3.42% | 72/62 |
| 4 | +3.84% | 73/62 |
| 5 | +2.85% | 75/59 |
| 6 | +2.42% | 76/58 |
| 7 | +2.29% | 72/63 |
| 8 | +2.89% | 73/61 |
| 9 | +0.95% | 73/61 |
| 10 (mega) | +0.47% | 75/60 |
| INFRABEES | +3.03% |
| BANKBEES | +1.98% |
| PSUBNKBEES | +1.66% |
| GOLDBEES | +1.50% |
| NIFTYBEES | +0.67% |
| JUNIORBEES | +0.55% |
| CPSEETF | +0.32% |
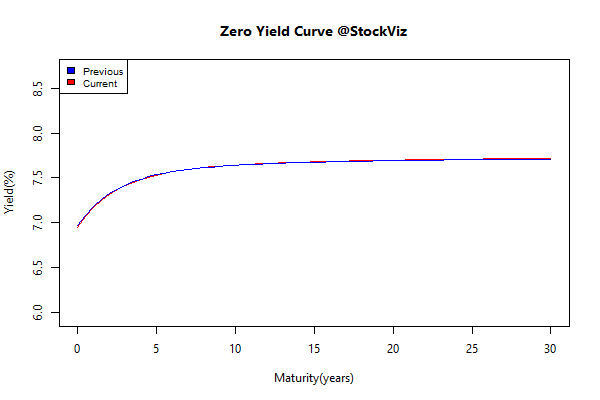
| Sub Index | Change in YTM | Total Return(%) |
|---|---|---|
| 0 5 | -0.01 | +0.16% |
| 5 10 | +0.02 | +0.05% |
| 10 15 | +0.03 | -0.04% |
| 15 20 | +0.00 | +0.13% |
| 20 30 | -0.03 | +0.41% |
| ADAG stocks | +6.64% |
| The RBI Restricted List | +6.35% |
| High Beta | +4.09% |
| Magic Formula | +3.83% |
| PPFAS Long Term Value | +3.49% |
| Quality to Price | +3.15% |
| Financial Strength Value | +1.48% |
| Momentum | +1.38% |
| Velocity | +0.87% |
| Tactical CNX 100 | +0.06% |
| Balance Sheet Strength | -0.30% |
| Next Trillion | -0.42% |
| ASK Life | -0.52% |
| Enterprise Yield | -0.71% |
| Low Volatility | -1.50% |
The investing cycle of good ideas goes something like this:
Early adopters find an anomaly and exploit it for huge gains. More and more smart money begins to figure out this apparent loophole and competition means lower profits to go around. Next come the academics with their research papers that get published in the trade journals and such. Finally, Wall Street picks up on the trend and does their part to create more products than are needed to help everyone else finally jump in on the fad, usually just as the cycle is about to turn.
Source: When Evidence Fails
Most mutual fund investors chase recent performance. However, experience shows that alpha, or out-performance, is rarely sustained in the fund universe. To visualize how alpha fluctuates across different time-periods, we extended the relative strength spread notion of stocks to mutual funds. By normalizing performance across multiple funds vs. a single benchmark, the CNX 500 index, we can get a sense for how stable the alpha is.
Have a look at the RS-Spread chart of the HDFC Growth Fund:
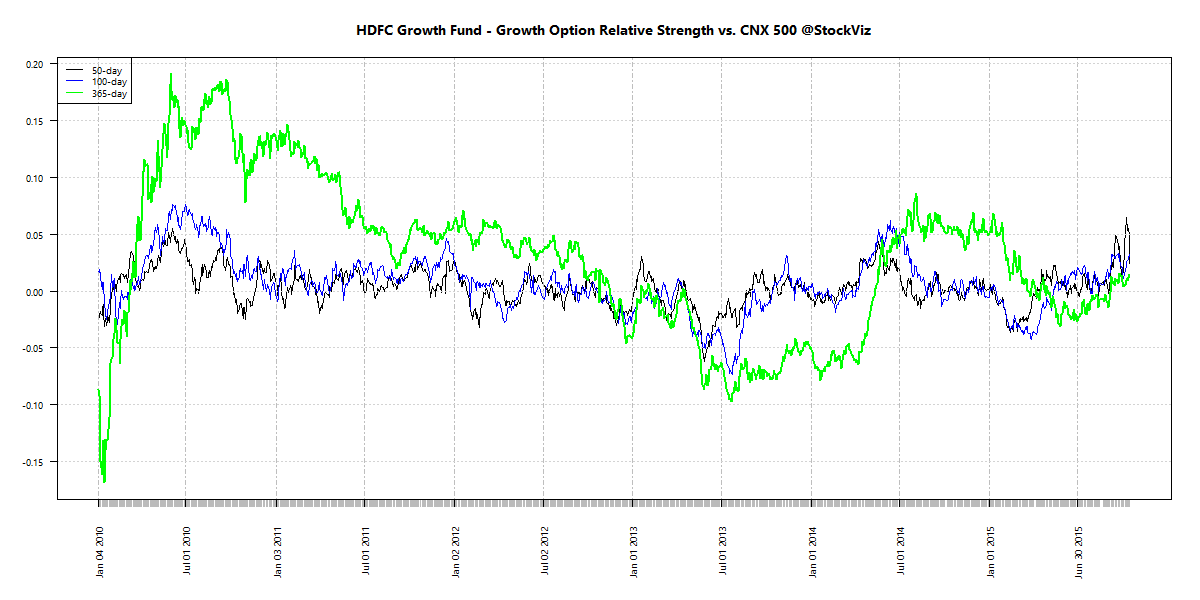
Notice how 1-year alpha was below zero between Oct’2012 and May’2014 and is now back below zero again. This should indicate that whatever strategy the fund is employing is not that great in generating sustainable alpha. Now compare that to the Birla Sun Life Frontline Equity Fund:
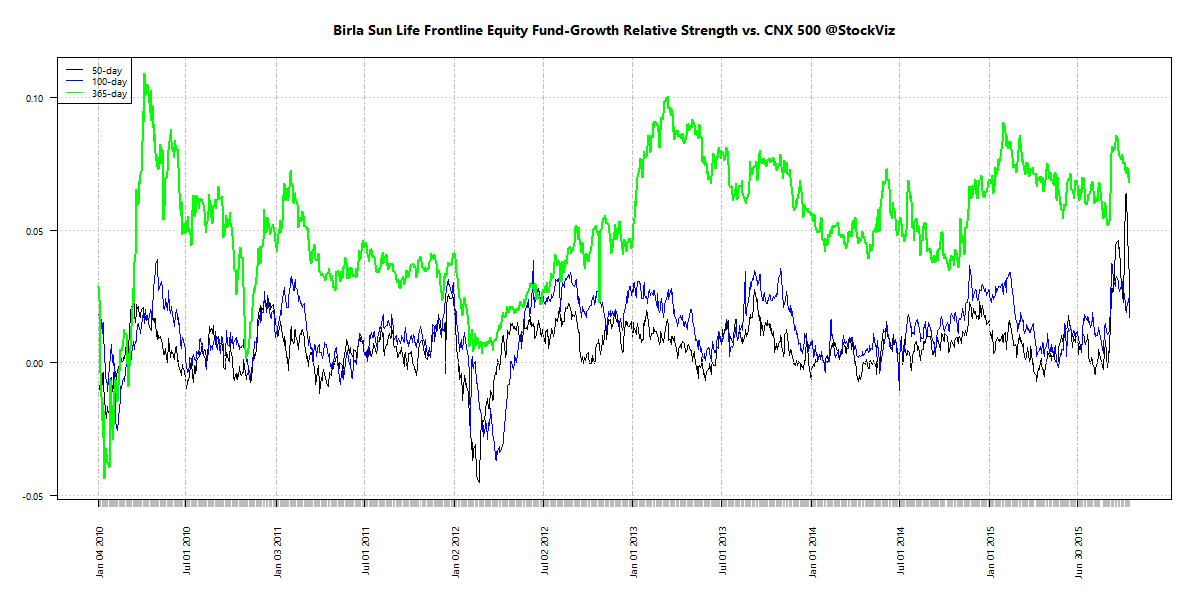
Notice how the fund has managed to outperform over the last 5-years. Here’s the MNC fund’s RS-Spread chart:
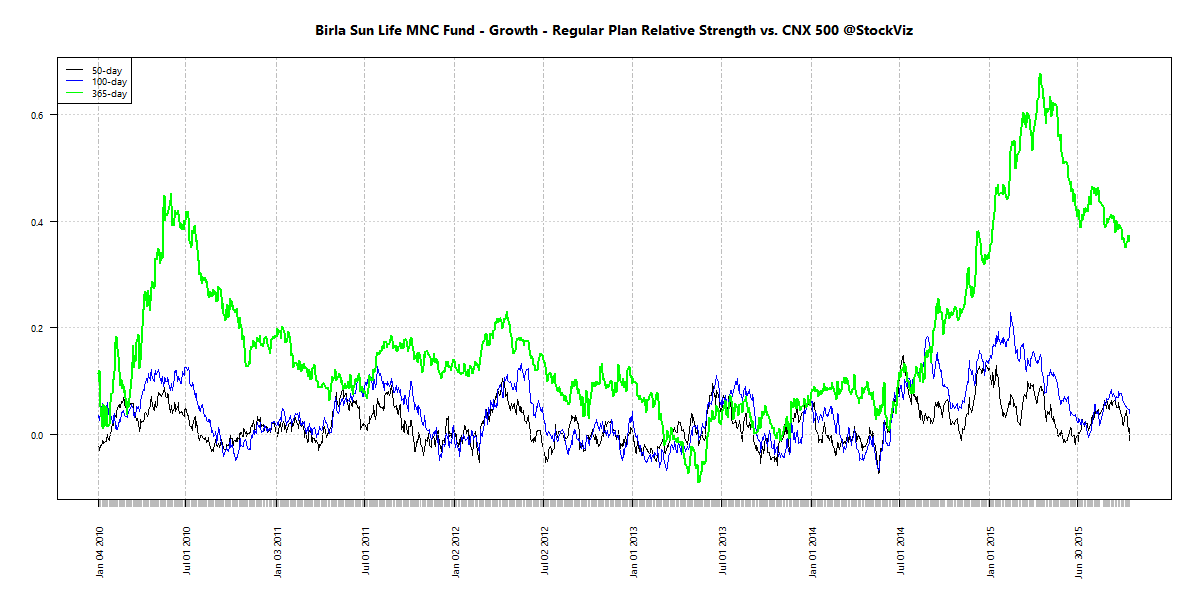
We update these charts daily for more than 100 funds. You can access them through our FundCompare tool. If you have any questions, give us a call or Whatsapp us!