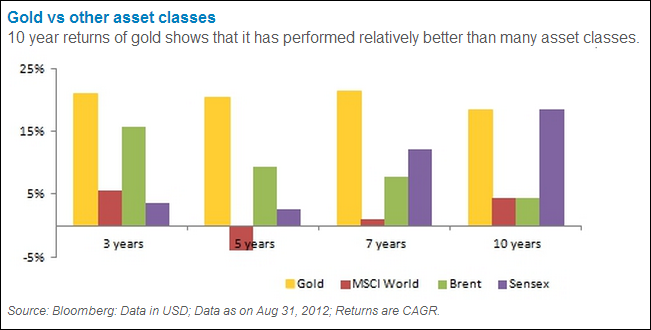
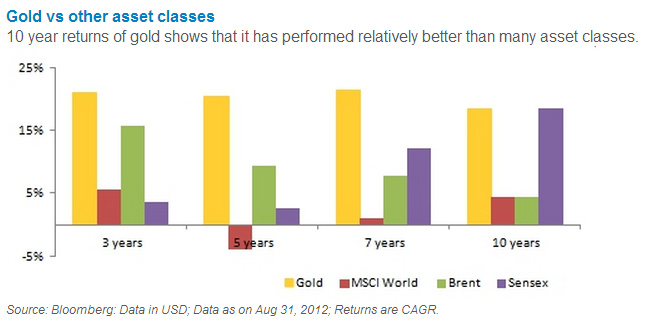
The yellow metal is on course to record sparkling returns for third year in row despite a strong year for equities.
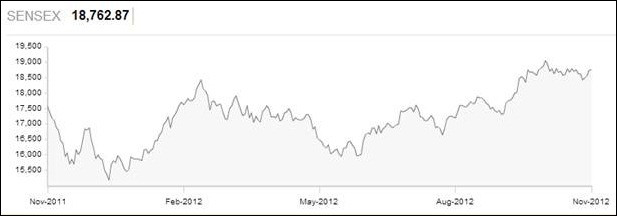
While investors in gold have reaped over 15% returns since last Diwali, the returns from Sensex has been a fixed deposit-like gain of about 8.5 % for the same period.
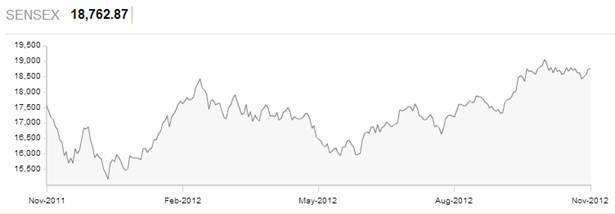
While the precious metal has risen from Rs 26,700 levels last Diwali to Rs 30,700 currently, the BSE benchmark Sensex has risen from near-17,300 levels to 18,755 since last Diwali. Gold prices have also more than tripled from Rs 10,000 levels to Rs 31,000 in the last five years. India is the largest consumer of gold with an annual demand of about 700 tonnes.
The fact that gold jewelry and investment demand remains robust despite the rising prices is a reflection of the inherent desire among Indians to hold gold driven mainly by its alluring appeal as a jewelry and as a safe-haven against inflation that erodes both savings and income.
The impact of the European sovereign debt crisis, inflationary pressures and the still-shaky outlook for economic growth in developed countries is driving high levels of investment demand for the precious metal.
From gold coins, gold jewelry to MFs and ETFs, robust consumer appetite in gold’s cultural heartlands, India and China, has seen global prices rise from $270 an ounce in 2001to more than $1700 an ounce as on November this year. India, the world’s largest gold consumer and China account for over 55% of global gold jewelry demand and 52% gold investment demand.
Gold is being seen as a safest hedge against credit risk, currency risk and inflation that has besieged the financial world in the last decade. With the financial world navigating from one hurdle to another like the mortgage crisis to the banking crisis to the current sovereign debt crisis, investors have sought refuge under gold to protect their wealth.
![clip_image002[7]](http://stockviz.biz/wp-content/uploads/2012/11/clip_image0027_thumb.jpg)
Apart from sluggish growth in stock markets and high inflation rates, a spurt in central banks gold buying since 2009 after being net seller for over two decades has also contributed significantly to demand and thereby prices.
Off late, gold ETF investments are gaining ground at a rapid pace and are increasingly emerging as preferred route for long term investment in gold.

Despite the Finance Ministry’s measures to discourage investments in gold, assets under management of gold ETFs crossed the Rs 11,000 crore mark in September this year from Rs 10,701 crore in August and Rs 5,000 cr in May 2011, reflecting the robust appetite for the yellow metal.
Even as jewelry demand has been declining due to the volatile prices, a reflection of the price-sensitive nature of this segment, the rush for gold ETFs has meant that AUMs have soared from Rs 138 crore in April 2007 to Rs 11,198 crore in September, 2012 — over 80 times in 5 years.
With Diwali and Dhanteras round the corner, festive flavor is expected to add more color to the yellow metal and garner greater portfolio share of investors.
[stockquote]GOLDBEES[/stockquote]


![clip_image002[7]](http://stockviz.biz/wp-content/uploads/2012/11/clip_image0027.jpg)