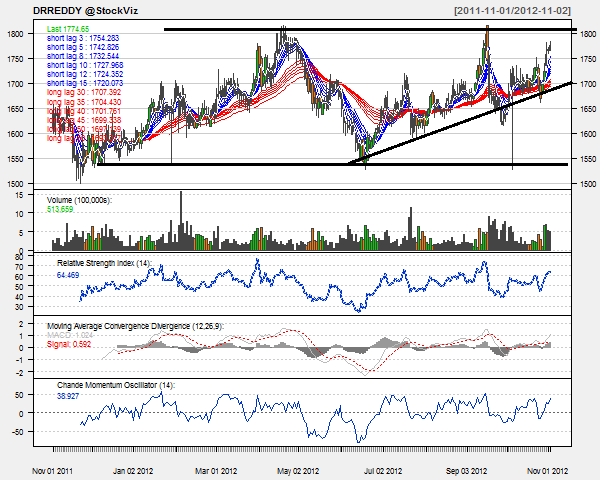
Today’s pick is [stockquote]KTKBANK[/stockquote]. The last year saw the stock trading in a 60 to 140 range and the stock is in an up-trend since its Jan lows; The stock just saw 52-week highs at 140 levels. In the last three month period, the stock is up 42% vs. the Nifty’s 8%.

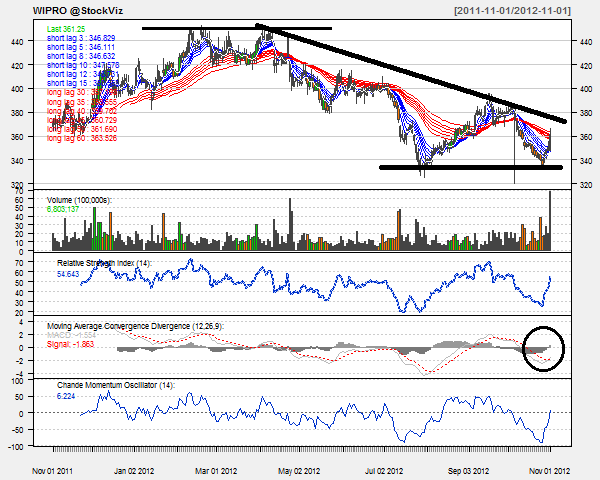
Oscillators RSI and CMO are currently at 69 and 36 and are close to the over-bought territory.
MACD line and the signal line are moving very close to each other and the histogram levels are steady – signaling a short-term consolidation in progress.
The GMMA chart shows both long-term and short-term lines fanning out. This is an extremely bullish signal for the stock.
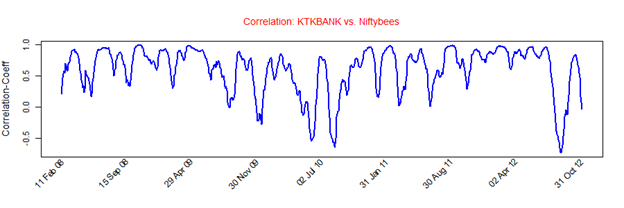
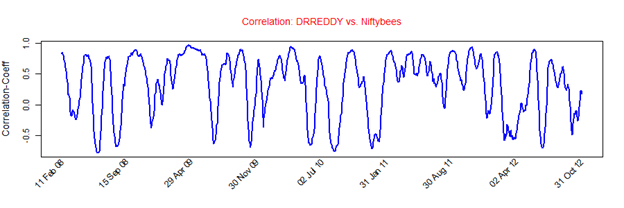
KTKBANK’s average correlation of 0.6 with the Nifty is positive and strong. The stock will replicate the movements of Nifty closely. [stockquote]NIFTYBEES[/stockquote]
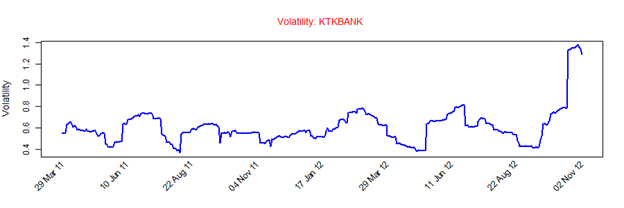
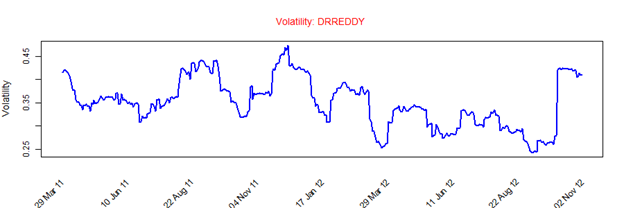
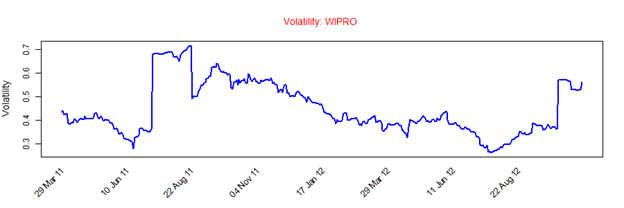
KTKBANK had a historical volatility in the range of 0.4 to 0.8 till Sep 12, after which we see a rise in the volatility. This high volatility asks for a cautious outlook for the stock.
Looking at these technicals a short-term hold is suggested. Although, the spreading GMMA lines are giving a strong long-term buy signal for the stock.