Equities
| MINTs | |
|---|---|
| JCI(IDN) | +0.87% |
| INMEX(MEX) | +0.56% |
| NGSEINDX(NGA) | +0.15% |
| XU030(TUR) | +4.55% |
| BRICS | |
|---|---|
| IBOV(BRA) | +0.50% |
| SHCOMP(CHN) | +2.44% |
| NIFTY(IND) | +0.86% |
| INDEXCF(RUS) | -1.00% |
| TOP40(ZAF) | +0.46% |
Commodities
| Energy | |
|---|---|
| Heating Oil | +2.84% |
| Natural Gas | +5.05% |
| Brent Crude Oil | +2.55% |
| Ethanol | +1.51% |
| RBOB Gasoline | +3.42% |
| WTI Crude Oil | +1.20% |
| Metals | |
|---|---|
| Palladium | -0.93% |
| Platinum | +2.16% |
| Copper | +0.68% |
| Gold 100oz | +3.18% |
| Silver 5000oz | +6.71% |
Currencies
| MINTs | |
|---|---|
| USDIDR(IDN) | -0.28% |
| USDMXN(MEX) | -0.89% |
| USDNGN(NGA) | -0.82% |
| USDTRY(TUR) | -4.46% |
| BRICS | |
|---|---|
| USDBRL(BRA) | +0.33% |
| USDCNY(CHN) | -0.05% |
| USDINR(IND) | -0.66% |
| USDRUB(RUS) | -2.79% |
| USDZAR(ZAF) | -1.12% |
| Agricultural | |
|---|---|
| Feeder Cattle | +1.40% |
| Lumber | +1.75% |
| Soybean Meal | -3.65% |
| Soybeans | -3.18% |
| Sugar #11 | -3.45% |
| Cattle | +0.69% |
| Cocoa | +4.19% |
| Coffee (Arabica) | +4.51% |
| Coffee (Robusta) | -0.82% |
| Corn | +1.74% |
| Cotton | +0.77% |
| Wheat | +9.13% |
| White Sugar | -3.70% |
| Lean Hogs | +2.88% |
| Orange Juice | -1.46% |
Credit Indices
| Index | Change |
|---|---|
| Markit CDX EM | +0.26% |
| Markit CDX NA HY | +0.04% |
| Markit CDX NA IG | -0.31% |
| Markit iTraxx Asia ex-Japan IG | -1.75% |
| Markit iTraxx Australia | -1.61% |
| Markit iTraxx Europe | -0.96% |
| Markit iTraxx Europe Crossover | +2.25% |
| Markit iTraxx Japan | -1.42% |
| Markit iTraxx SovX Western Europe | -0.36% |
| Markit LCDX (Loan CDS) | -0.05% |
| Markit MCDX (Municipal CDS) | +2.36% |
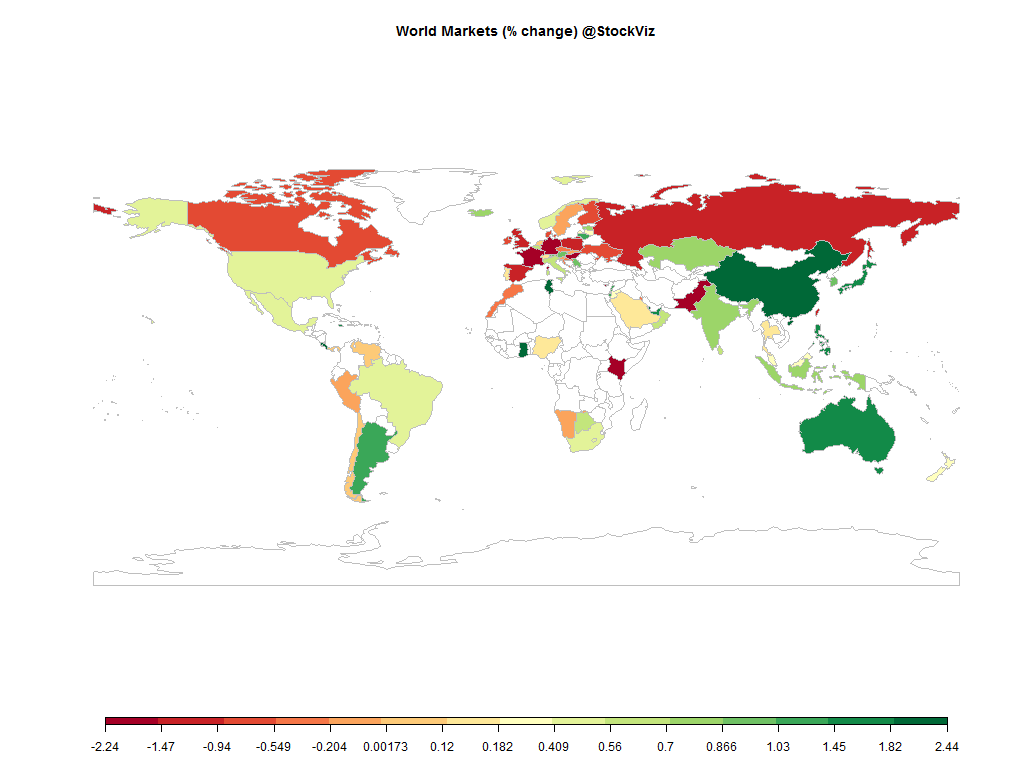
The S&P 500 made new highs – probably because rate hikes are now getting pushed back to 2016 given the sorry state of the US economy.
However, bond yields elsewhere surged higher on increasing optimism about the prospects for global economic growth. And yields may keep climbing as easy foreign central bank policies raise expectations for growth and inflation. (Schwab)
Expect more volatility ahead.
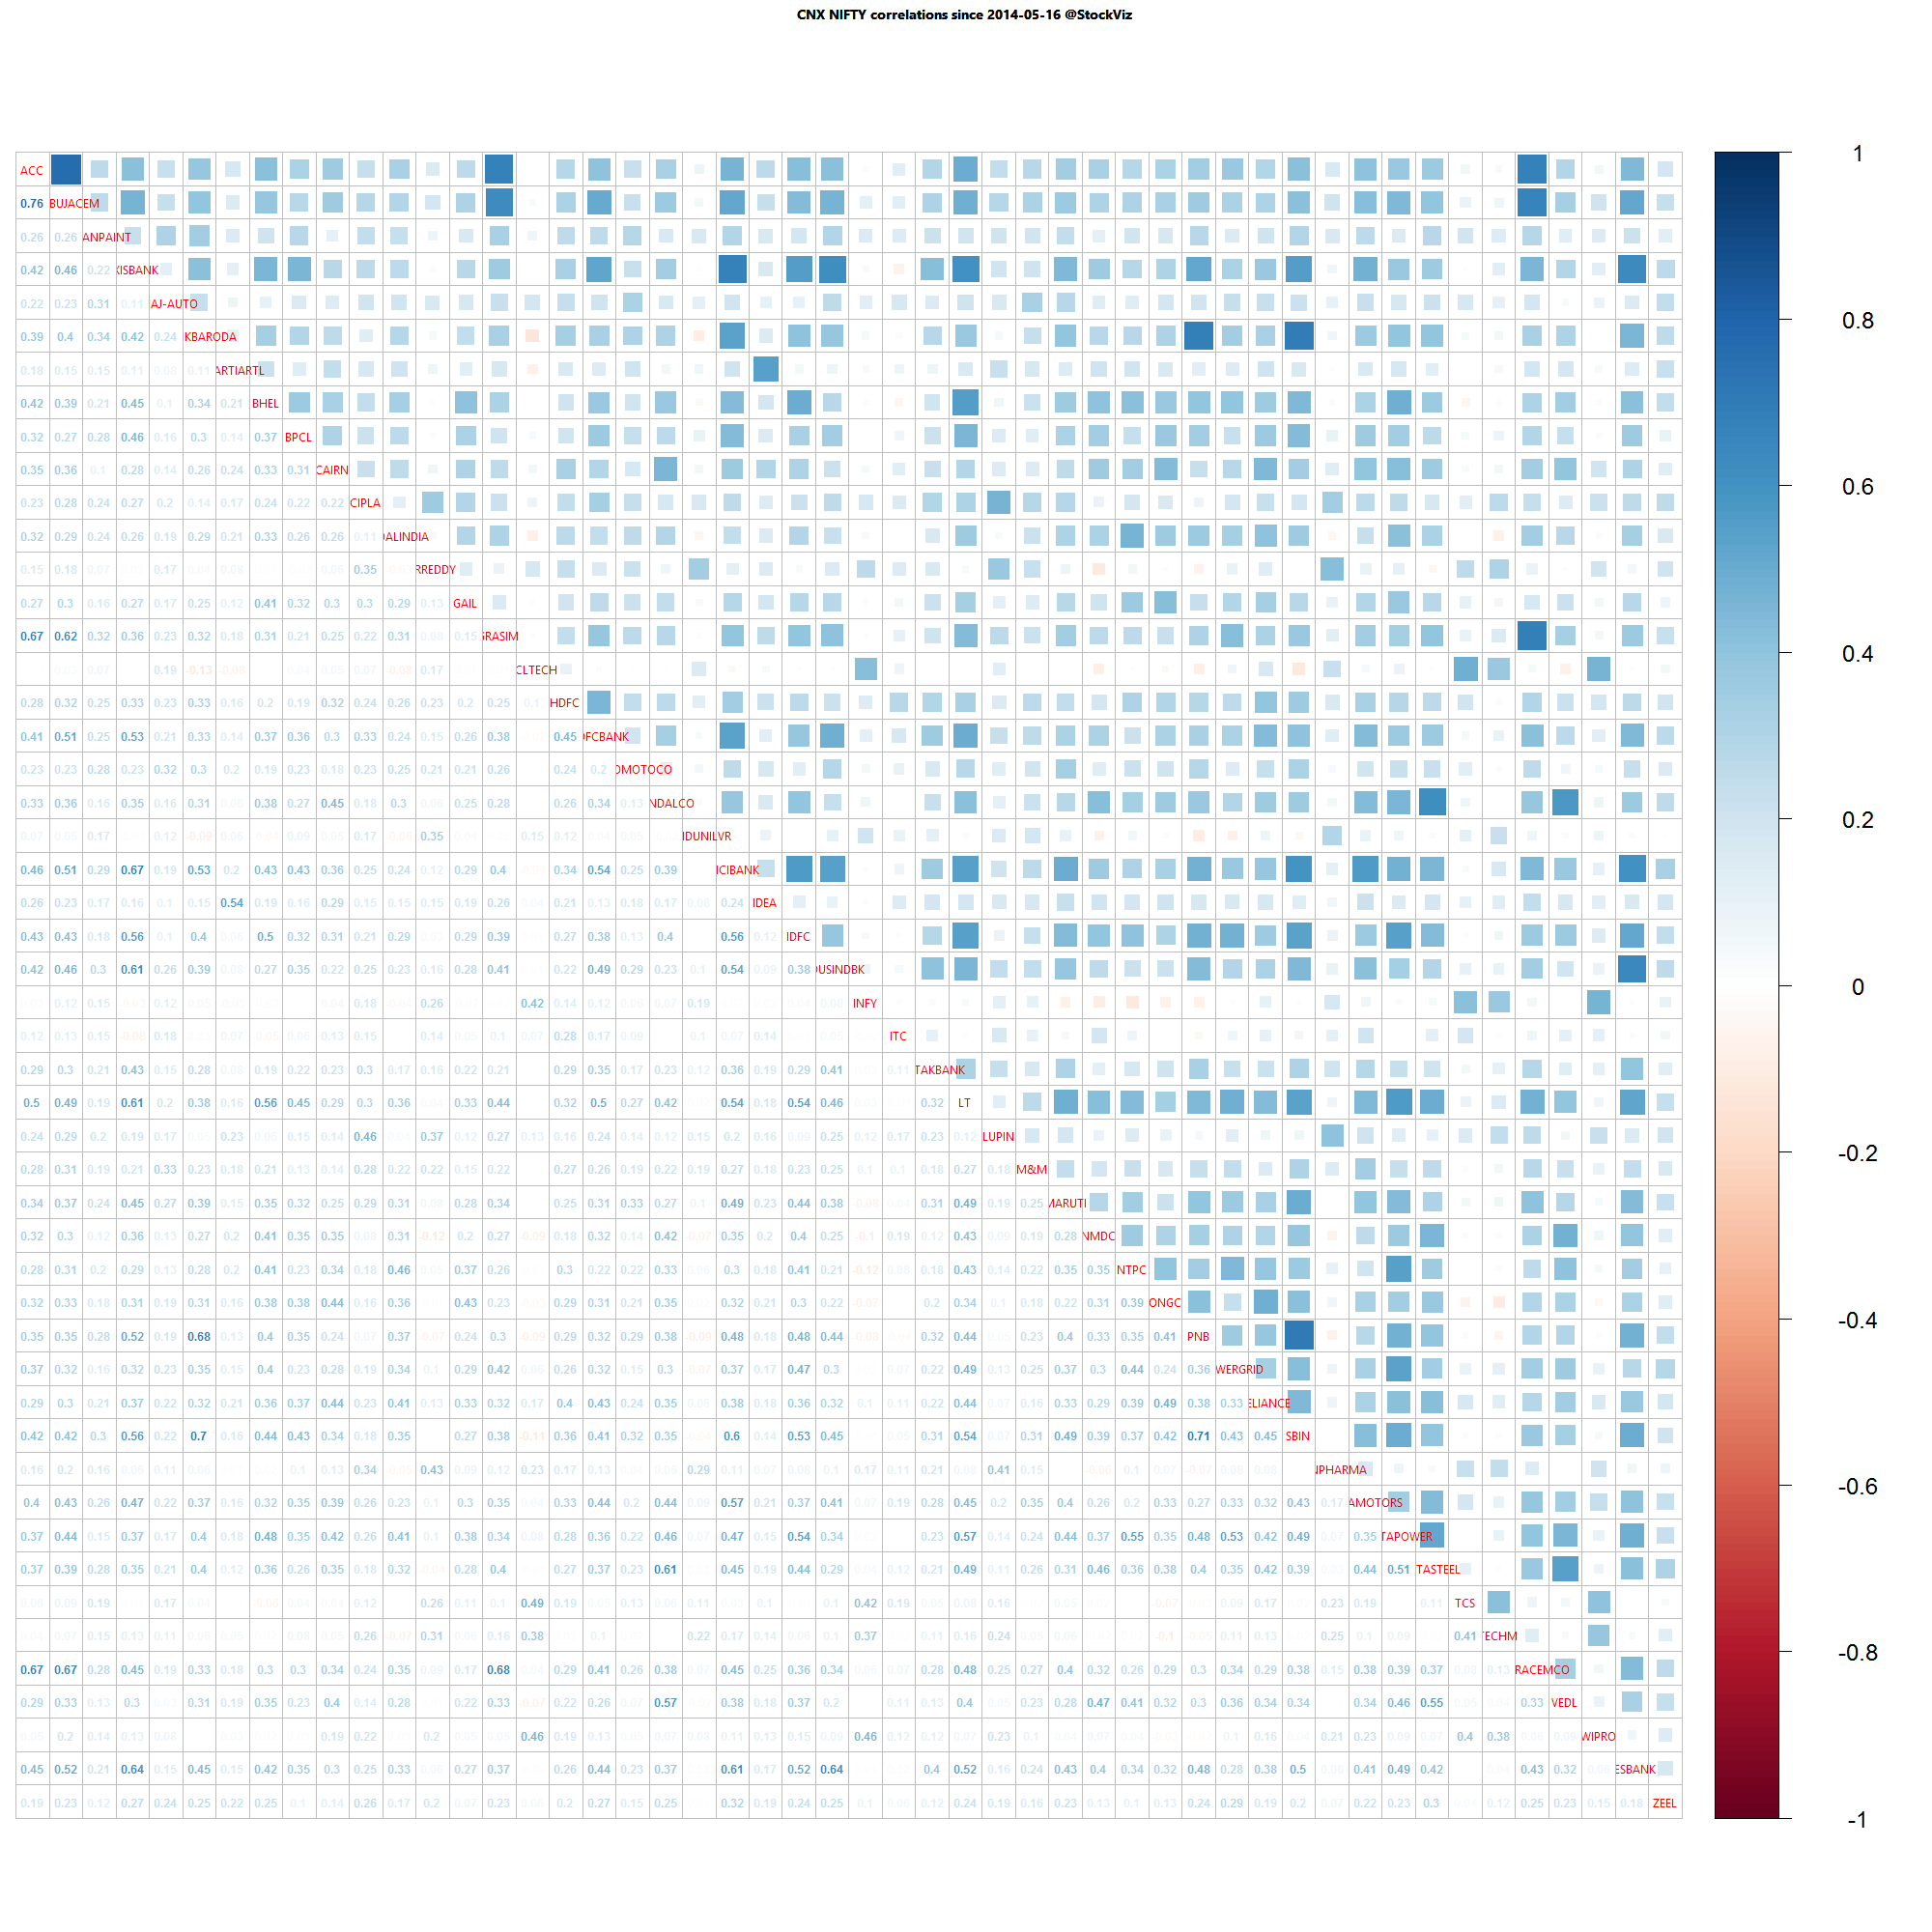
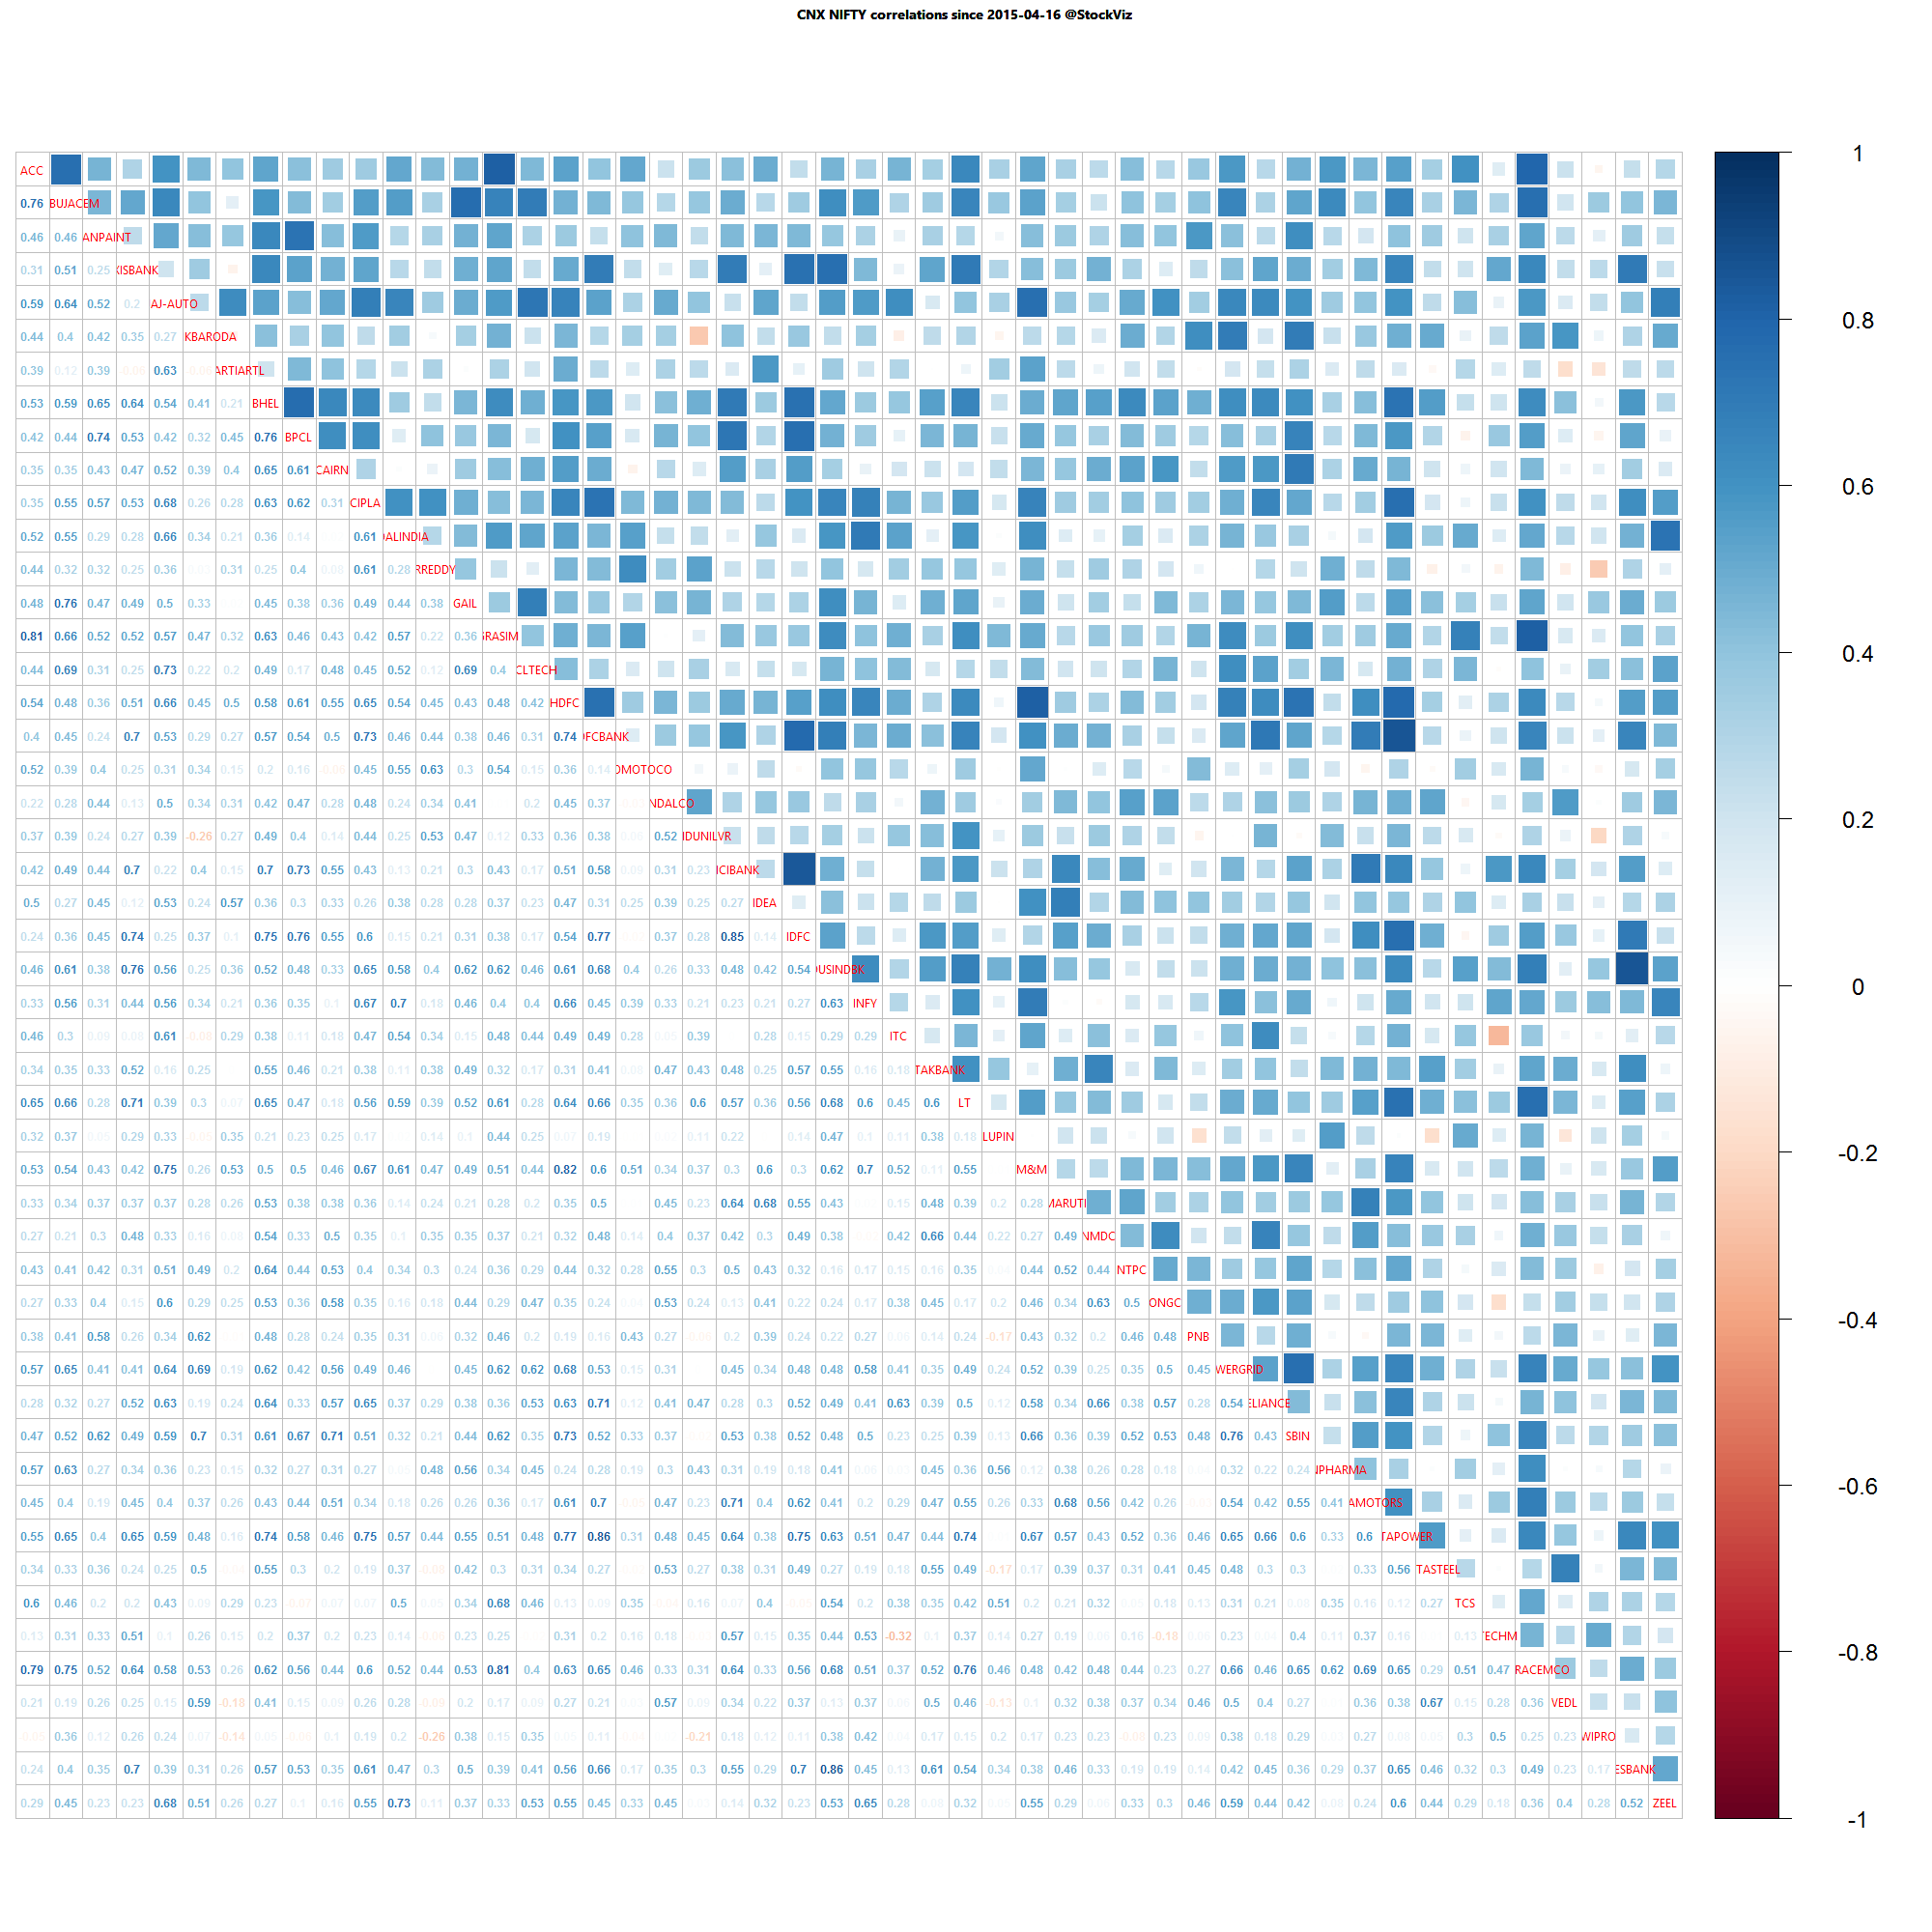
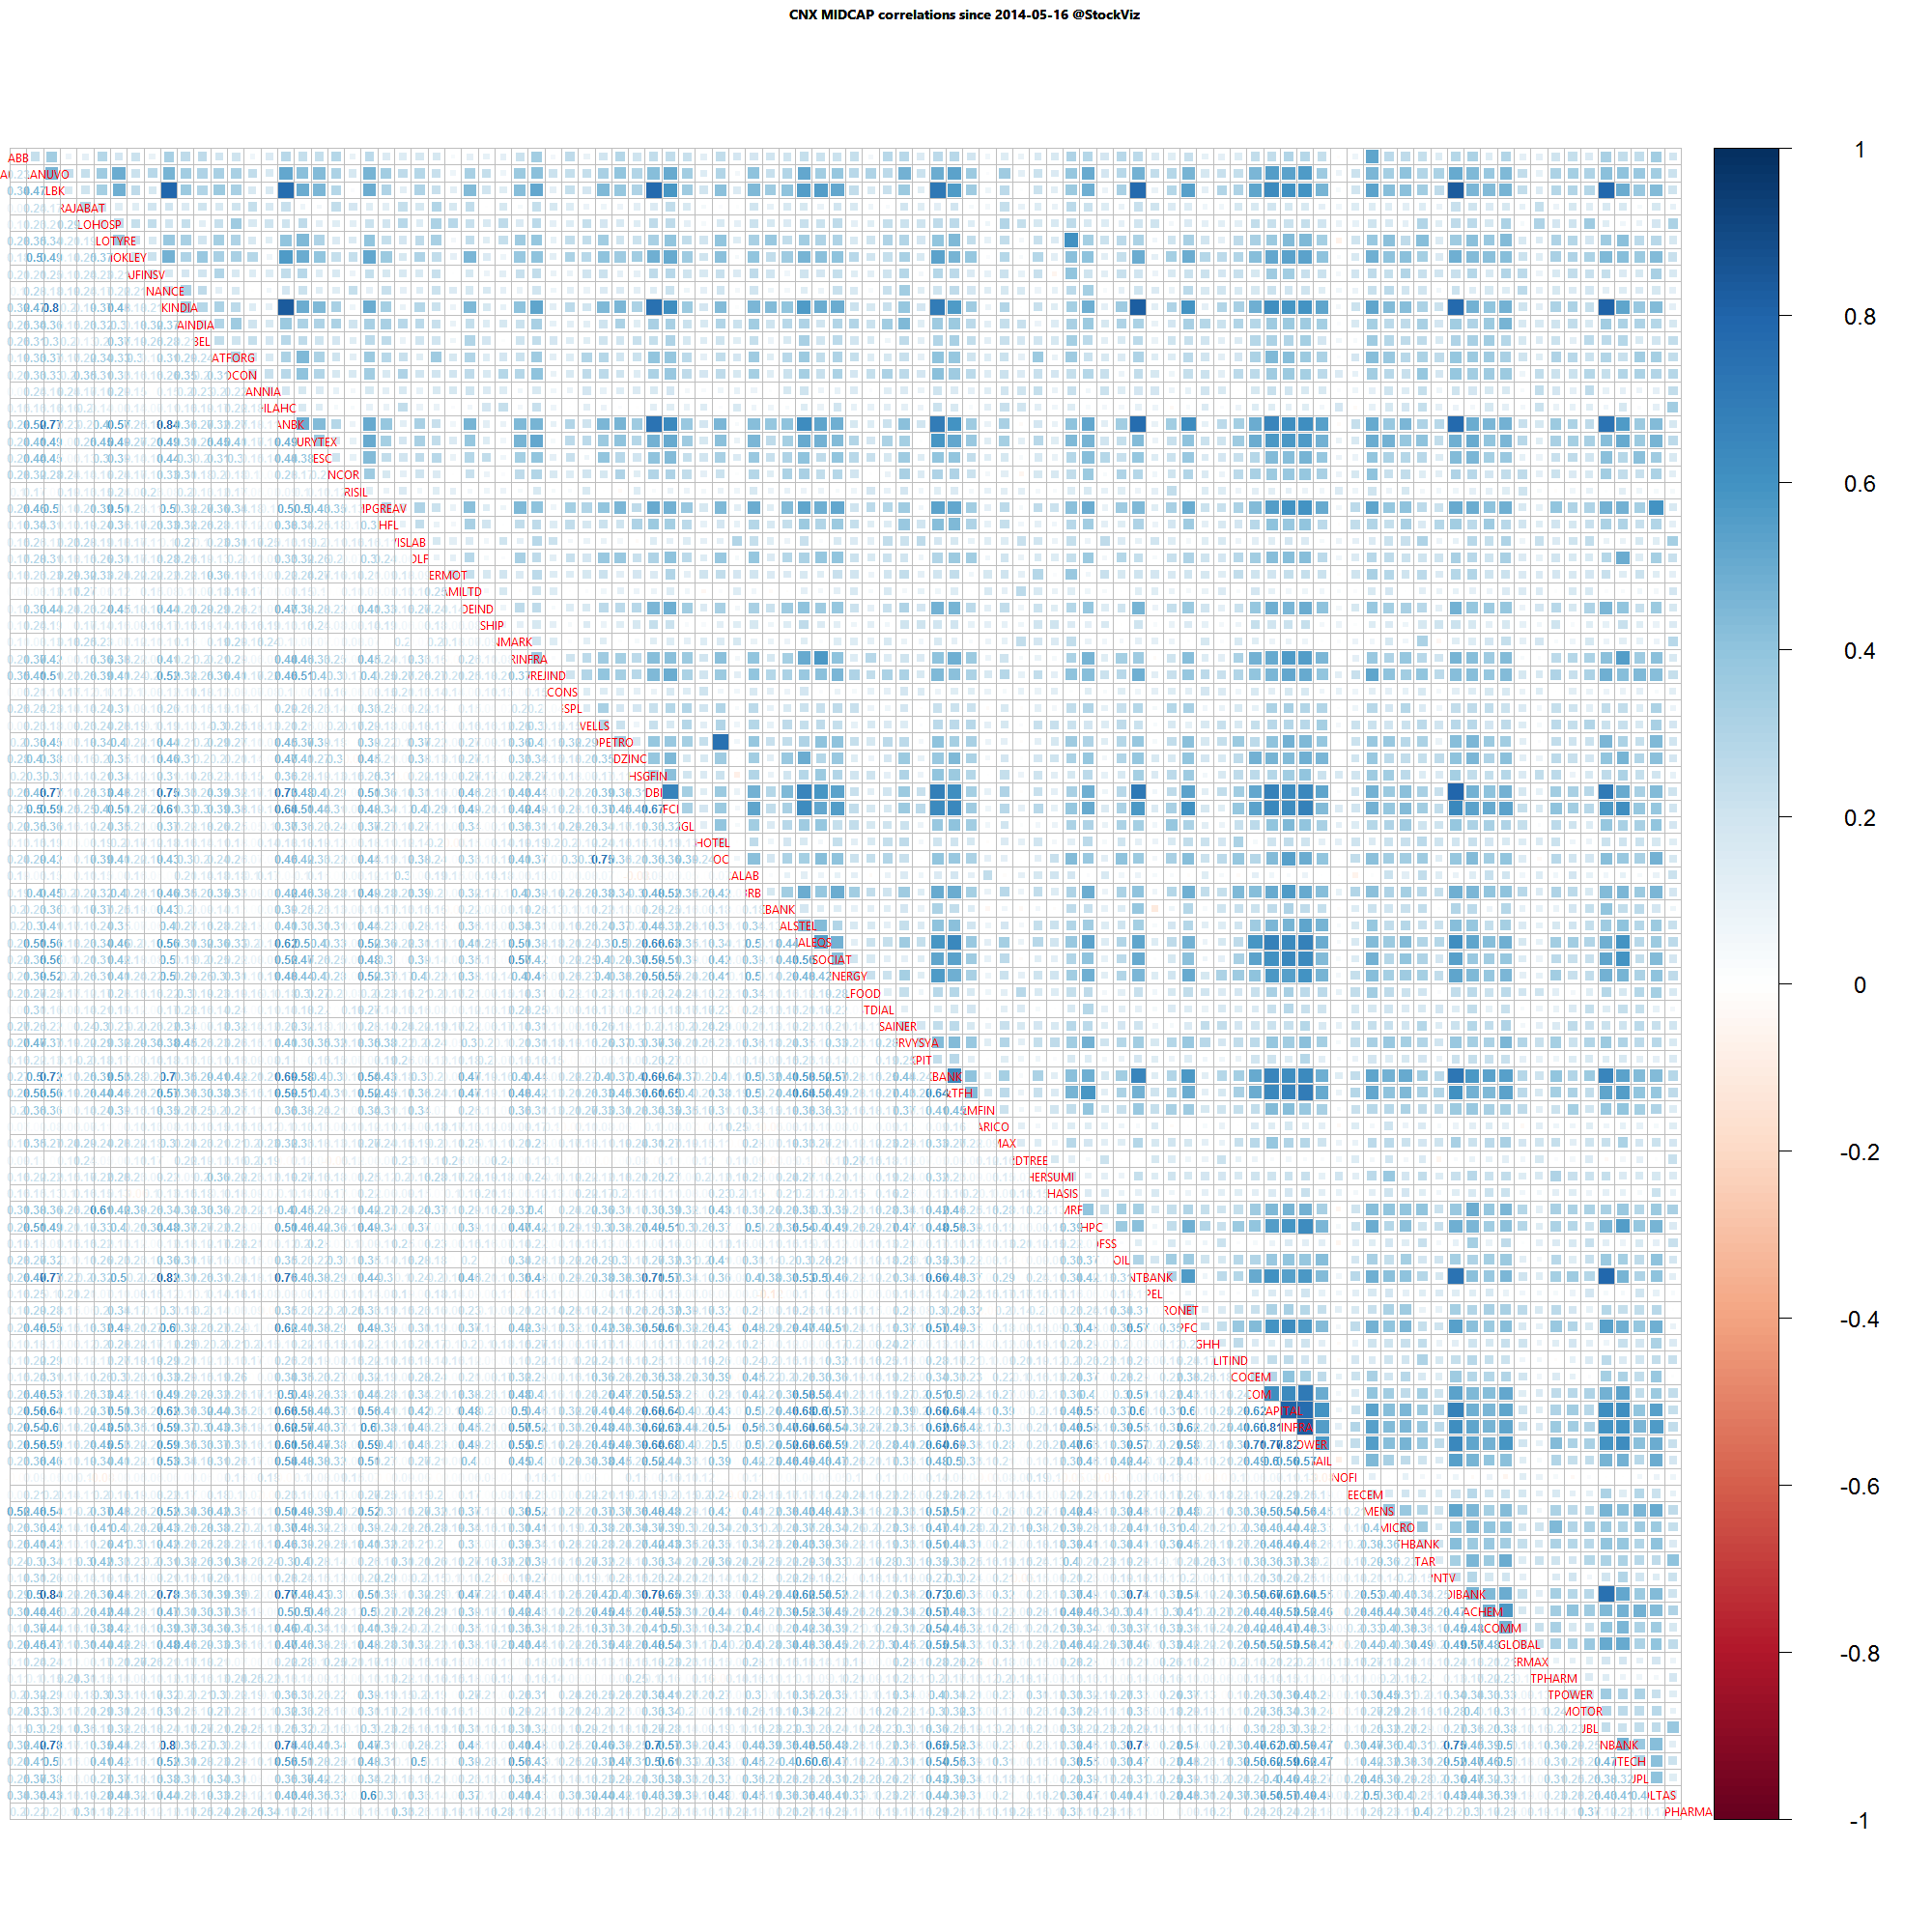
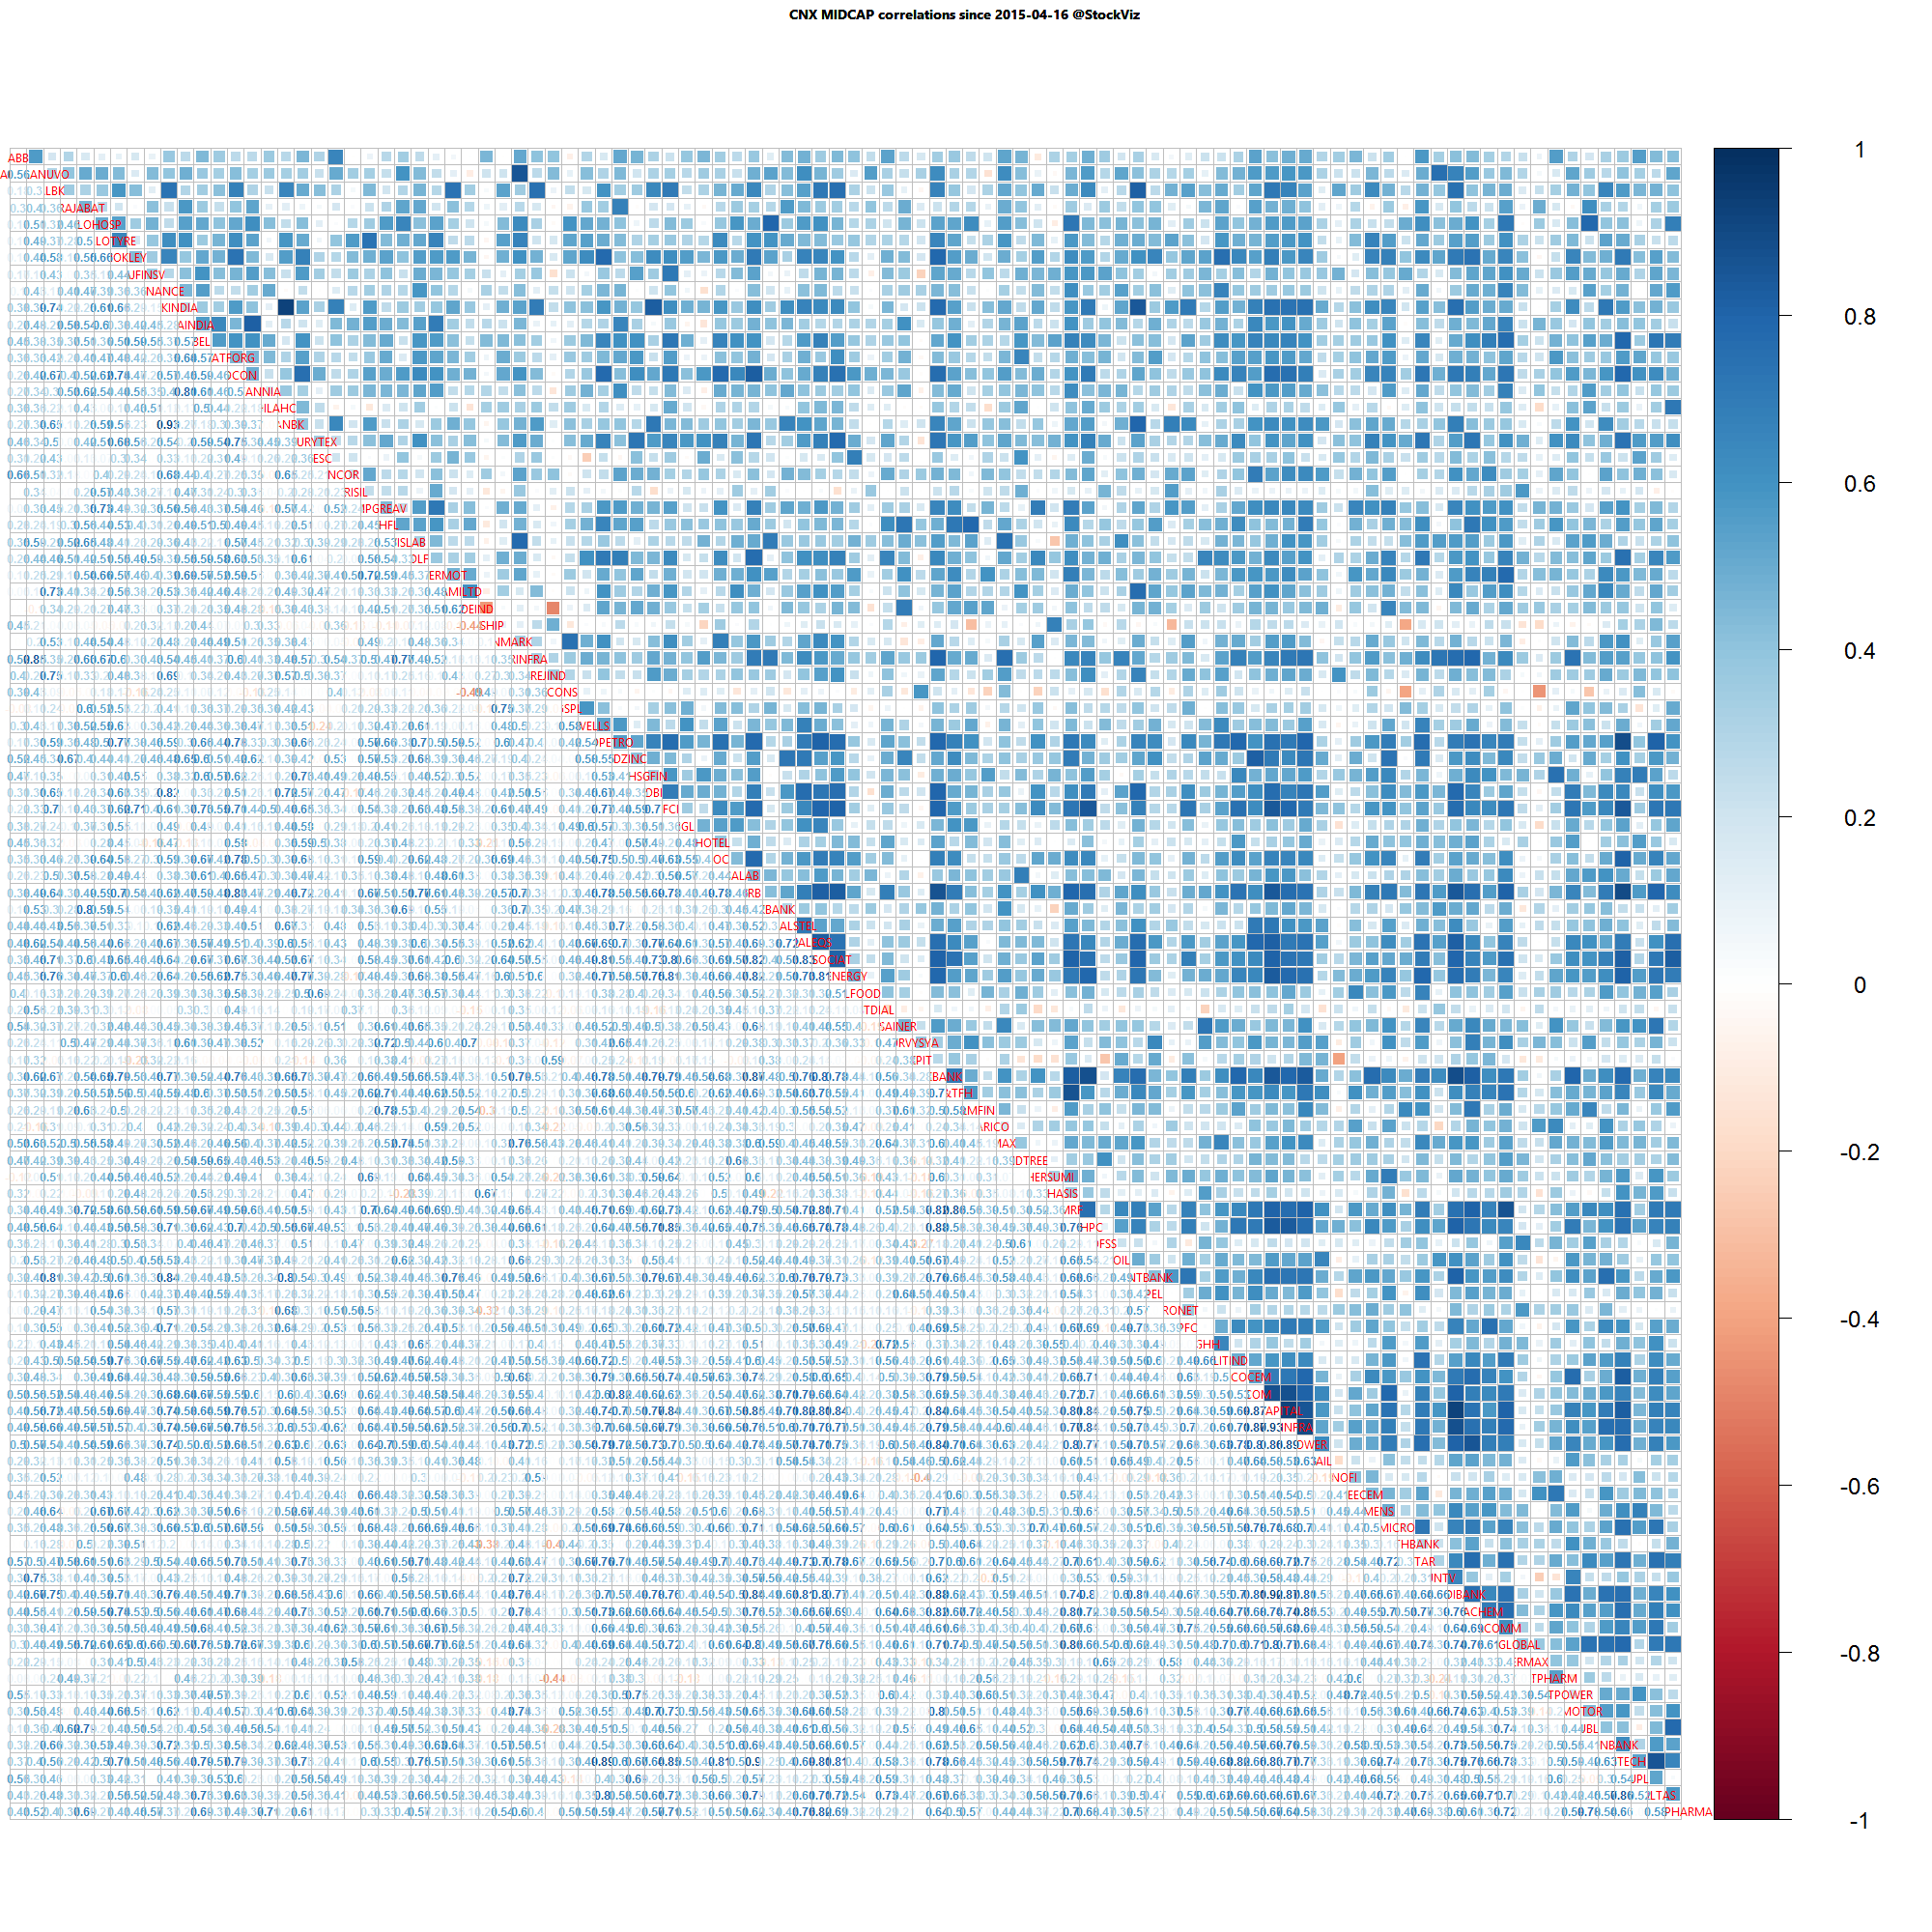
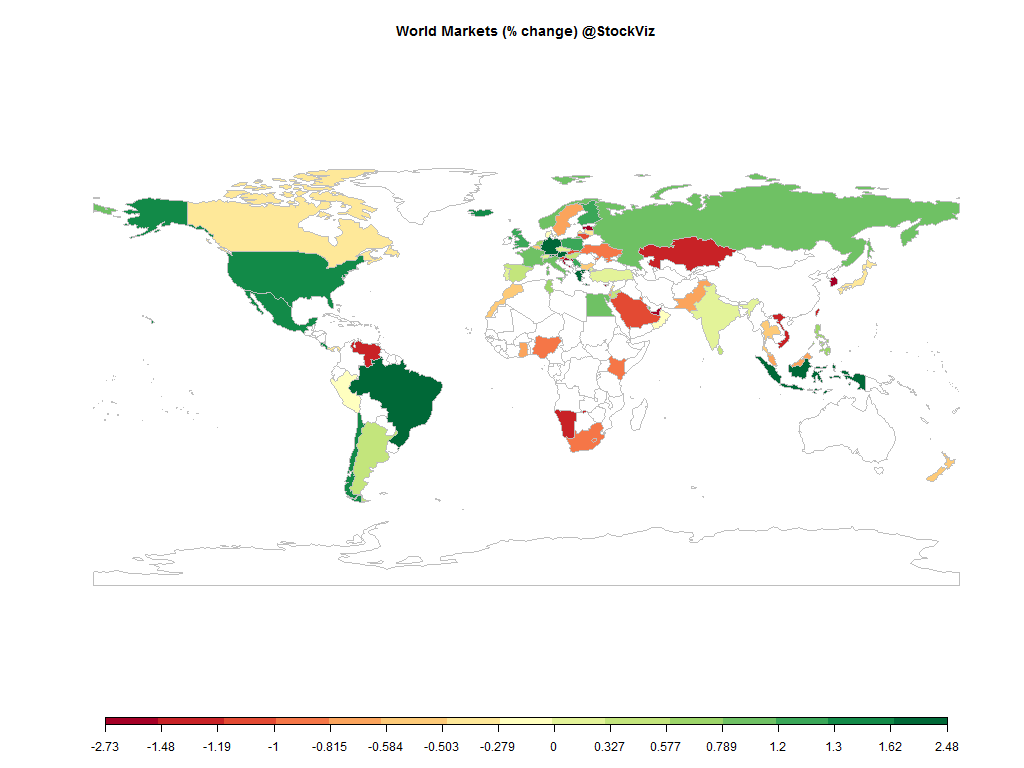
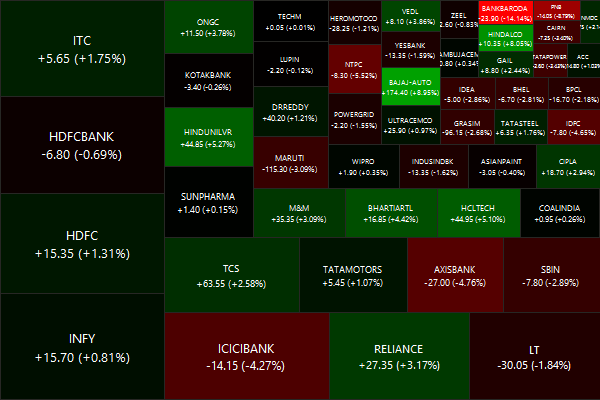
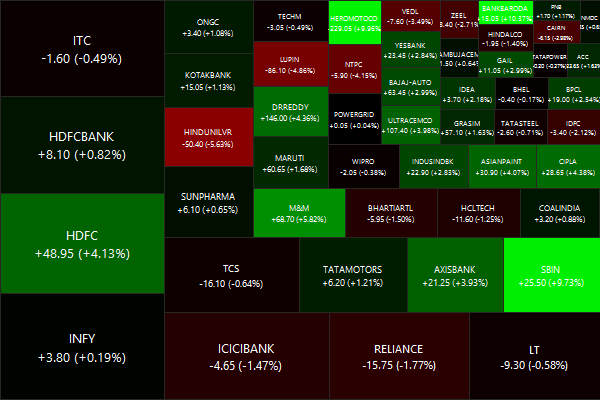
Nifty Heatmap
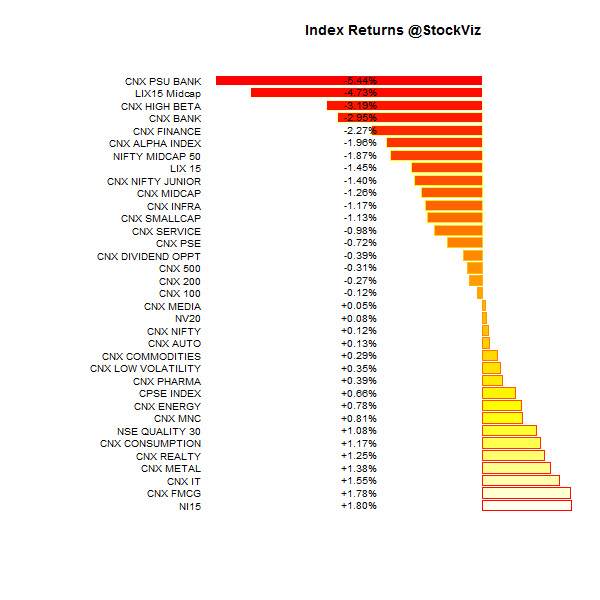
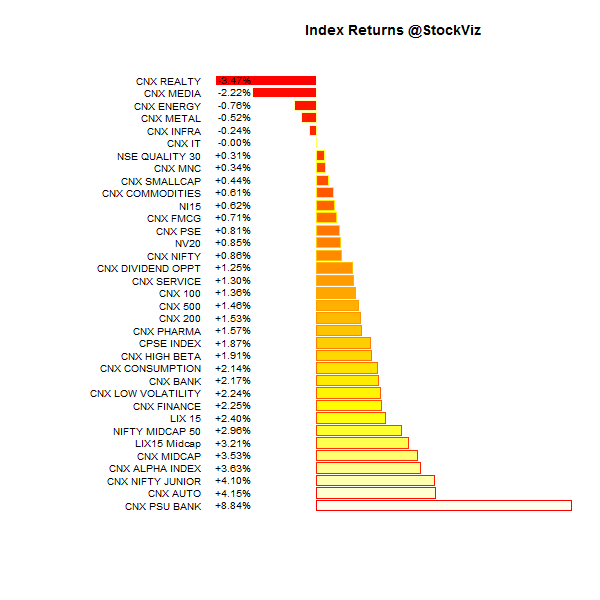
Index Returns
For a deeper dive into indices, check out our weekly Index Update.
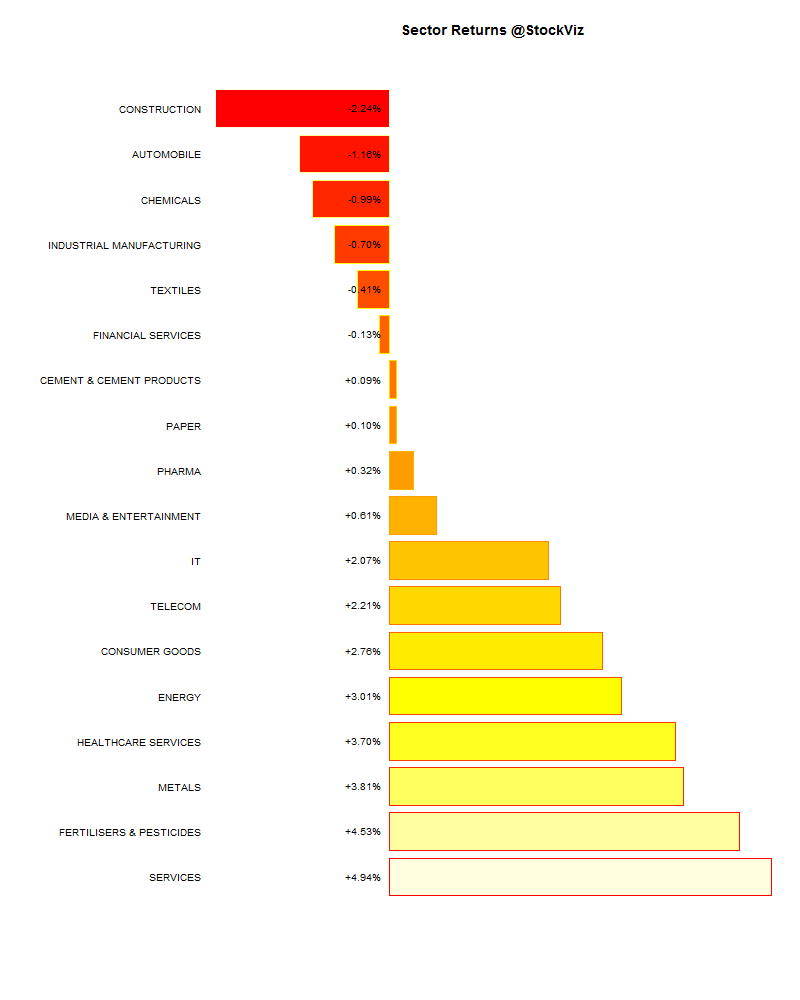
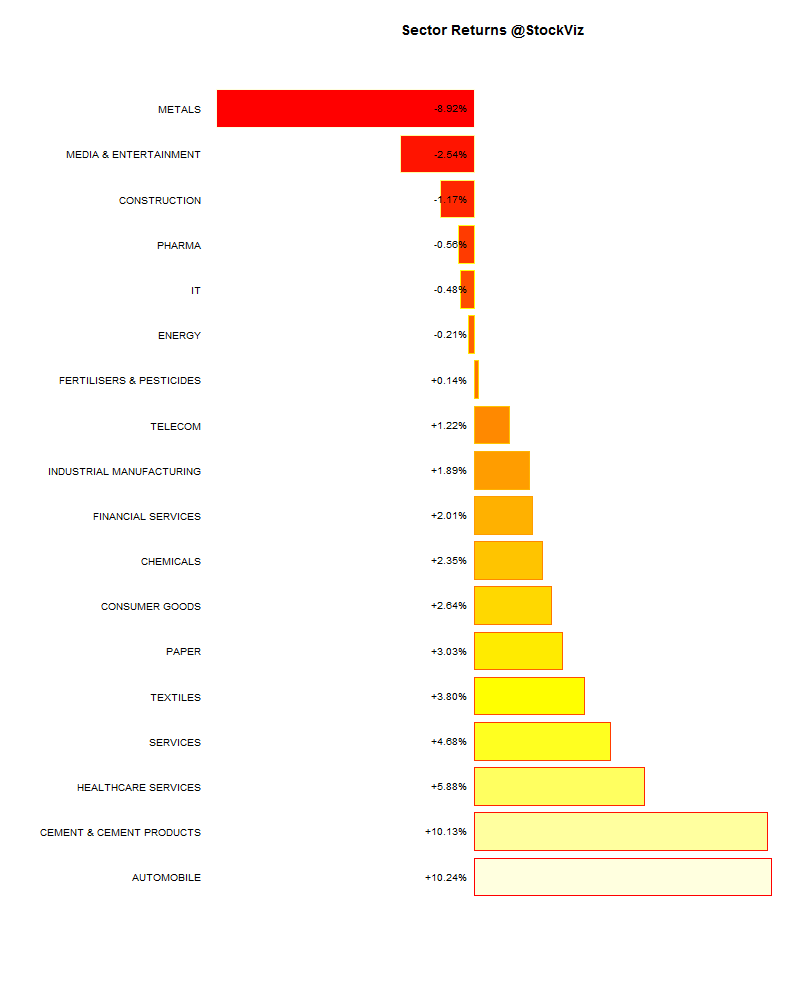
Sector Performance
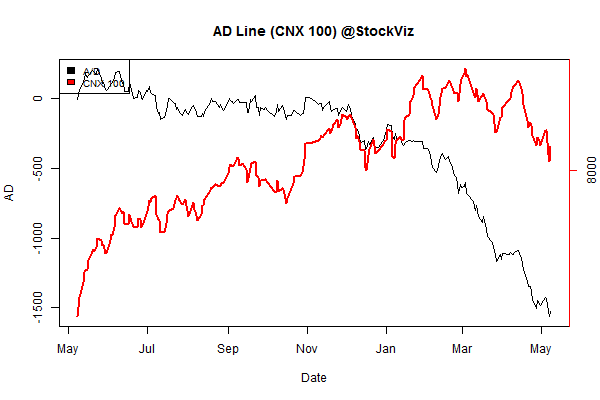
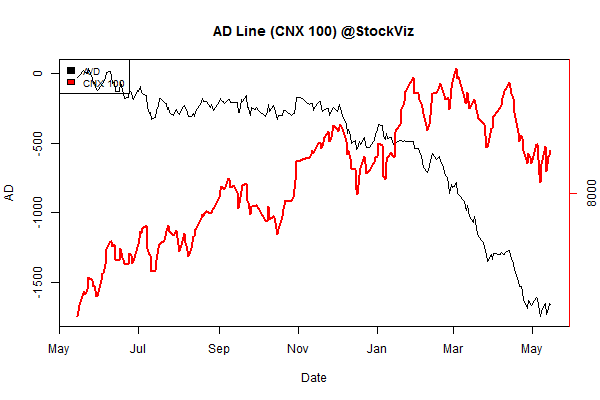
Advance Decline
Market Cap Decile Performance
| Decile | Mkt. Cap. | Adv/Decl |
|---|---|---|
| 1 (micro) | -3.11% | 63/63 |
| 2 | +2.40% | 64/65 |
| 3 | +3.08% | 63/64 |
| 4 | +3.44% | 67/61 |
| 5 | +4.35% | 71/56 |
| 6 | +3.88% | 74/54 |
| 7 | +2.57% | 65/63 |
| 8 | +2.44% | 68/59 |
| 9 | +3.13% | 65/63 |
| 10 (mega) | +3.67% | 65/63 |
Green across the board. Hopefully this marks a turning point in the markets…
Top Winners and Losers
| MCDOWELL-N | +11.86% |
| EICHERMOT | +18.64% |
| UNIONBANK | +23.06% |
| HINDUNILVR | -5.63% |
| LUPIN | -4.86% |
| NTPC | -4.15% |
Eicher Motor reminded investors that it still had a whole clip of silver bullets left…
ETF Performance
| PSUBNKBEES | +7.07% |
| JUNIORBEES | +4.43% |
| BANKBEES | +2.76% |
| CPSEETF | +2.14% |
| GOLDBEES | +1.72% |
| NIFTYBEES | +1.41% |
| INFRABEES | +0.36% |
PSU banks staged a surprise snap-back rally after being beaten to a pulp over the last couple of months. Will it sustain?
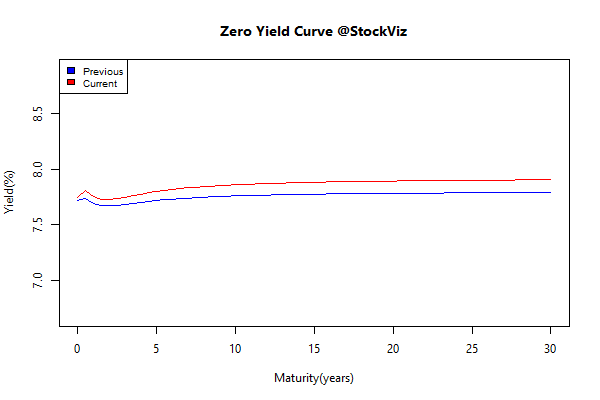
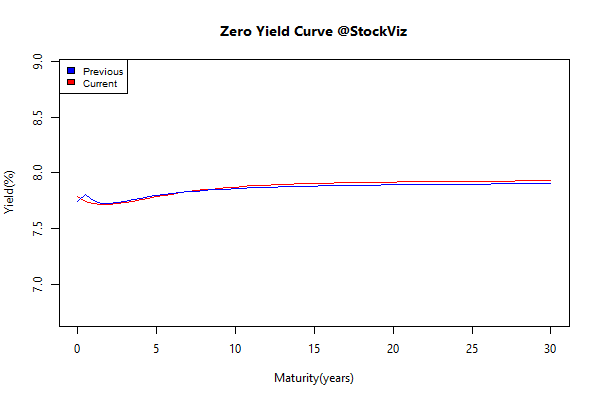
Yield Curve
Bond Indices
| Sub Index | Change in YTM | Total Return(%) |
|---|---|---|
| GSEC TB | +1.23 | -0.22% |
| GSEC SUB 1-3 | +1.04 | -1.65% |
| GSEC SUB 3-8 | +0.61 | -2.63% |
| GSEC SUB 8 | +0.42 | -3.37% |
Indian bonds sold off, following the bond carnage in Europe…
Investment Theme Performance
| Financial Strength Value | +5.46% |
| Next Trillion | +5.30% |
| Media, Health, IT, Telecom, Services, Pharma Quality To Price | +4.17% |
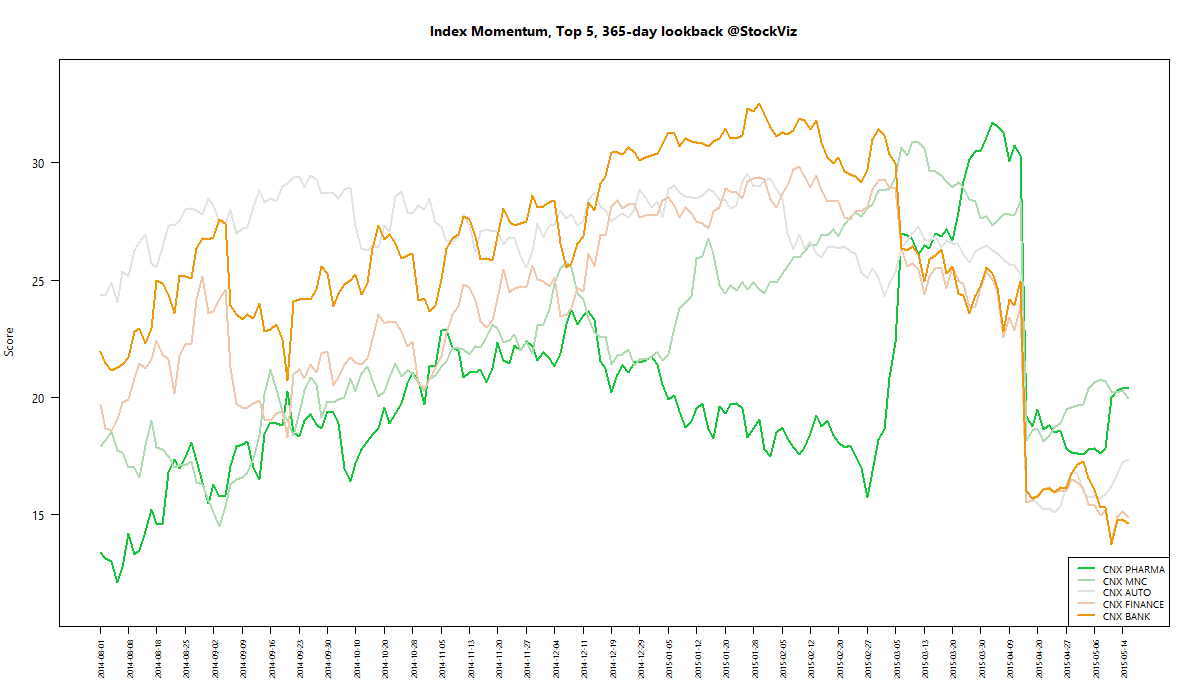
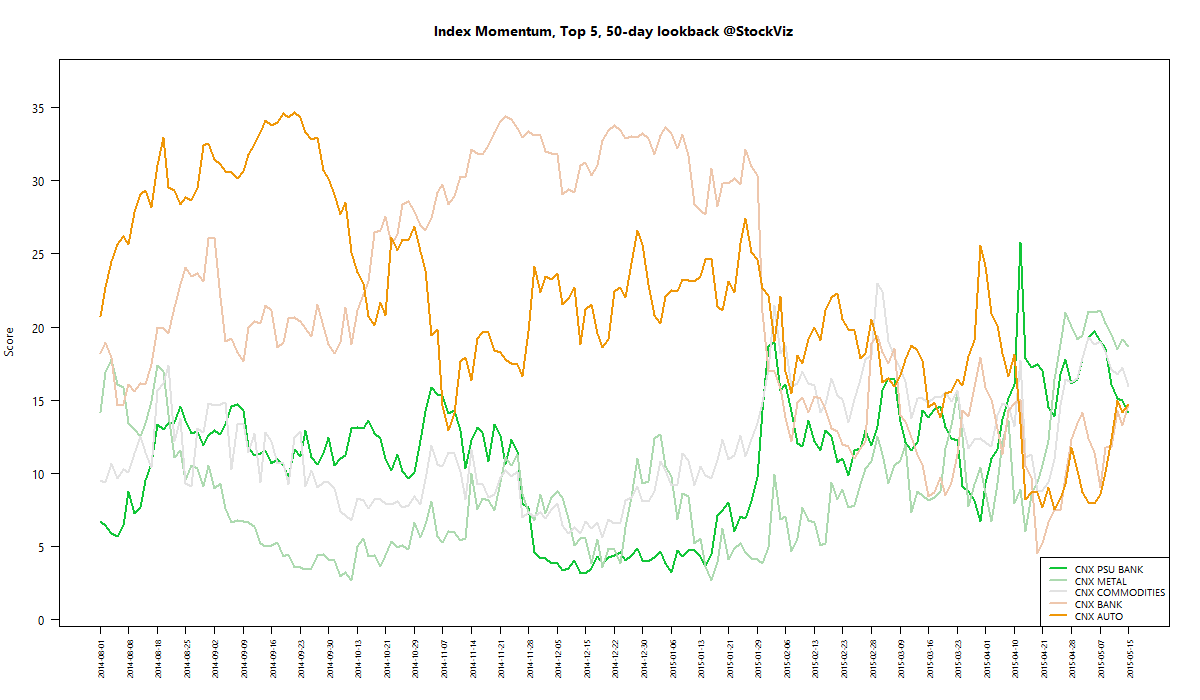
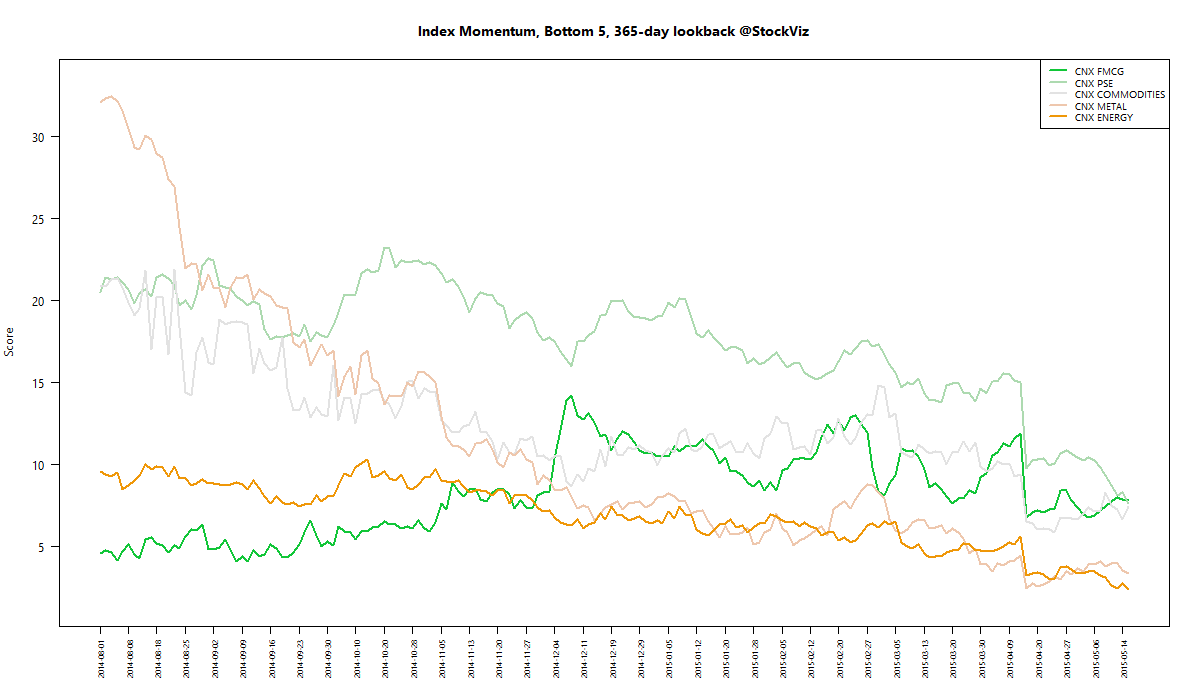
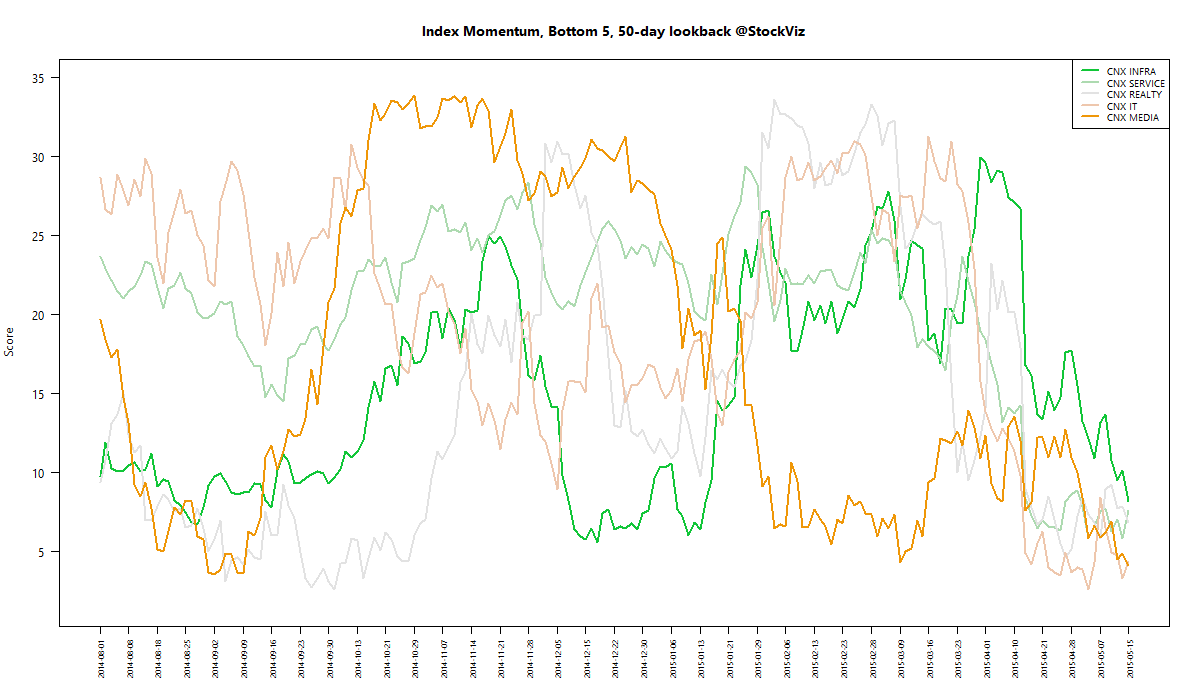
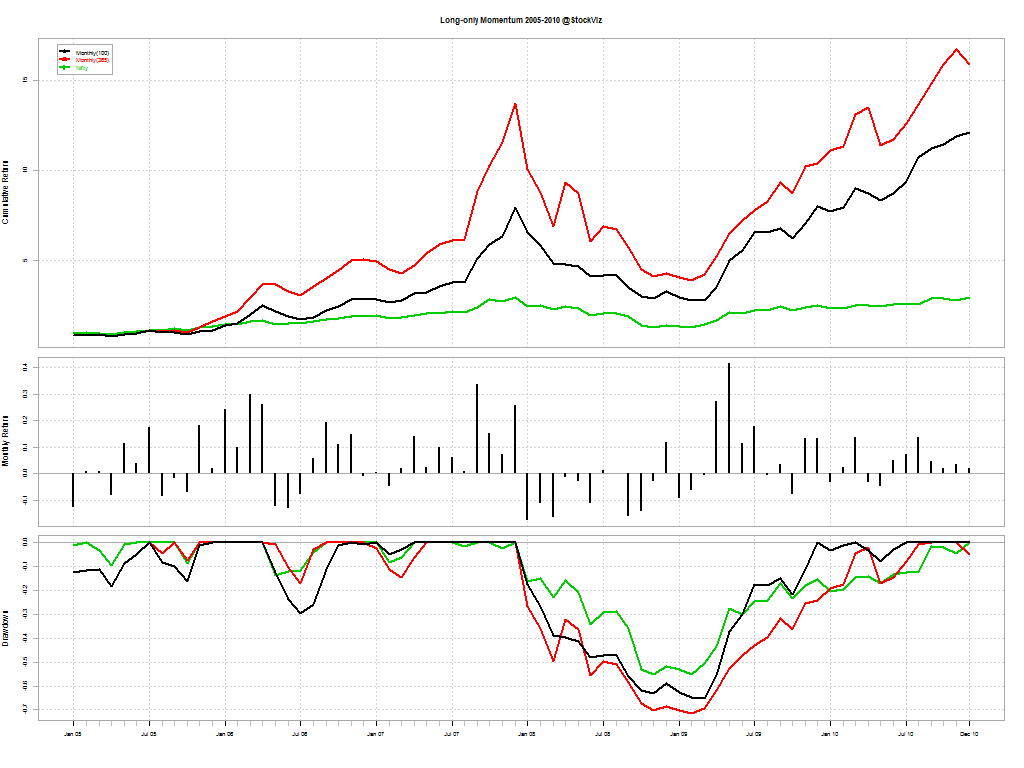
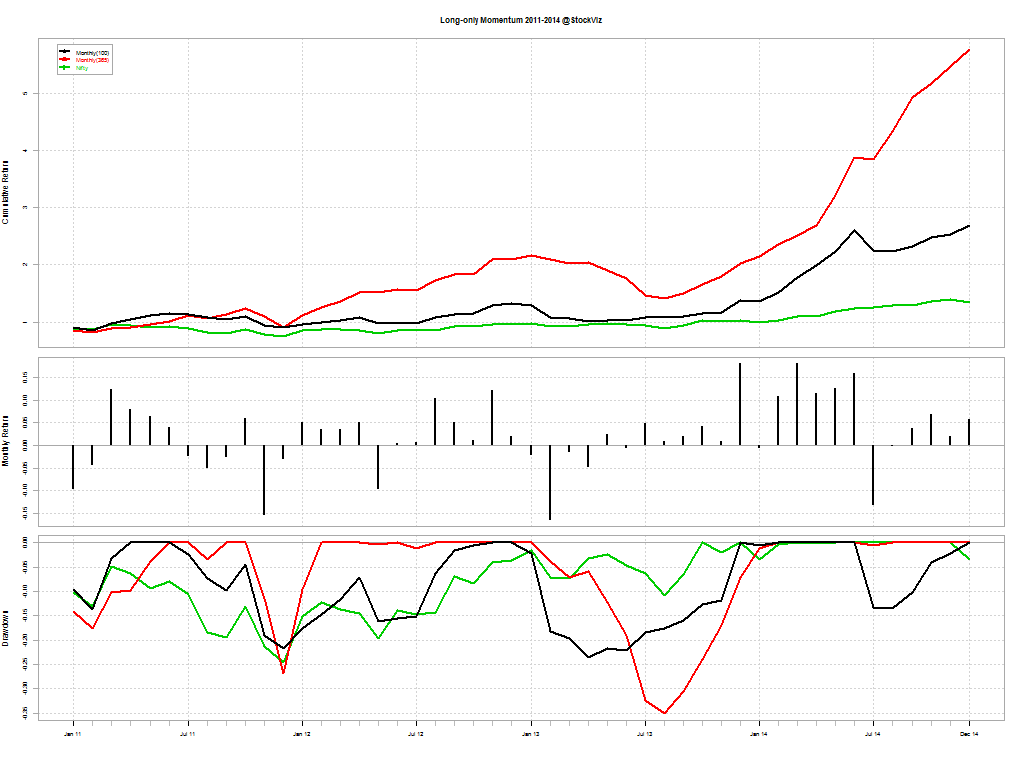
| Momentum | +3.73% |
| Quality to Price | +3.22% |
| CNX 100 Enterprise Yield | +2.94% |
| ADAG stocks | +2.82% |
| ASK Life | +2.73% |
| Textile, Metals, Chemicals, Paper and Energy Quality to Price | +2.63% |
| Low Volatility | +2.53% |
| PPFAS Long Term Value | +2.11% |
| The RBI Restricted List | +1.95% |
| High Beta | +1.84% |
| Balance Sheet Strength | +1.79% |
| Magic Formula | +1.39% |
| Auto and Consumer Goods Quality to Price | +0.69% |
| Tactical CNX 100 | +0.00% |
Investment strategies tracked the market into the green. But Nifty is still below 50-day SMA…
Equity Mutual Funds
Bond Mutual Funds
Thought for the weekend
Motivation, broadly speaking, operates on the erroneous assumption that a particular mental or emotional state is necessary to complete a task.
Discipline, by contrast, separates outwards functioning from moods and feelings and thereby ironically circumvents the problem by consistently improving them.
You don’t wait until you’re in olympic form to start training. You train to get into olympic form.