MOMENTUM
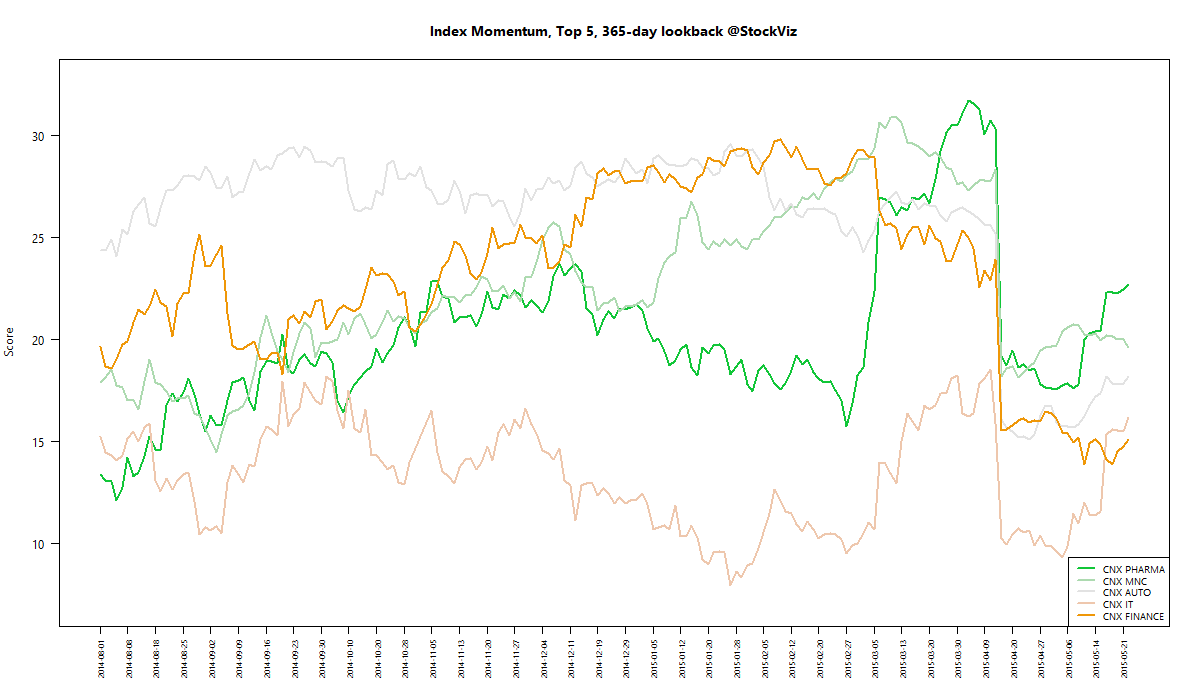
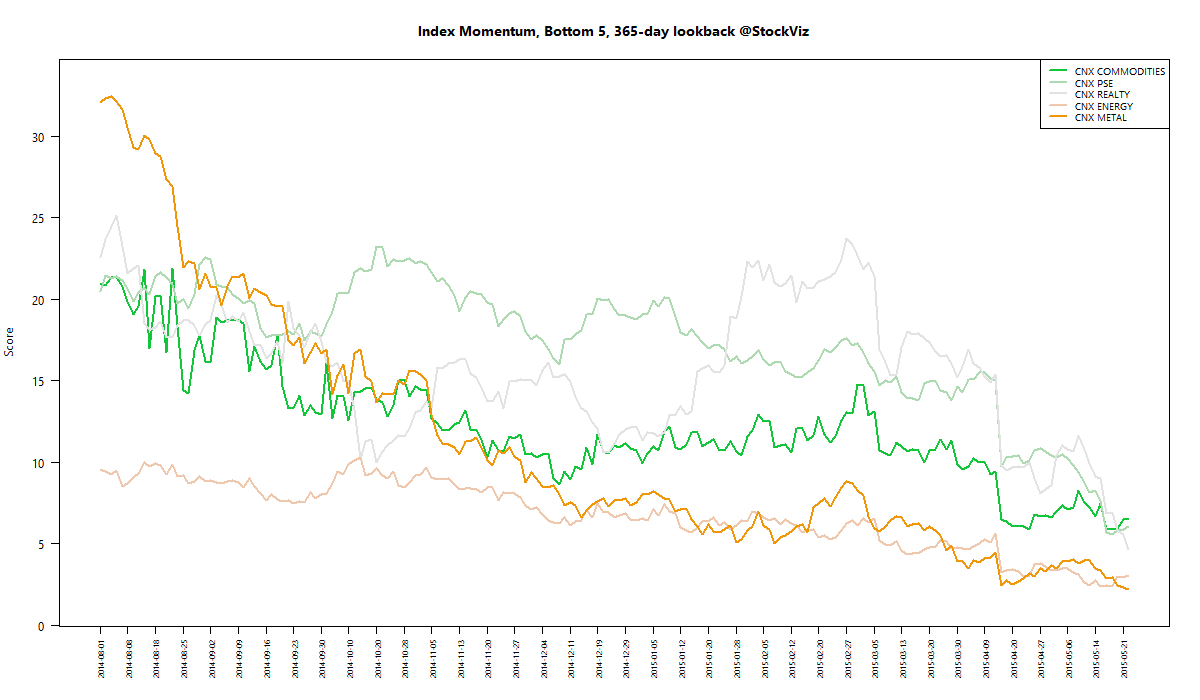
We run our proprietary momentum scoring algorithm on indices just like we do on stocks. You can use the momentum scores of sub-indices to get a sense for which sectors have the wind on their backs and those that are facing headwinds.
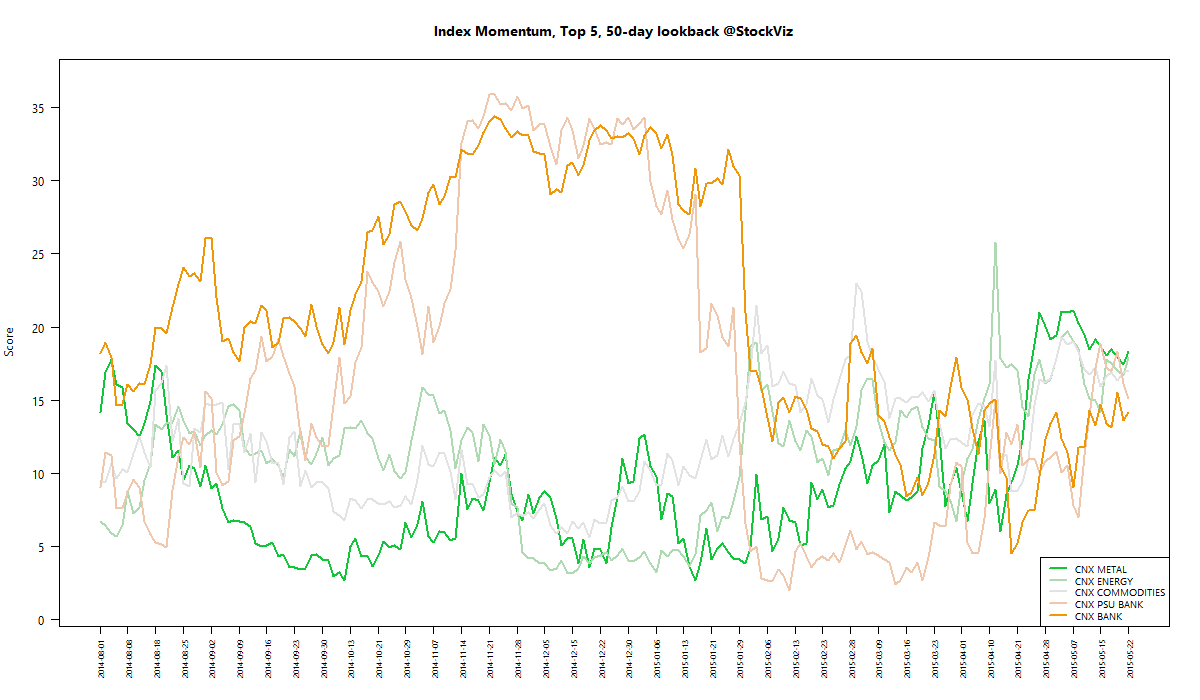
Traders can pick their longs in sectors with high short-term momentum and their shorts in sectors with low momentum. Investors can use the longer lookback scores to position themselves using our re-factored index Themes.
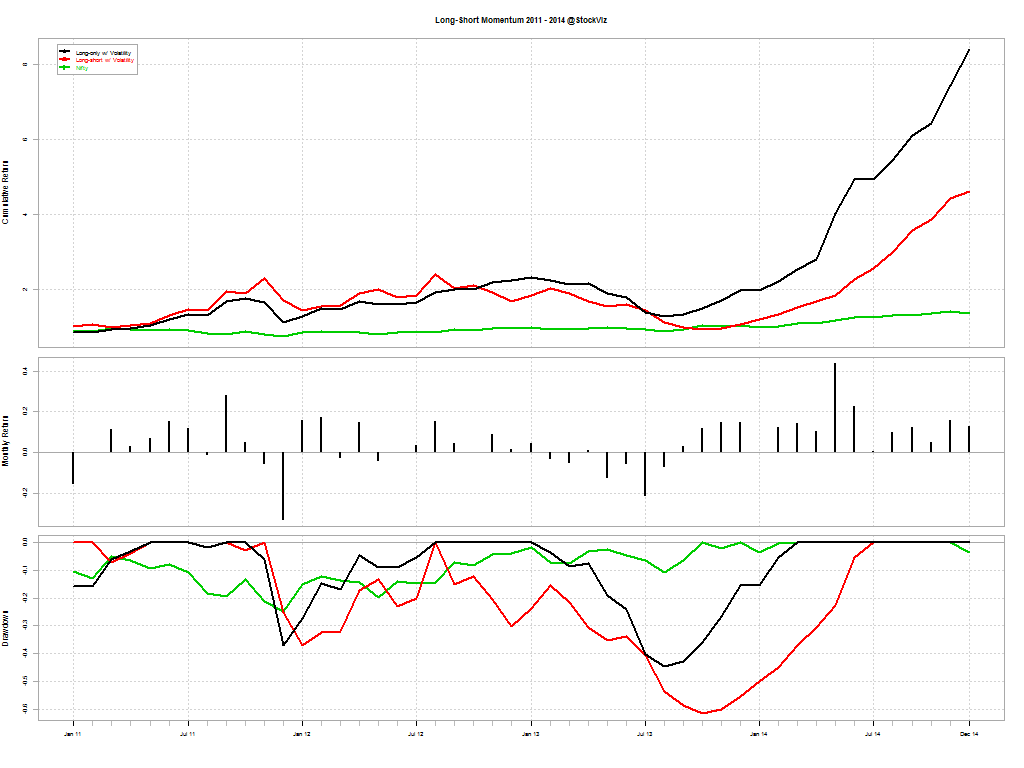
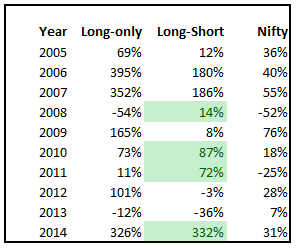
You can see how the momentum algorithm has performed on individual stocks here.
Here are the best and the worst sub-indices:

Refactored Index Performance
50-day performance, from March 10, 2015 through May 22, 2015:
Trend Model Summary
| Index | Signal | % From Peak | Day of Peak |
|---|---|---|---|
| CNX AUTO | SHORT |
5.69
|
2015-Jan-27
|
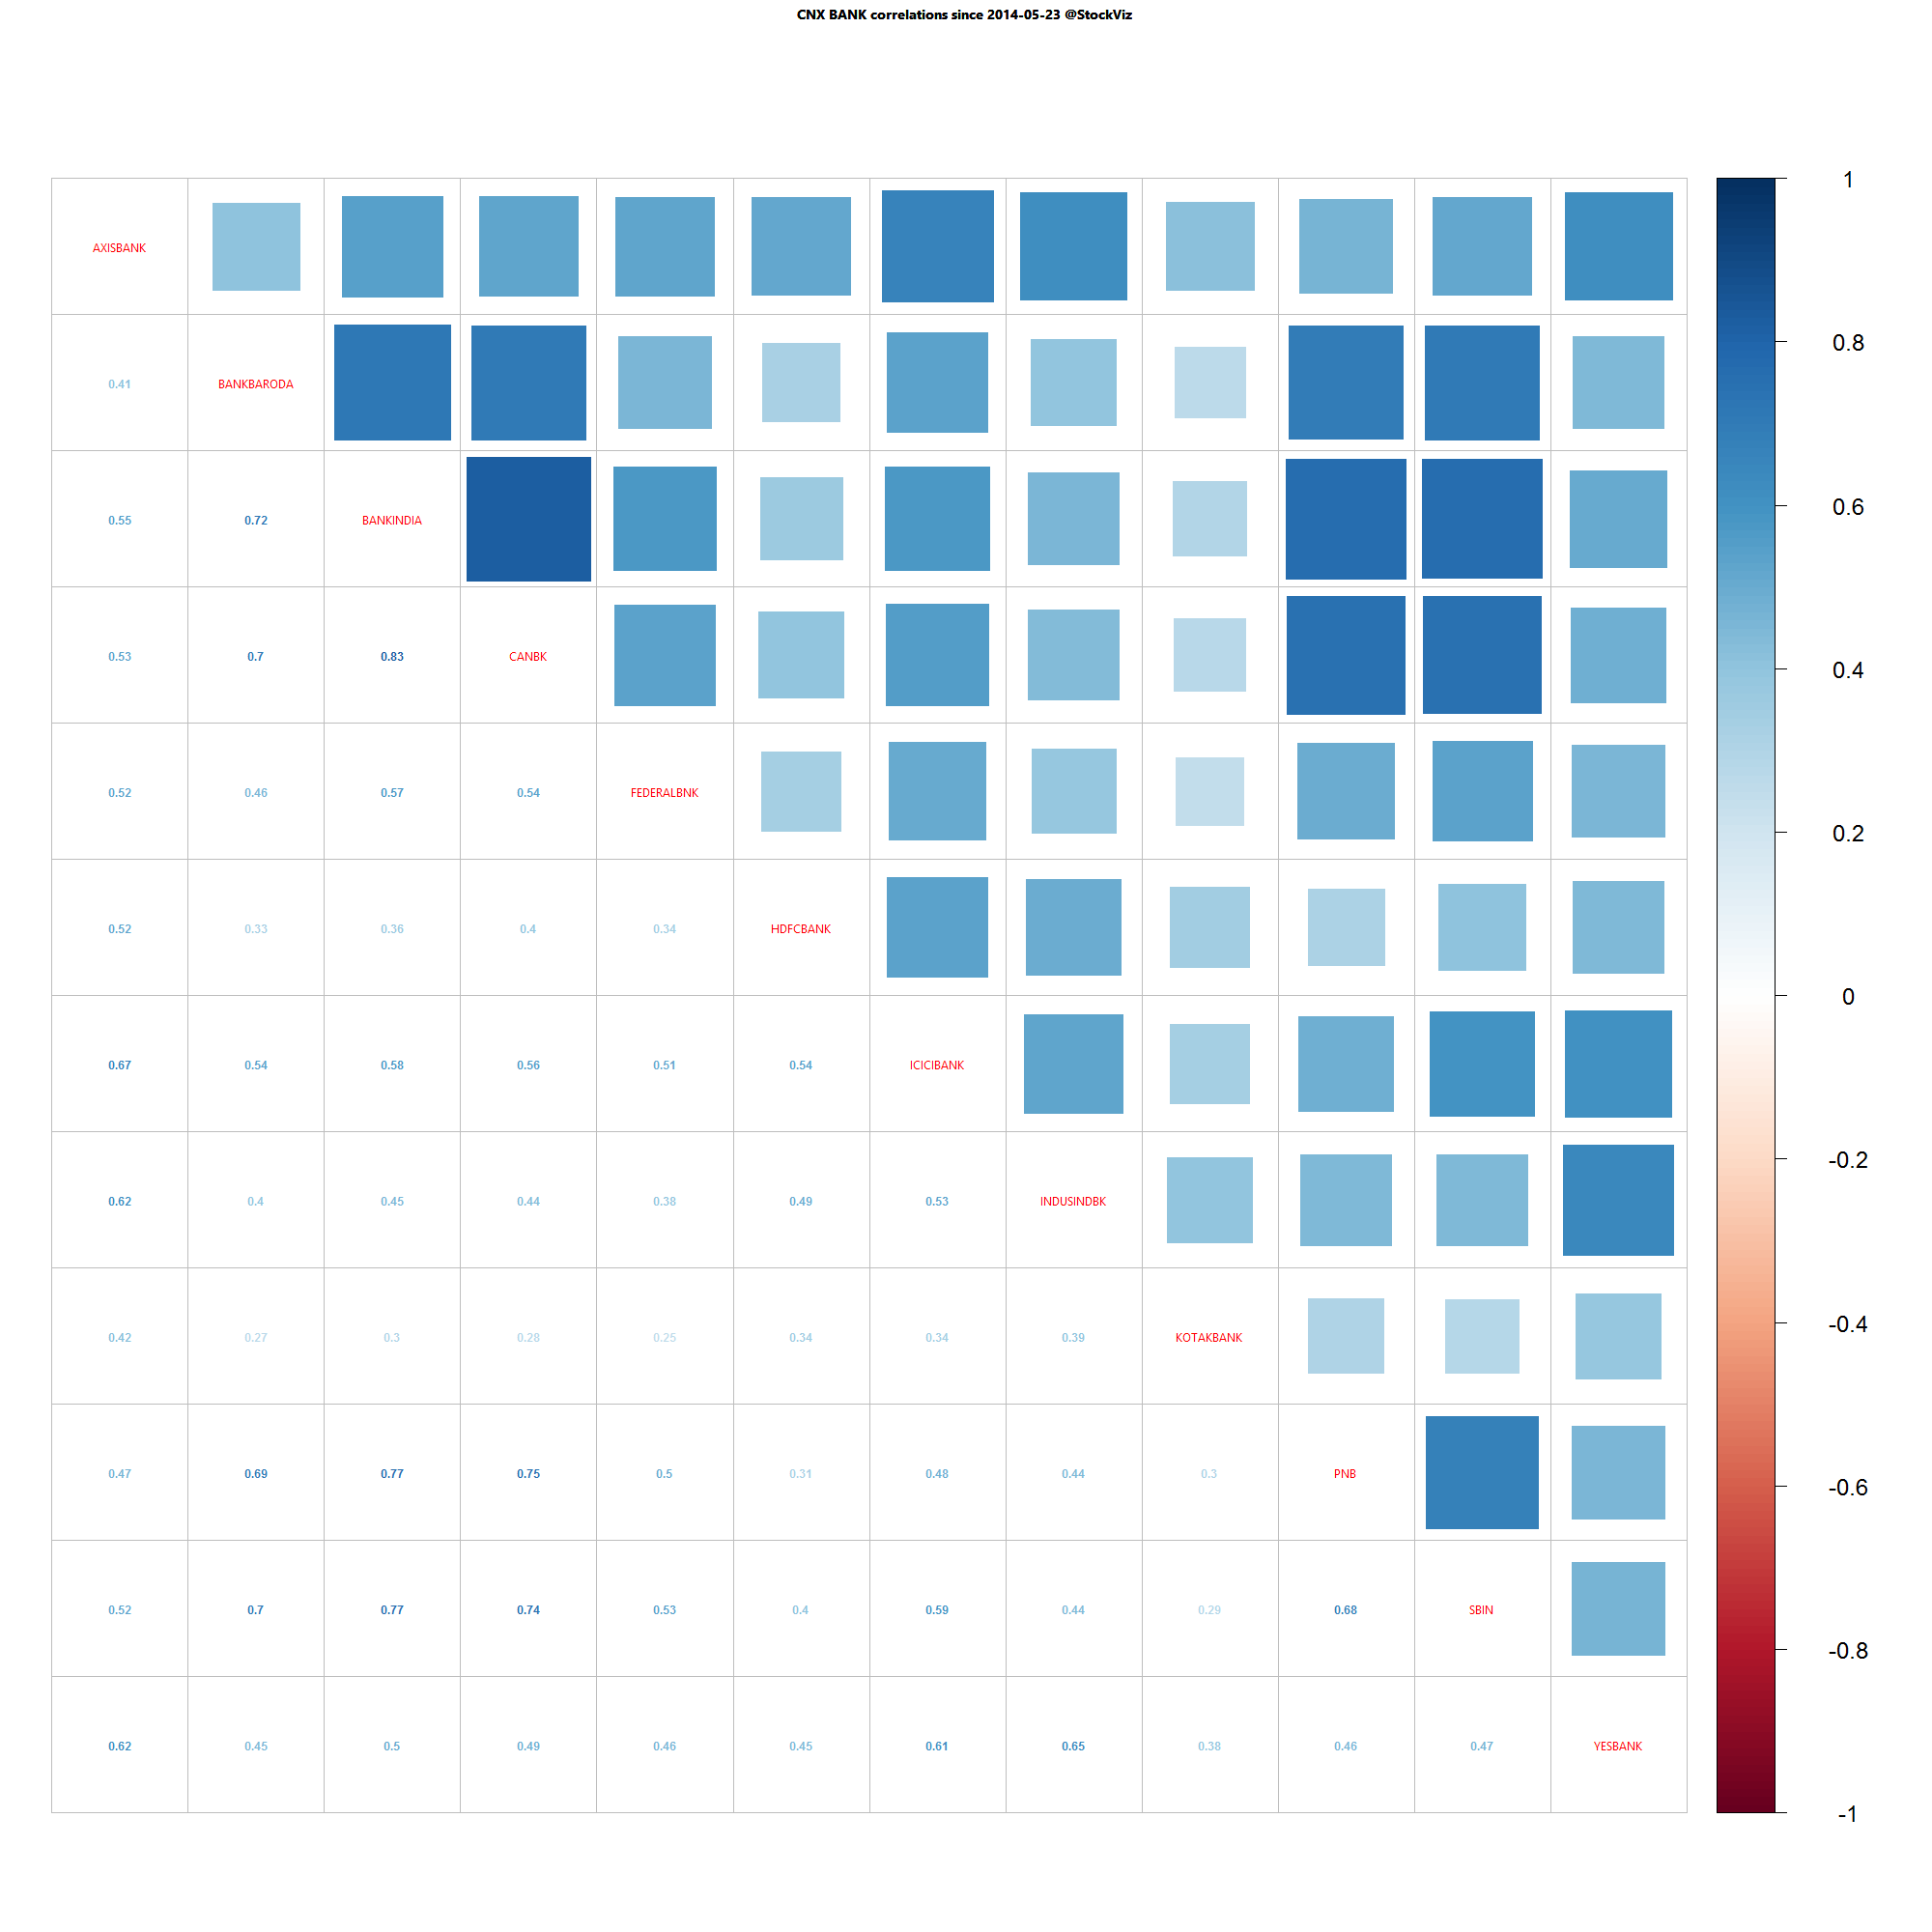
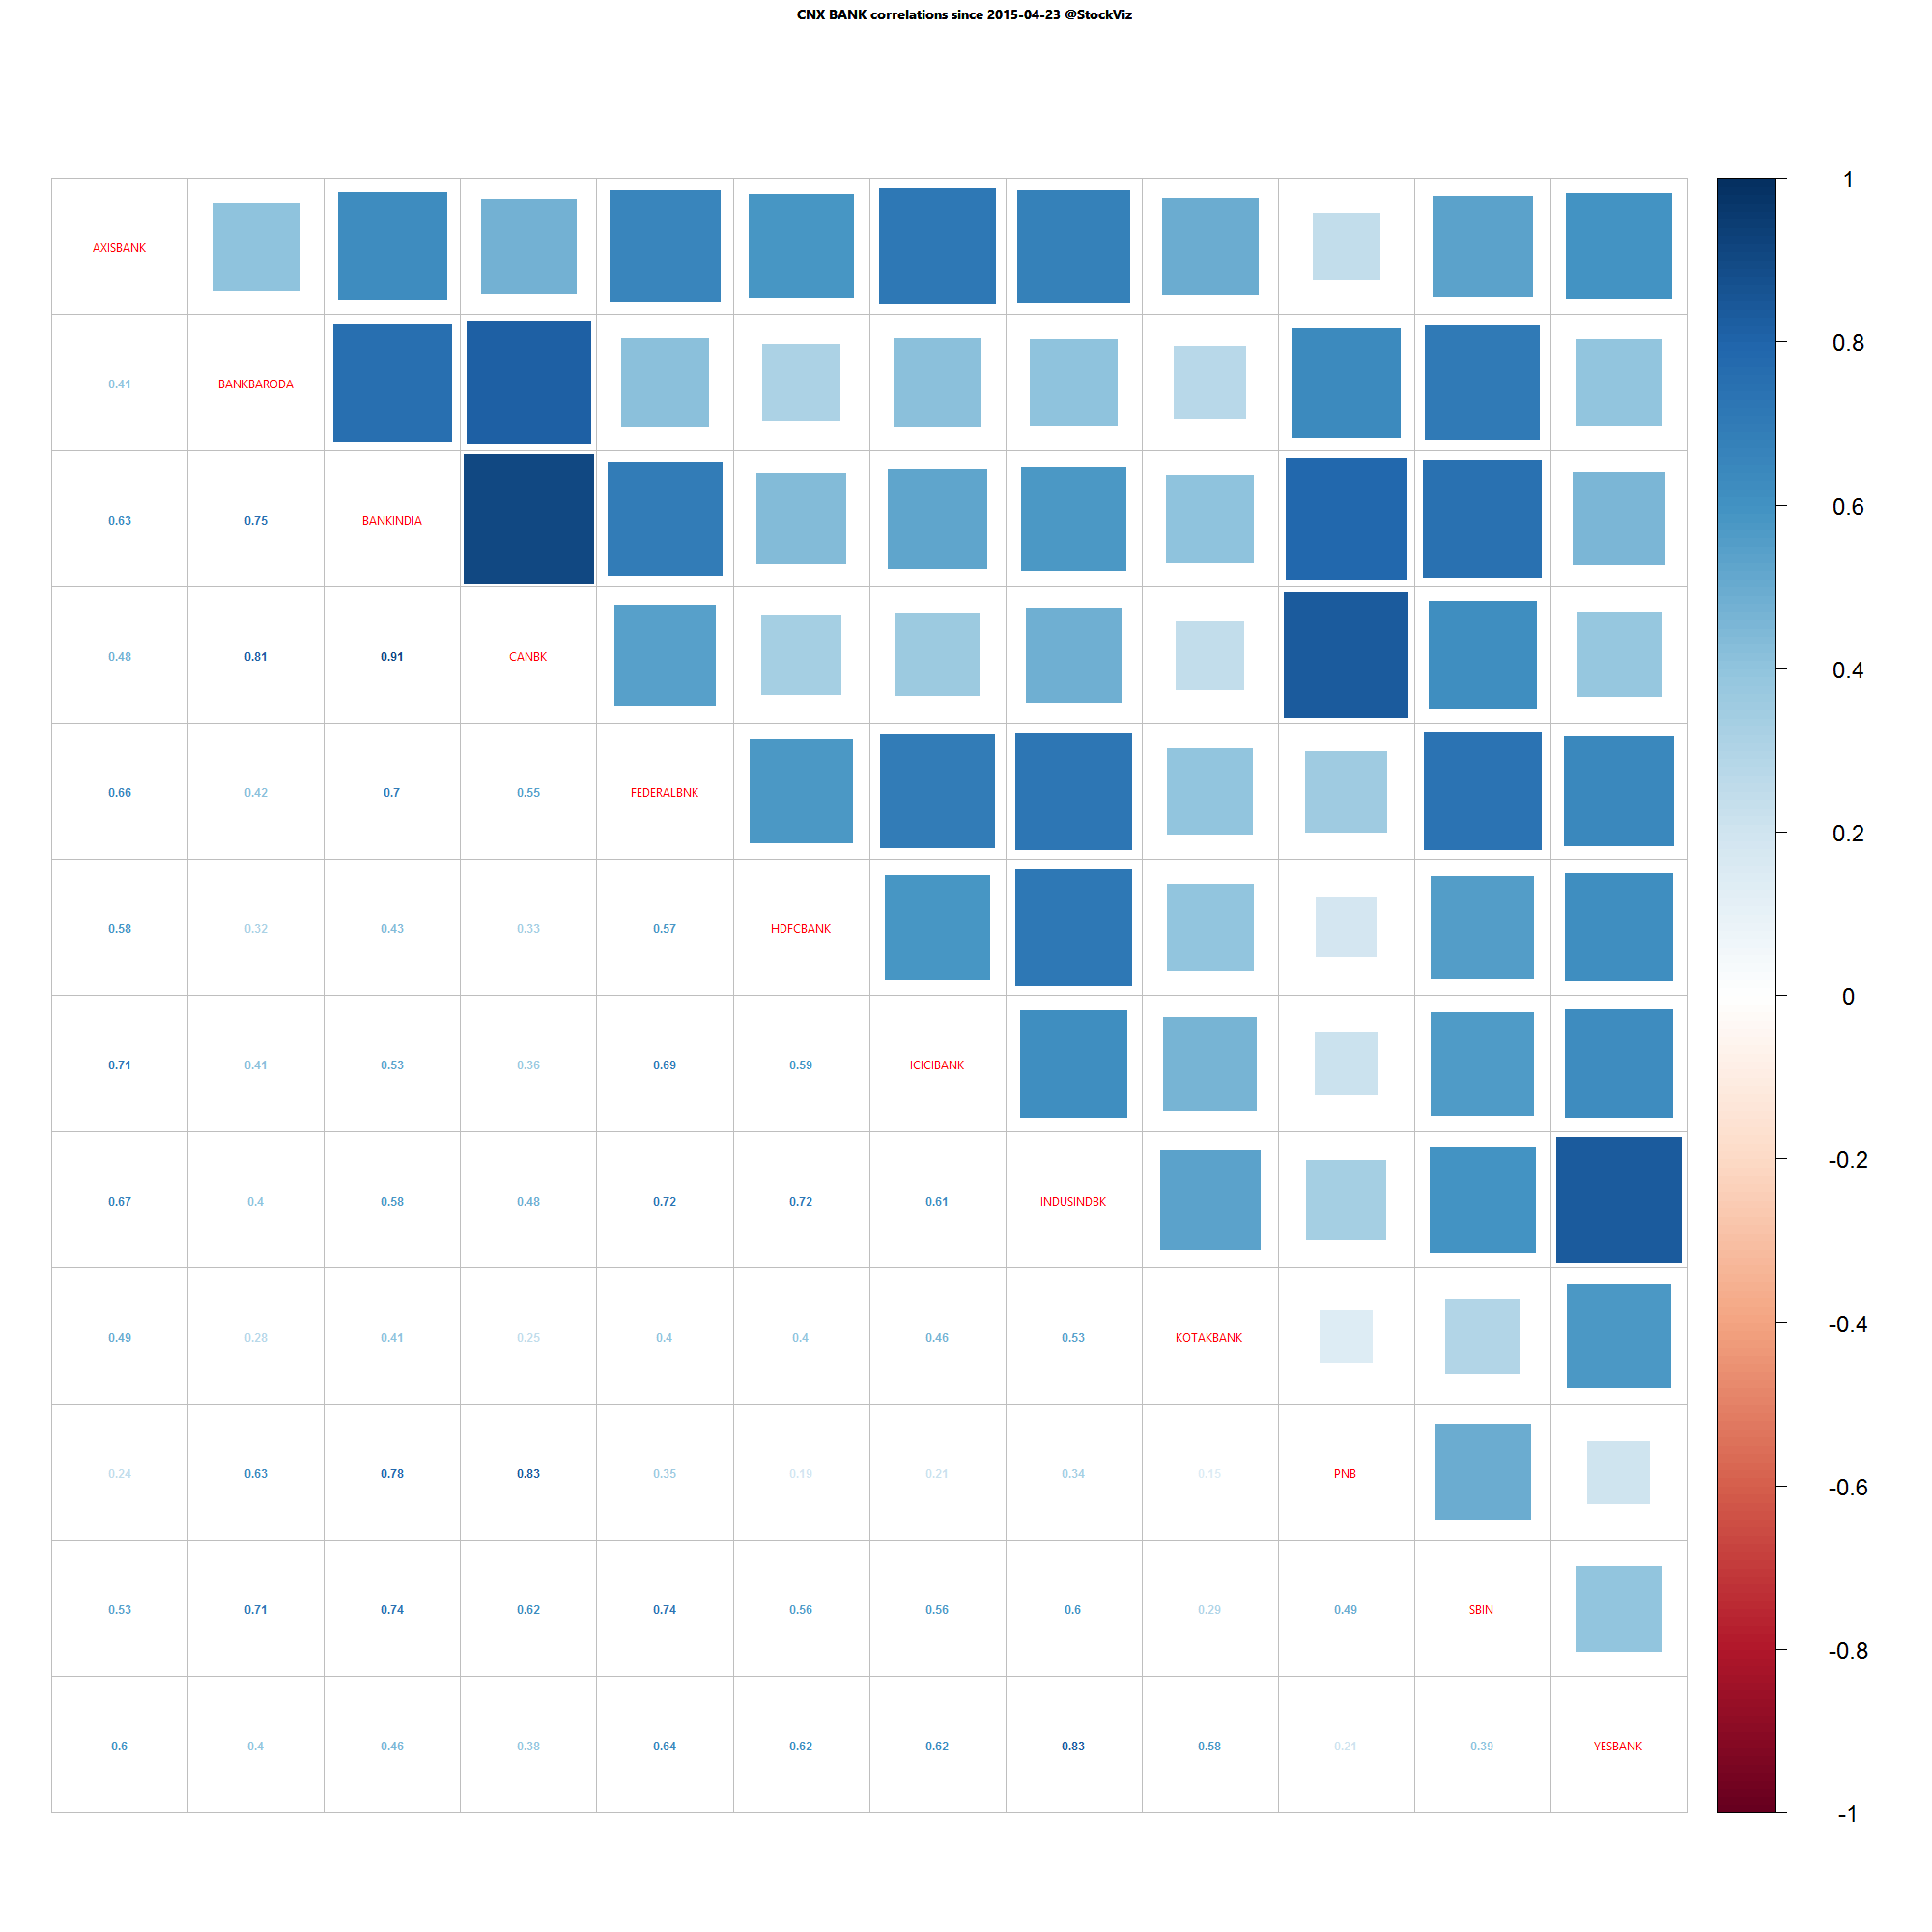
| CNX BANK | SHORT |
10.32
|
2015-Jan-27
|
| CNX ENERGY | SHORT |
29.07
|
2008-Jan-14
|
| CNX FMCG | SHORT |
9.54
|
2015-Feb-25
|
| CNX INFRA | SHORT |
49.37
|
2008-Jan-09
|
| CNX IT | SHORT |
87.72
|
2000-Feb-21
|
| CNX MEDIA | SHORT |
29.01
|
2008-Jan-04
|
| CNX METAL | SHORT |
56.14
|
2008-Jan-04
|
| CNX MNC | SHORT |
3.97
|
2015-Mar-12
|
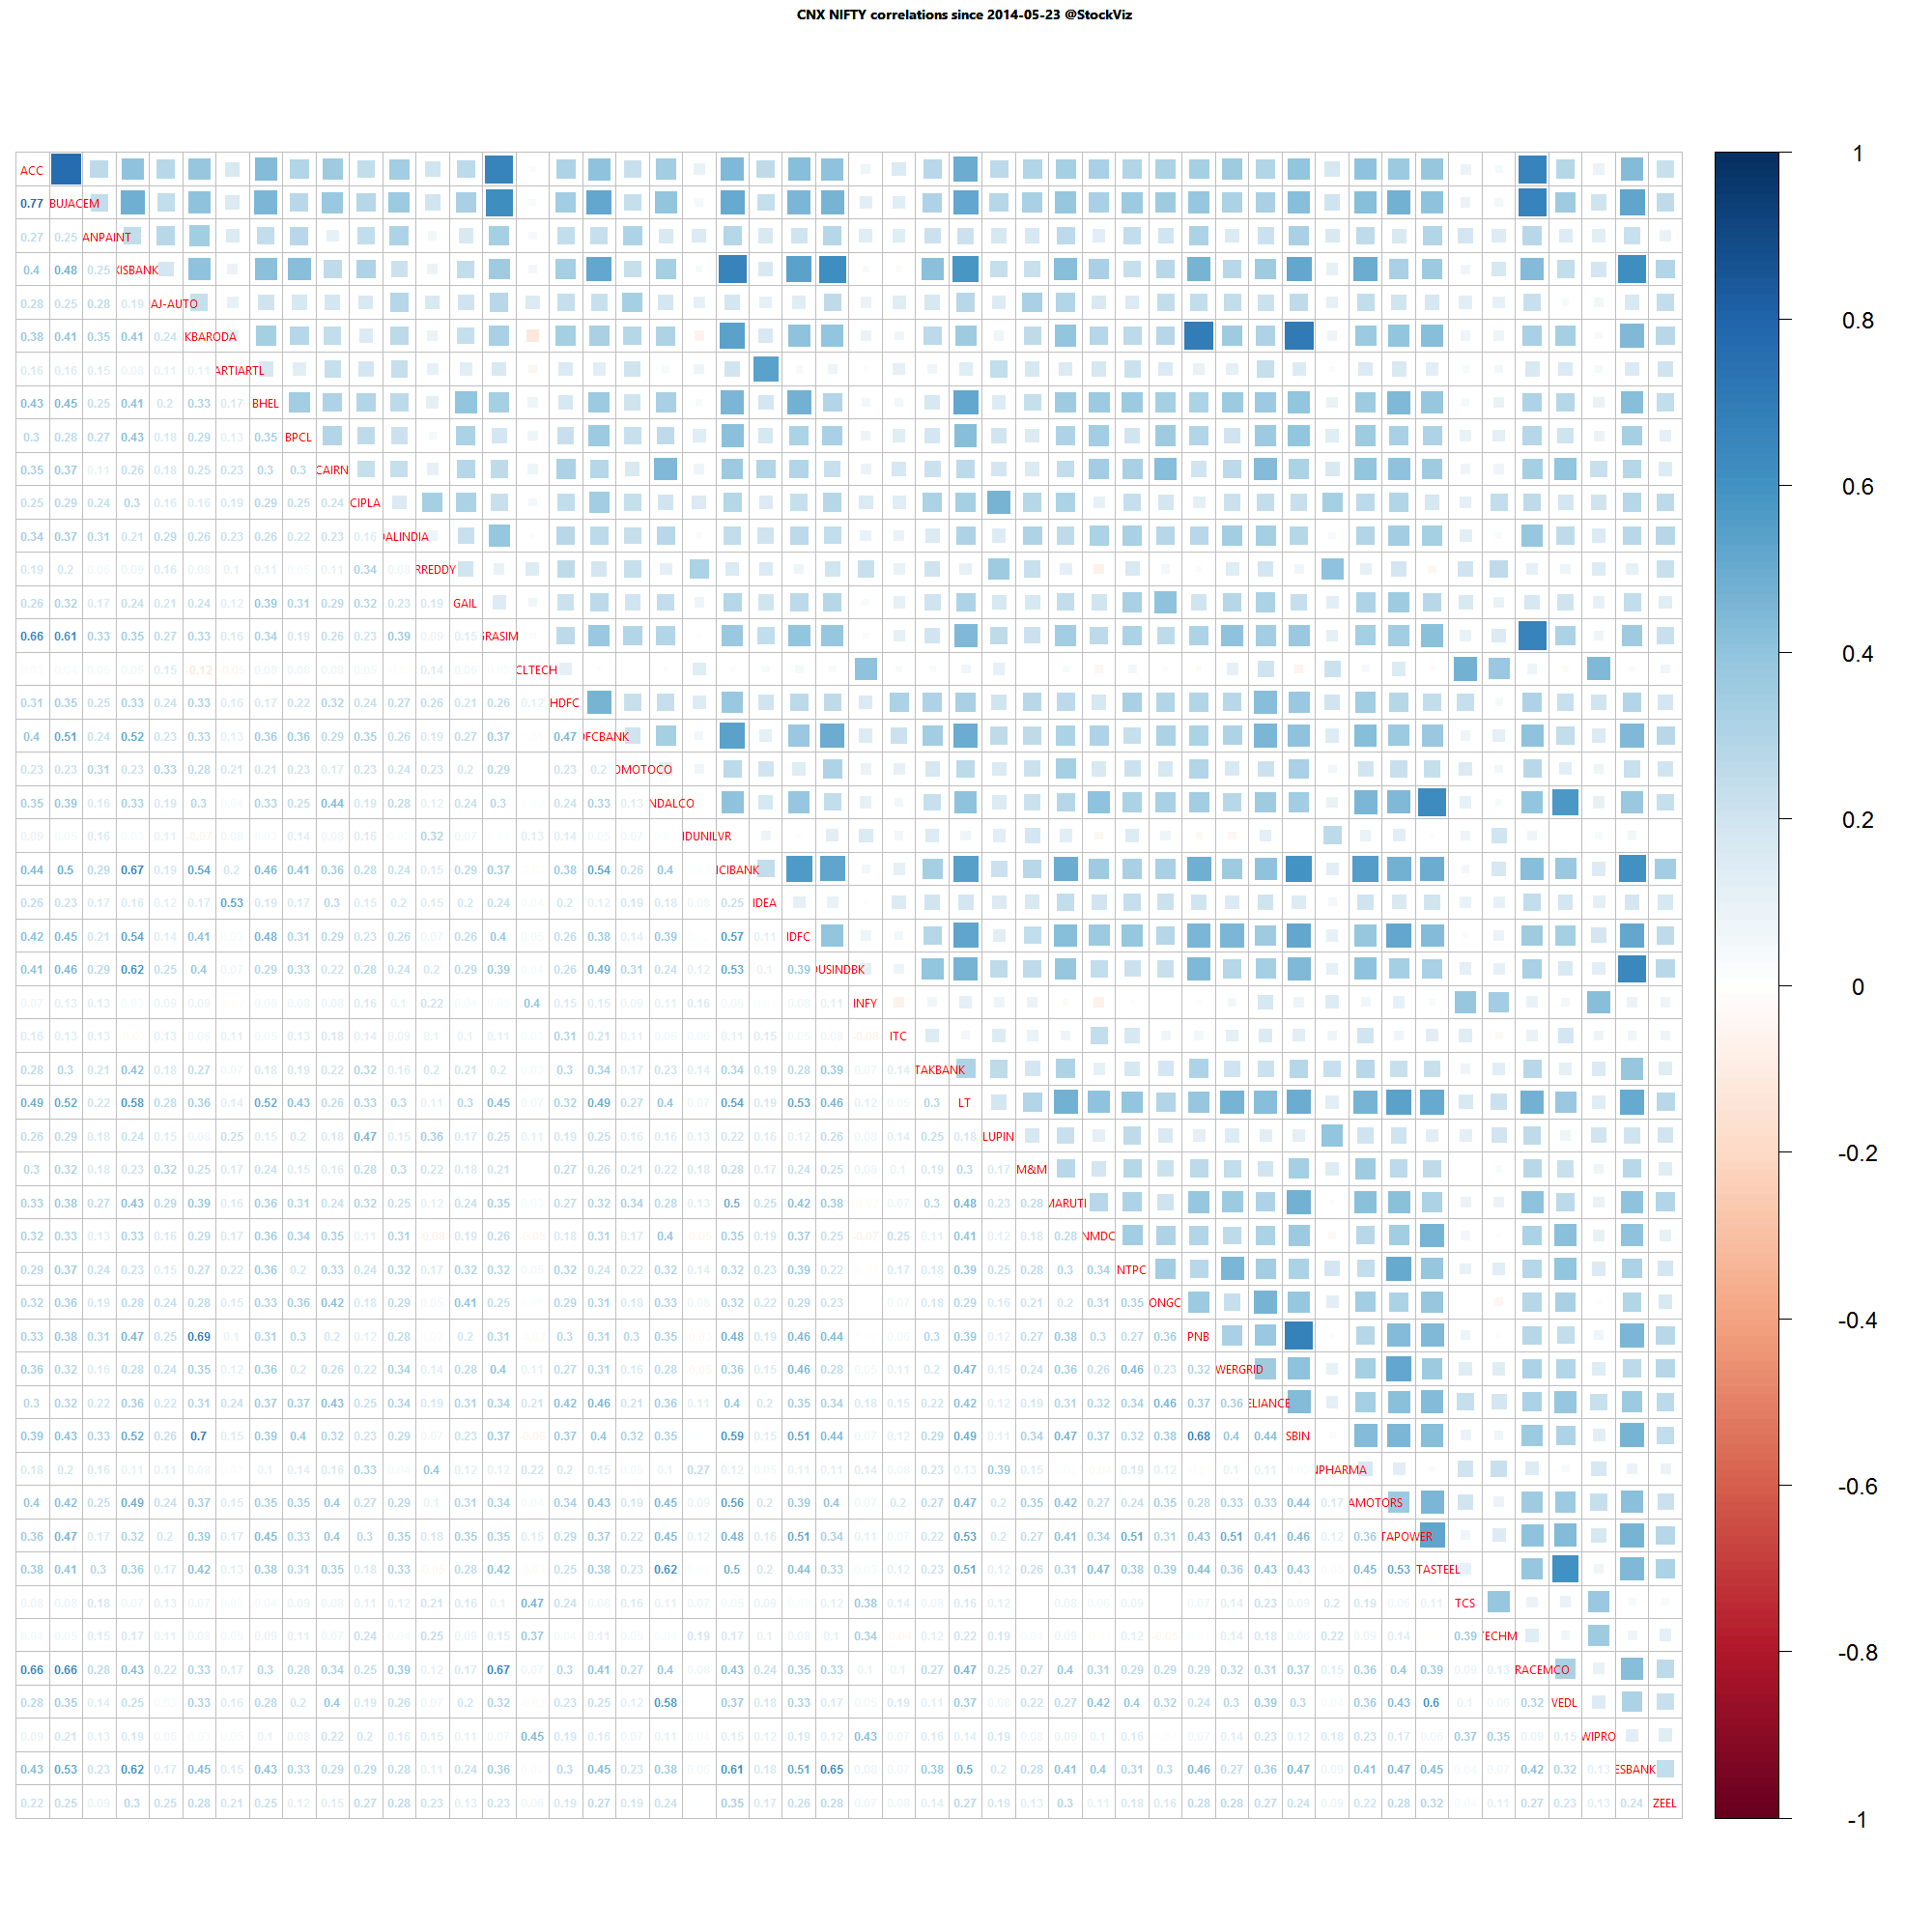
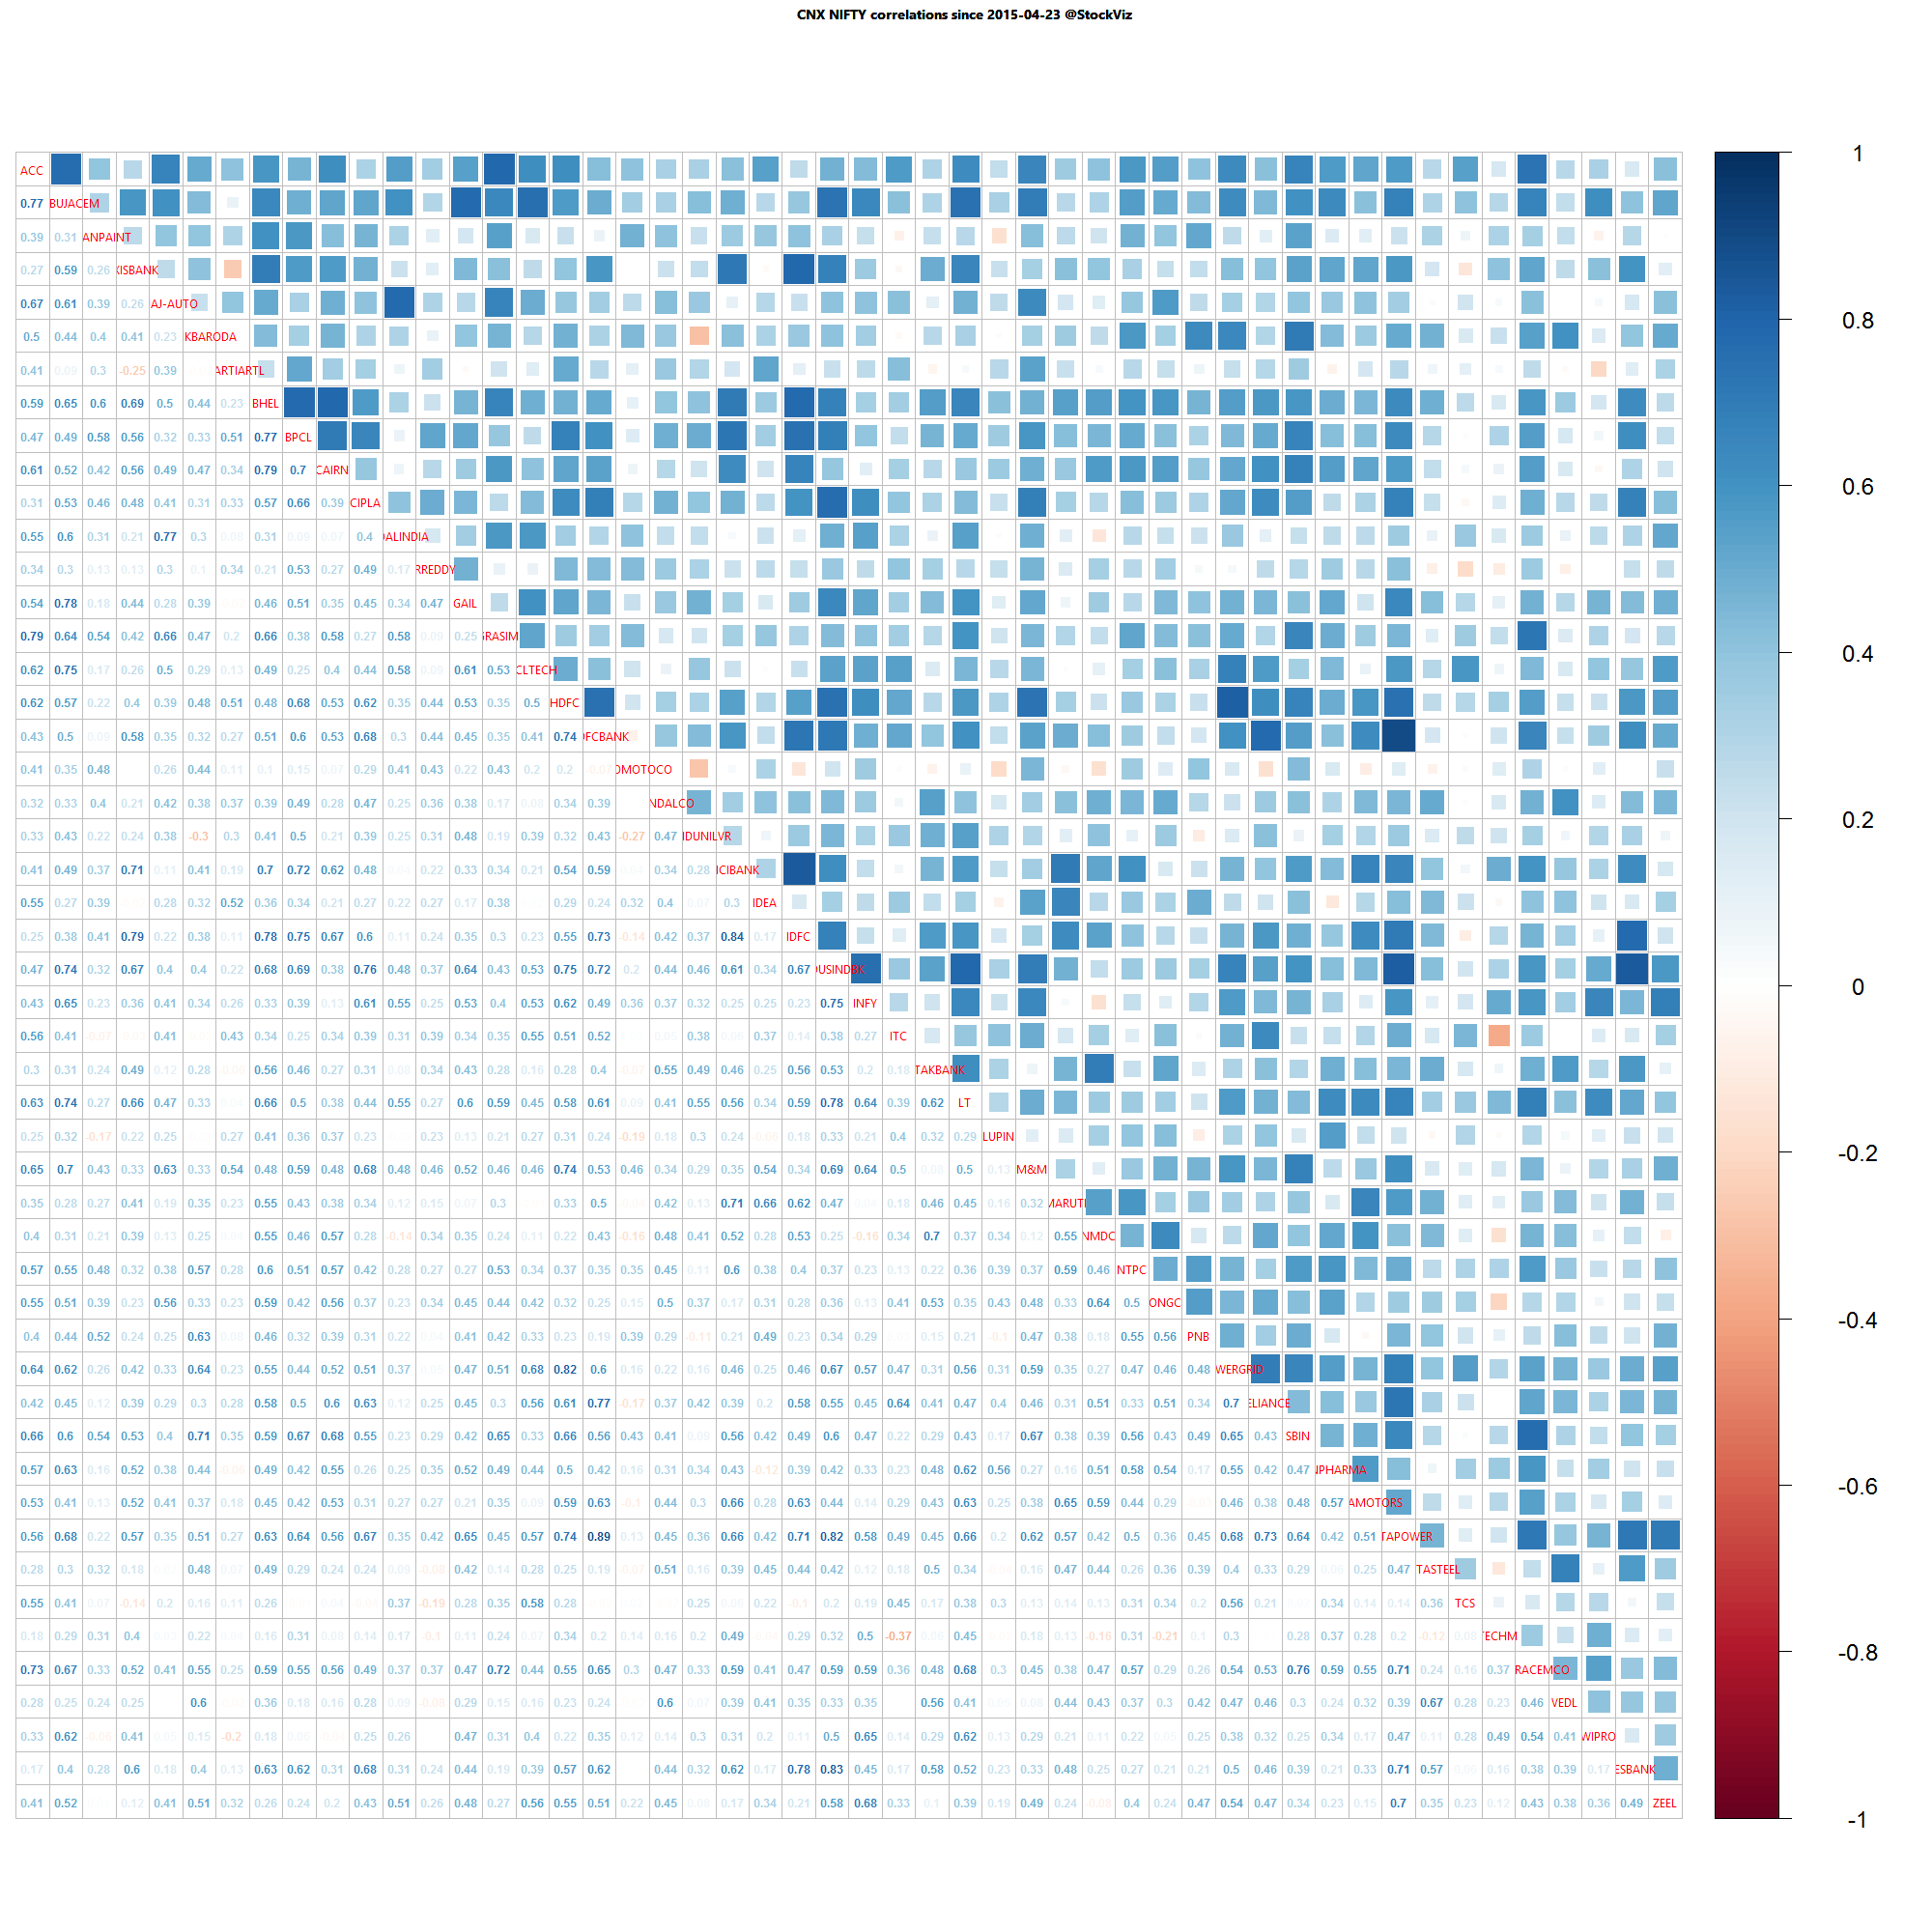
| CNX NIFTY | SHORT |
5.97
|
2015-Mar-03
|
| CNX PHARMA | SHORT |
8.25
|
2015-Apr-08
|
| CNX PSE | SHORT |
26.16
|
2008-Jan-04
|
| CNX REALTY | SHORT |
89.23
|
2008-Jan-14
|
Pharma and banks seem to be perking up.
And boy-oh-boy! MNCs have more or less covered their draw-down.
And boy-oh-boy! MNCs have more or less covered their draw-down.