Category: Your Money

Monthly Recap: Diwali

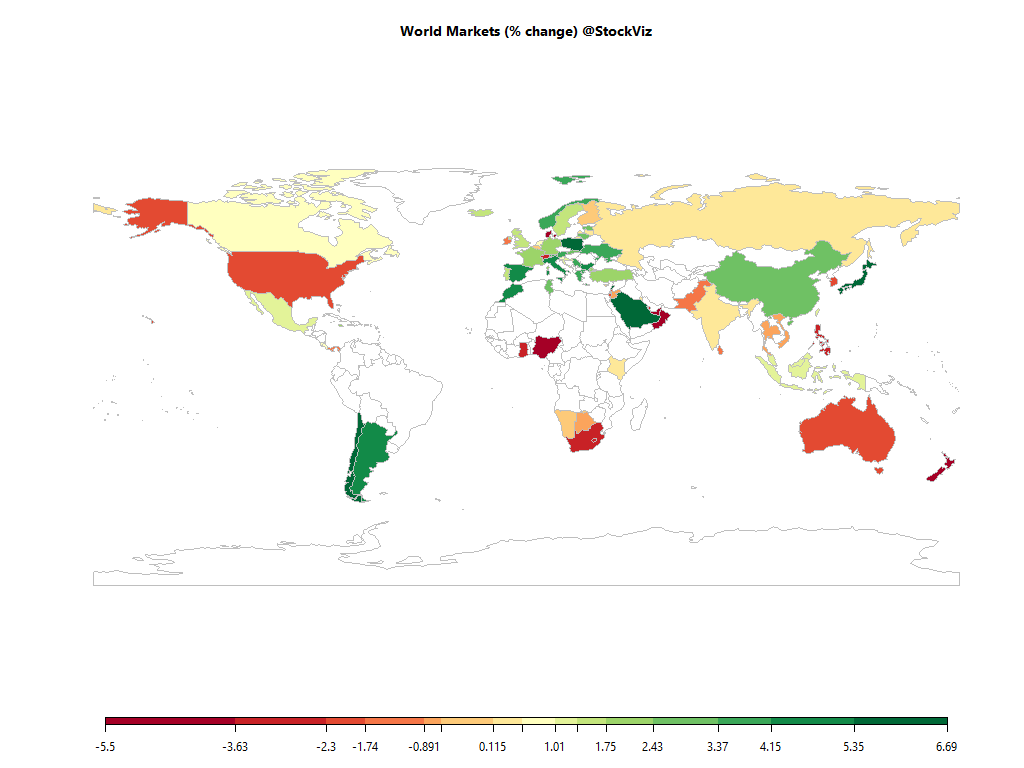
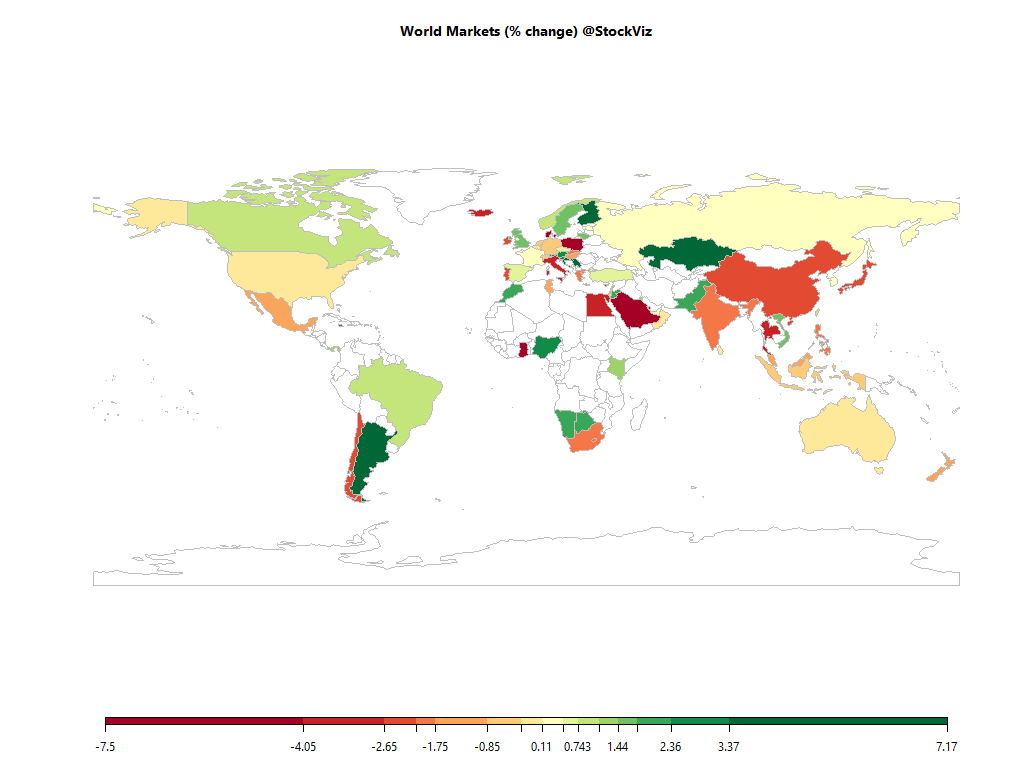
world-2016-09-30-2016-10-28

Equities

Major
DAX(DEU) +1.76%
CAC(FRA) +2.26%
UKX(GBR) +1.40%
NKY(JPN) +5.73%
SPX(USA) -2.09%
MINTs
JCI(IDN) +1.03%
INMEX(MEX) +1.03%
NGSEINDX(NGA) -3.67%
XU030(TUR) +2.20%
BRICS
IBOV(BRA) +9.43%
SHCOMP(CHN) +2.84%
NIFTY(IND) +0.17%
INDEXCF(RUS) +0.19%
TOP40(ZAF) -2.46%

Commodities

Energy
Brent Crude Oil +0.77%
RBOB Gasoline -1.77%
Heating Oil +0.86%
Natural Gas +7.60%
WTI Crude Oil +0.50%
Ethanol +6.33%
Metals
Gold 100oz -2.92%
Silver 5000oz -7.29%
Copper -0.90%
Palladium -14.45%
Platinum -5.33%

Currencies

USDEUR:+2.39% USDJPY:+3.35%

MINTs
USDIDR(IDN) +0.02%
USDMXN(MEX) -2.12%
USDNGN(NGA) +0.56%
USDTRY(TUR) +3.62%
BRICS
USDBRL(BRA) -1.42%
USDCNY(CHN) +1.47%
USDINR(IND) +0.25%
USDRUB(RUS) +0.40%
USDZAR(ZAF) +0.30%
Agricultural
Coffee (Robusta) +9.13%
Orange Juice +5.51%
Soybean Meal +6.18%
Sugar #11 -1.77%
White Sugar -0.91%
Cattle +5.36%
Cocoa +2.47%
Coffee (Arabica) +9.39%
Soybeans +5.22%
Wheat +2.18%
Corn +5.13%
Cotton +4.12%
Feeder Cattle -1.18%
Lean Hogs -5.13%
Lumber -10.87%

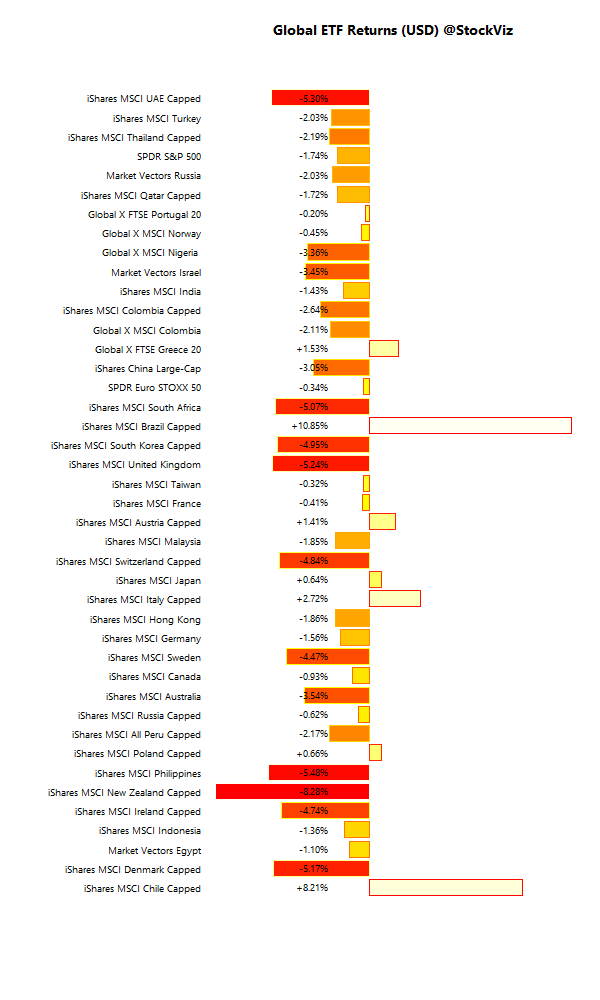
International ETFs (USD)

global-etf-performance-2016-09-30-2016-10-28

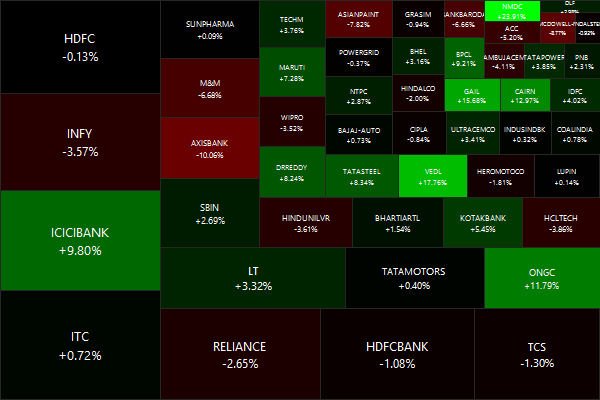
Nifty Heatmap

nifty-50-2016-09-30-2016-10-28

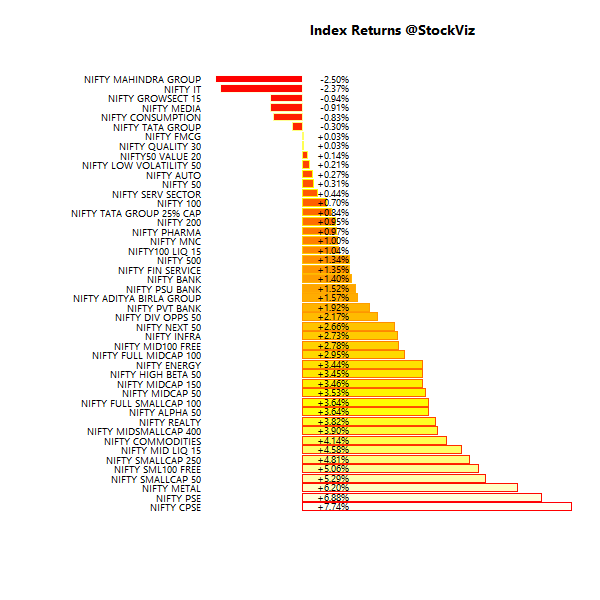
Index Returns

index-performance-2016-09-30-2016-10-28
More: Sector Dashboard

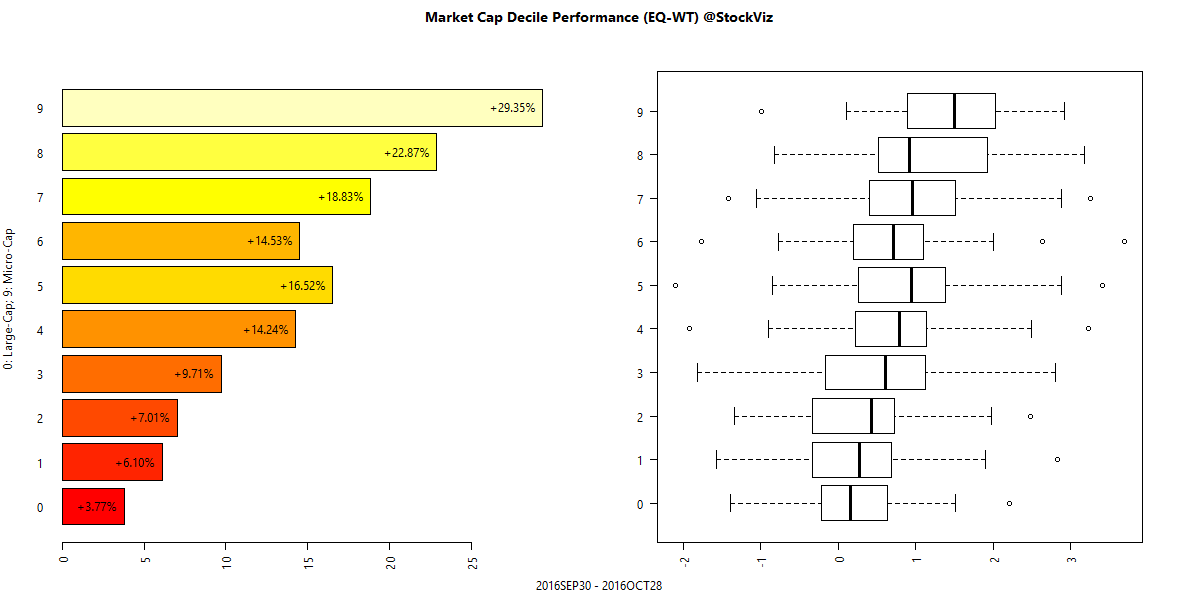
Market Cap Decile Performance

deciles-perf-2016-10-28
More: Equal-Weight Deciles, Cap-Weight Deciles

ETF Performance

CPSEETF +7.79%
JUNIORBEES +3.40%
INFRABEES +2.70%
BANKBEES +0.81%
PSUBNKBEES +0.72%
NIFTYBEES +0.37%
Hope springs eternal for CPSEs?

Yield Curve

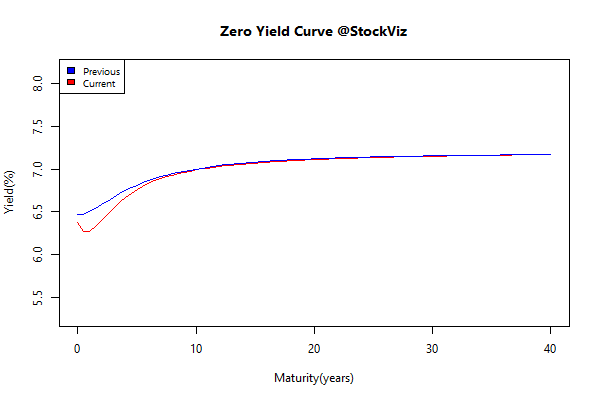
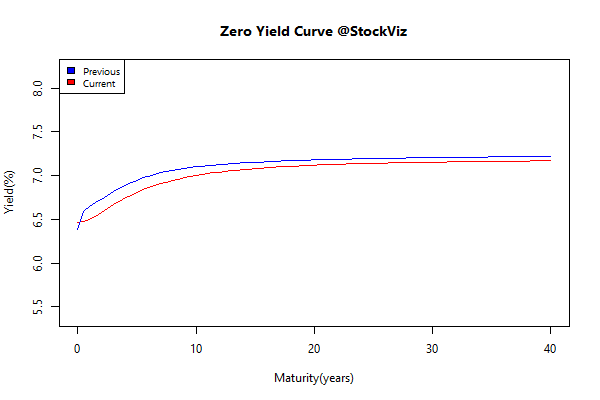
yieldcurve-2016-09-30-2016-10-28

Bond Indices

Sub Index Change in YTM Total Return(%)
0 5 -0.14 +0.91%
5 10 -0.06 +0.79%
10 15 -0.00 +0.57%
15 20 +0.01 +0.46%
20 30 +0.02 +0.38%
The short-end of the curve outperformed the long-end. Did dynamic bond funds catch the drift?

Investment Theme Performance

Equity Mutual Funds

Bond Mutual Funds

Institutional flows

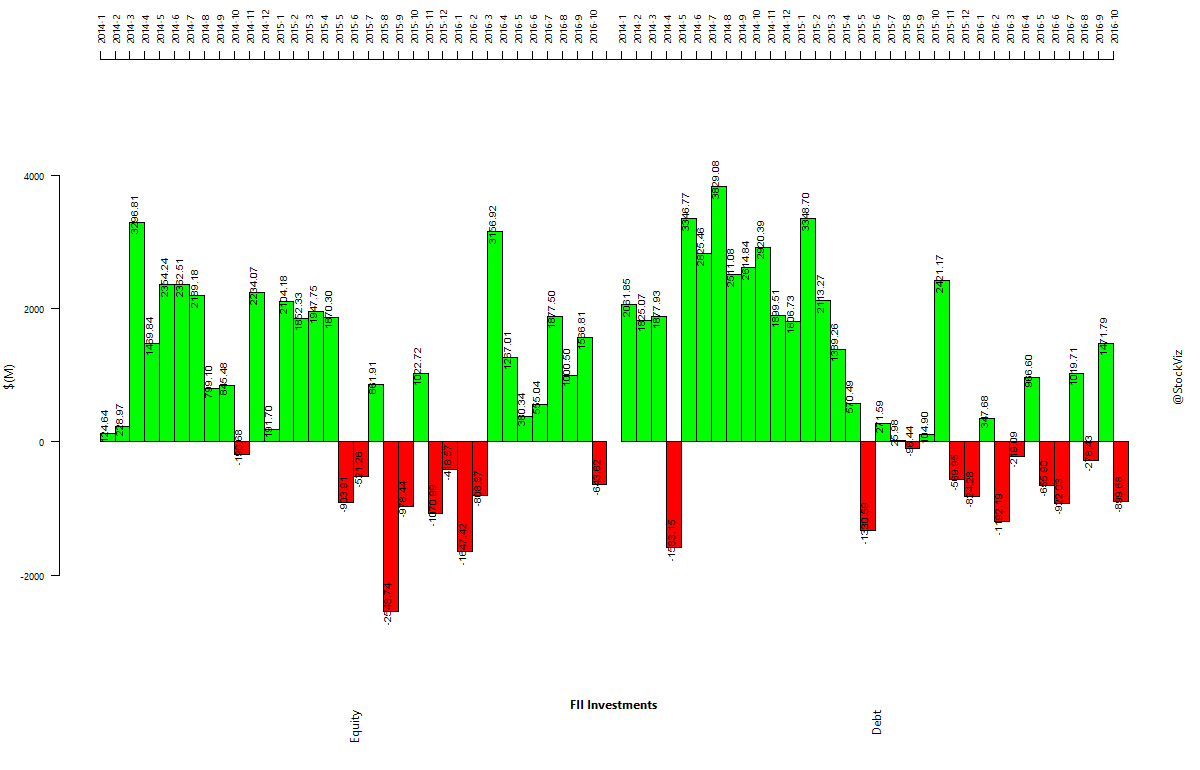
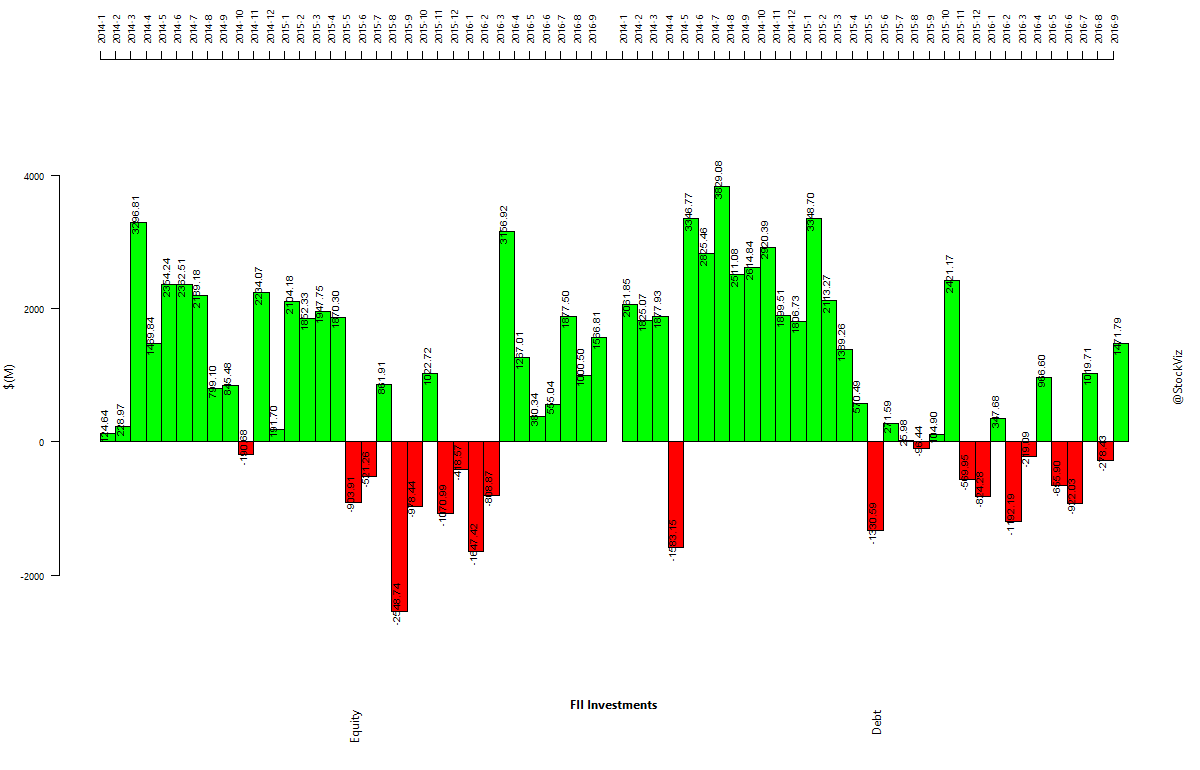
fii-investments-2014-01-01-2016-10-31

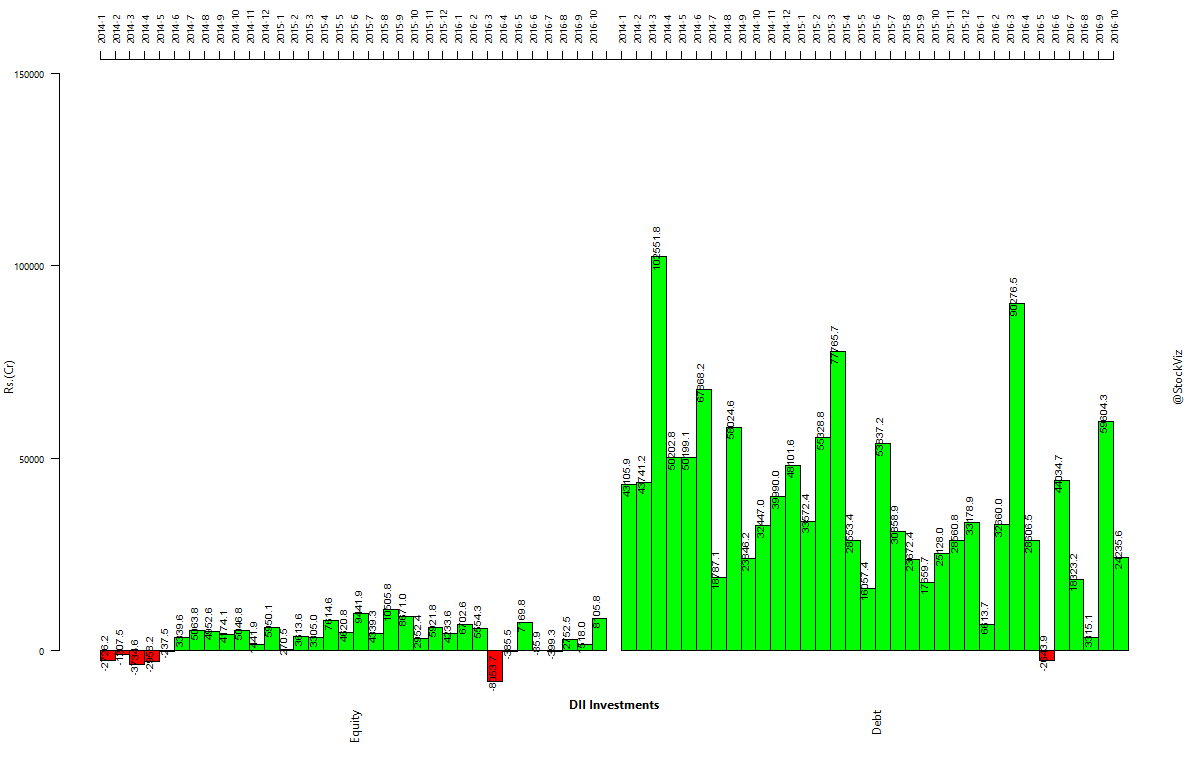
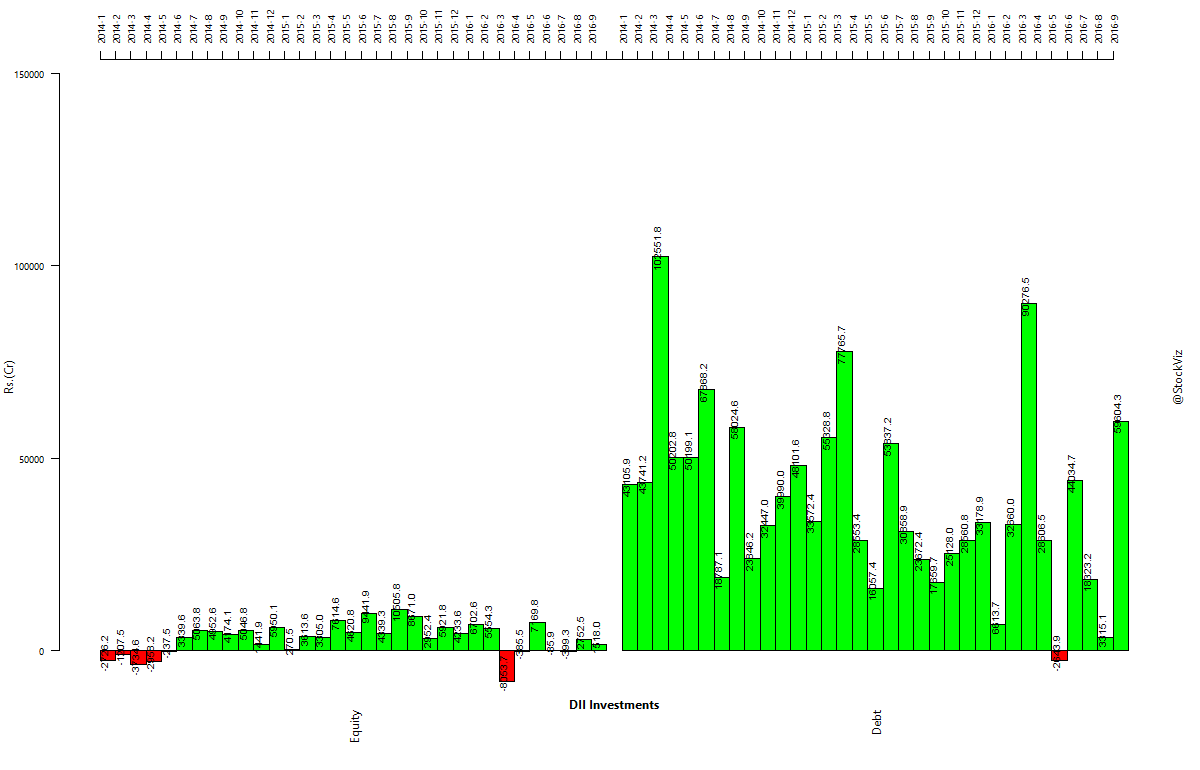
dii-investments-2014-01-01-2016-10-31

Books I read this month

Cable Cowboy: John Malone and the Rise of the Modern Cable Business (Amazon, Notes)

The book tells the (unfinished) story of John Malone of TCI and Liberty Media fame. How the cable TV business got started in America, how it ended up being one of the largest private sector investments in infrastructure, the regulatory angles, tax dodging, etc. Interesting read.

Business Adventures: Twelve Classic Tales from the World of Wall Street (Amazon, Notes)

This one feels like the author published his diary. It may have felt profound to him, but there is not much to go on. The first and last stories were interesting. However, the book lacked an internal consistency that would have helped the reader make any sense of the rambling.

All the Devils Are Here: The Hidden History of the Financial Crisis (Amazon)

The book paints an accurate picture of the subprime crisis that brought down the world’s financial system. How it began, the main actors… basically the people behind the systemic crisis and its evolution. Interesting read for those who are still wondering about how it all happened.

Monthly Recap: September Surgery

world-2016-08-31-2016-09-30

Equities

Major
DAX(DEU) -0.77%
CAC(FRA) +0.23%
UKX(GBR) +1.74%
NKY(JPN) -2.59%
SPX(USA) -0.01%
MINTs
JCI(IDN) -0.40%
INMEX(MEX) -1.01%
NGSEINDX(NGA) +2.67%
XU030(TUR) +0.51%
BRICS
IBOV(BRA) +0.78%
SHCOMP(CHN) -2.62%
NIFTY(IND) -1.99%
INDEXCF(RUS) +0.33%
TOP40(ZAF) -1.81%

Commodities

Energy
Brent Crude Oil +6.74%
Ethanol +9.76%
WTI Crude Oil +7.49%
Heating Oil +8.72%
Natural Gas +0.73%
RBOB Gasoline +5.02%
Metals
Copper +6.28%
Gold 100oz +0.48%
Silver 5000oz +3.23%
Palladium +7.45%
Platinum -1.99%

Currencies

USDEUR:-0.71% USDJPY:-2.01%

MINTs
USDIDR(IDN) -1.72%
USDMXN(MEX) +2.88%
USDNGN(NGA) +0.24%
USDTRY(TUR) +1.43%
BRICS
USDBRL(BRA) +0.90%
USDCNY(CHN) -0.11%
USDINR(IND) -0.53%
USDRUB(RUS) -3.74%
USDZAR(ZAF) -6.46%
Agricultural
Cattle -11.66%
Coffee (Arabica) +4.31%
Corn +11.53%
Cotton +3.42%
Orange Juice +12.02%
Coffee (Robusta) +11.36%
Feeder Cattle -12.32%
Lean Hogs -21.49%
Lumber +7.60%
Soybean Meal -4.46%
Soybeans -0.52%
Sugar #11 +13.72%
Wheat +10.82%
Cocoa -5.72%
White Sugar +12.46%

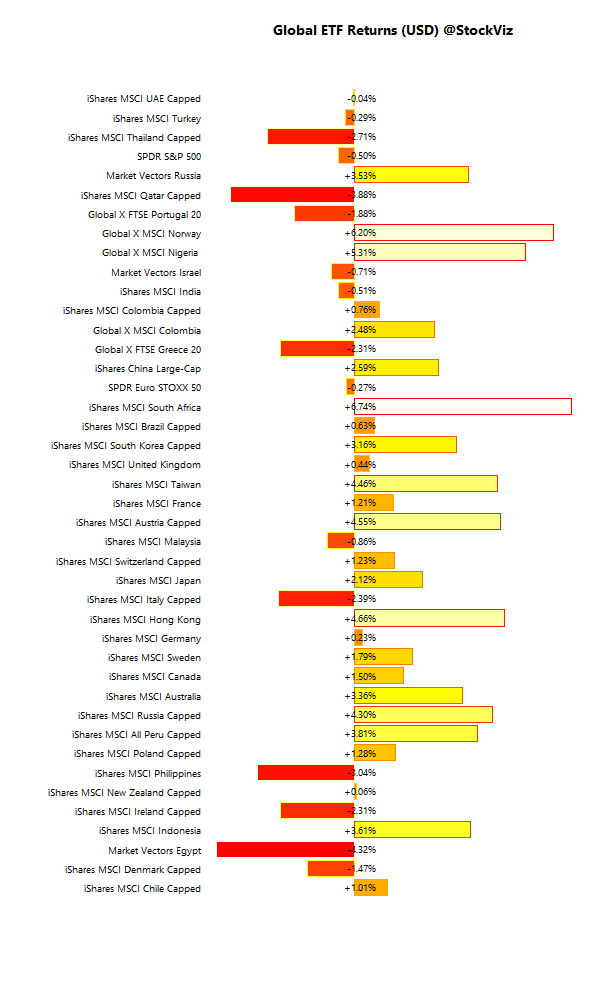
International ETFs (USD)

global-etf-performance-2016-08-31-2016-09-30

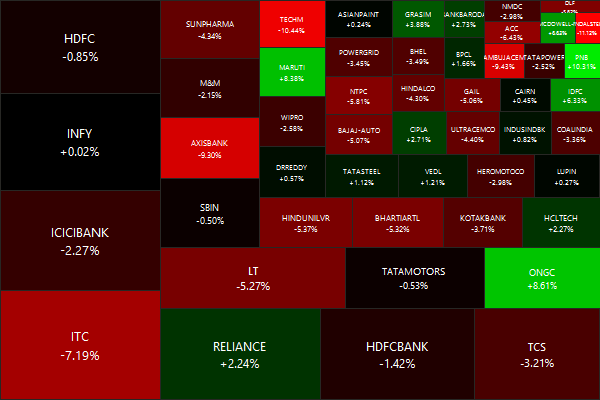
Nifty Heatmap

nifty-50-2016-08-31-2016-09-30

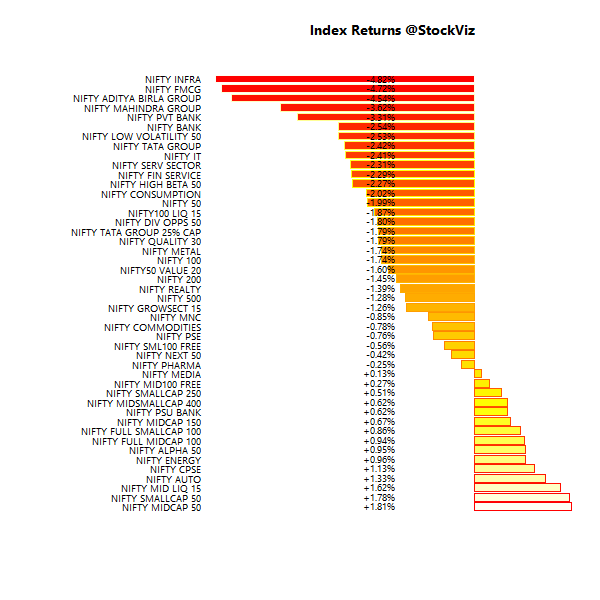
Index Returns

index-performance-2016-08-31-2016-09-30
More: Sector Dashboard

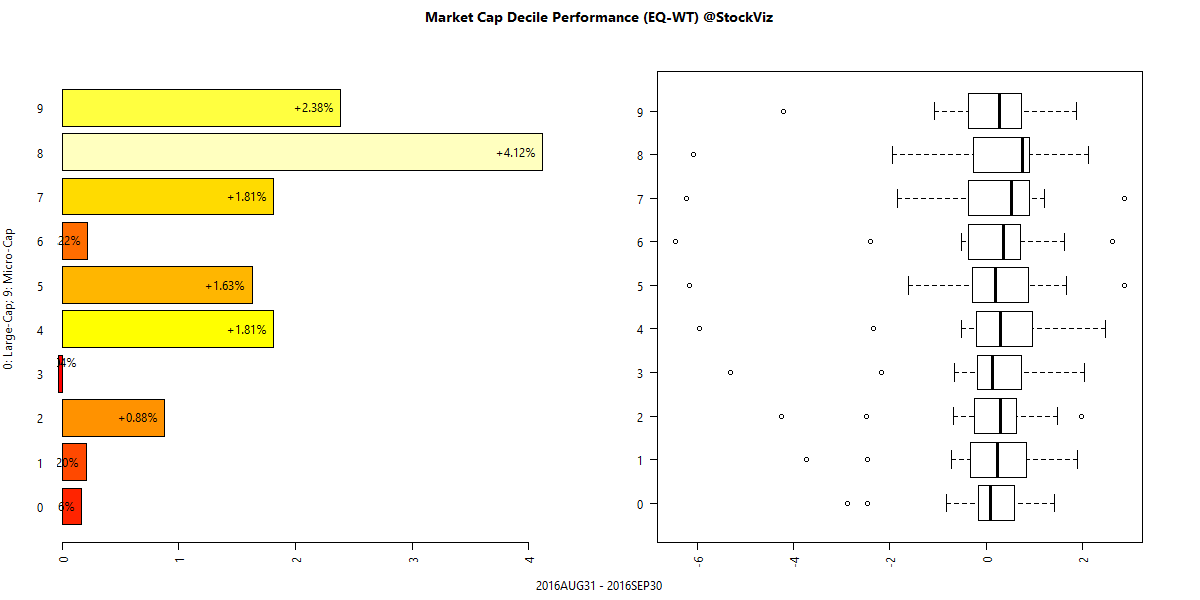
Market Cap Decile Performance

deciles-perf-2016-09-30
More: Equal-Weight Deciles, Cap-Weight Deciles

ETF Performance

CPSEETF +1.36%
PSUBNKBEES +0.79%
GOLDBEES +0.47%
JUNIORBEES -0.35%
BANKBEES -1.96%
NIFTYBEES -1.96%
INFRABEES -5.41%
PSU Banks… because all is well!

Yield Curve

yieldcurve-2016-08-31-2016-09-30

Bond Indices

Sub Index Change in YTM Total Return(%)
0 5 -0.17 +1.01%
5 10 -0.14 +1.30%
10 15 -0.11 +1.35%
15 20 -0.09 +1.44%
20 30 -0.06 +1.22%
Bonds FTW!!!

Investment Theme Performance

Our full automated Momentum strategies (Momos) seem to be out performing their artisanal peers!

Equity Mutual Funds

Bond Mutual Funds

Institutional fund flows

FII’s continue to binge on Indian equities. When will the tide turn?

fii-investments-2014-01-01-2016-09-30

dii-investments-2014-01-01-2016-09-30

Book I read this month

The Most Important Thing – Uncommon Sense for the Thoughtful Investor by Howard Marks (Amazon)

Flamboyant and charismatic investors often get more press than the introverted ones. Howard Marks is one of those under-appreciated value investors who’s work we would do well to assimilate. I have been a fan of his “memos” for the longest time. The book adds historical context to his memos and provides a peek into his thought process. If you see some of Marks’ videos, he comes across as a droning, bitter, professor who keeps telling you that you are not smart enough to make it as a professional investor. If you can get past that vibe, there is a wealth of information you can tap into.

My notes on the book are on OneNote.

Total Returns

Price vs. Total Return indices

Investors often use the NIFTY 50 index as a benchmark while comparing investments. It is probably fair if you are making price comparisons. However, investment vehicles like mutual funds reinvest the dividends that they get on their holdings. So a more appropriate benchmark there is the NIFTY Total Return (NIFTY 50 TR) index.

The NIFTY 50 TR index is an index with the same constituents as the NIFTY 50 but with dividends reinvested back into the index.

total returns index equation

The Dividend Impact on Returns

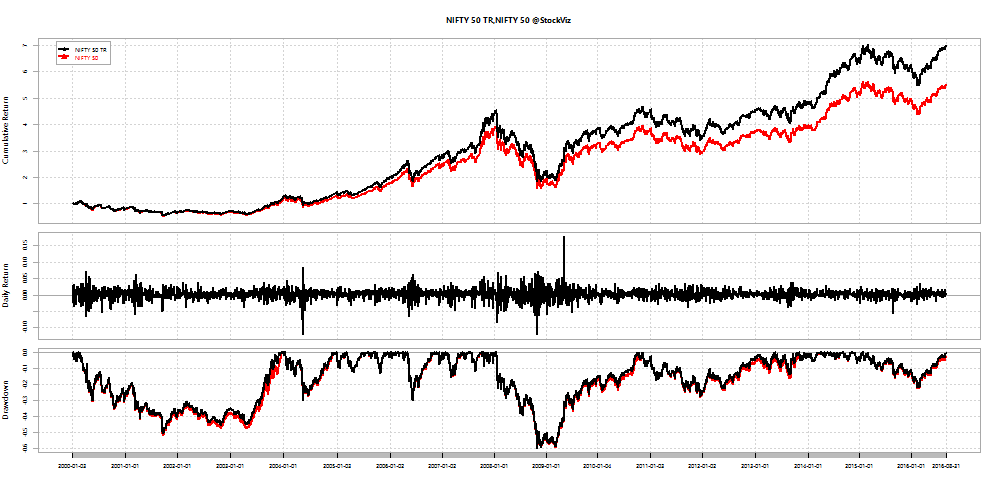
To give you an idea of how dividends impact long-term returns, here’s a cumulative wealth chart of the NIFTY 50 TR Index vs. the Nifty 50 (Price) Index:

nifty-tr-returns

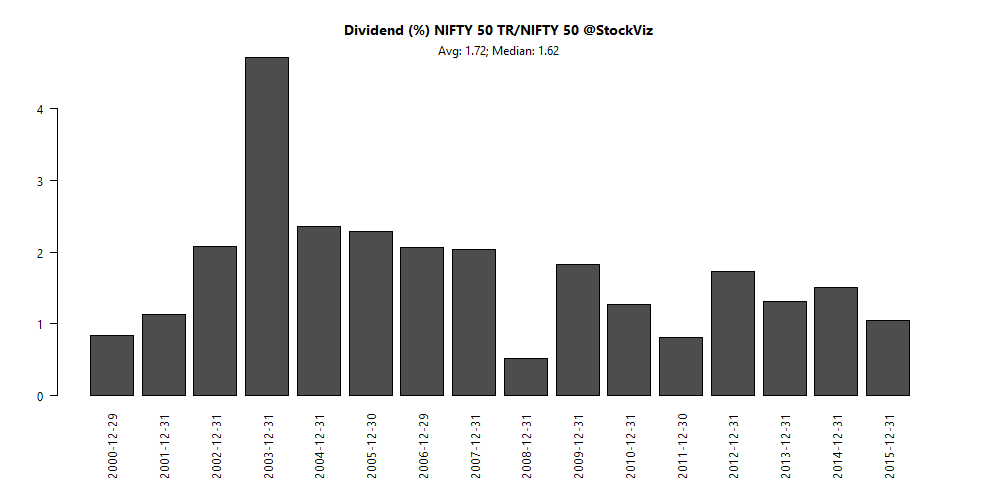
From the beginning of the year 2000 through to the end of August-2016, the Total Return was roughly 6x while the Price return was 4.5x. Here is how dividend reinvestment has boosted returns through the years:

nifty-dividend-returns

A 1.6% dividend boost sounds trivial until you look at the cumulative effect of it over the years.

Should benchmarks be handicapped?

When you see mutual fund returns compared with “price” indices (all NIFTY indices are price indices unless they are explicitly mentioned to be total return,) you should handicap those returns by ~1.5-2% every year to get an idea of whether the fund actually outperformed the index.

It is tragic that the NSE has maintained a total return index only for the NIFTY 50. With the rising popularity of other asset classes and strategies, it makes sense to provide a Total Return index for every Price index that they publish. We briefly touched upon this while we looked at the MNC asset class. The NIFTY MNC Index, being a price index, missed a lot of performance information. We had to compare an MNC Fund to another Midcap Fund to get a better idea of relative performance. (Read the whole thing here: The MNC Fund Gravy Train, Part II)

Code for the above charts are on Github

Intraday Momentum

The Research

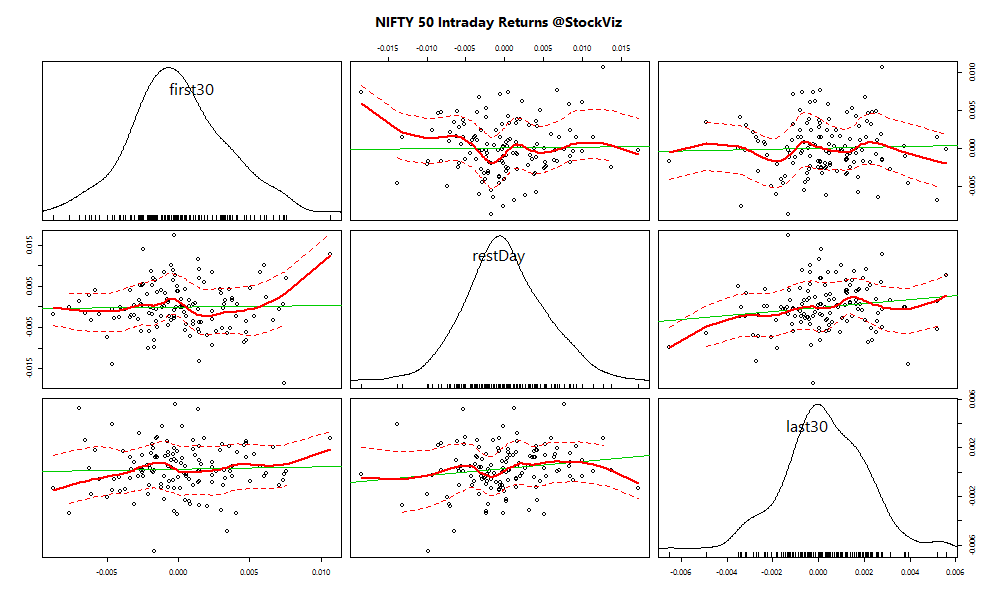
In their paper, Intraday Momentum: The First Half-Hour Return Predicts the Last Half-Hour Return (pdf,) the authors assert that the first half-hour return on the market predicts the last half-hour return on the market.

Our take

It seems to apply only to the selection of ETFs contained in their research. We ran a sniff-test on our very own NIFTY 50 index. If there was any correlation between the first half-hour and the last half-hour, it should have shown up in the top-right plot:

nifty50-intraday

We admit that our sample size is small. We will continue to accumulate data and run this script a year from now to see if any relationship emerges from the data. Stay tuned!

The MNC Fund Gravy Train, Part II

We had discussed how MNCs listed in India have outperformed pretty much every benchmark (here, here.) However, there are are a few dark-spots in an otherwise solid long-term investment thesis that are worth discussing.

The benchmark

The NIFTY MNC benchmark index had two drawbacks:

  1. It is based on free-float market cap and the float keeps shrinking because of buy-backs.
  2. It does not include dividends which are a huge component of returns in this asset class.

For example, Unilever bought back more than $5 billion of HUL’s float [stockquote]HINDUNILVR[/stockquote] in 2013; OFSS [stockquote]OFSS[/stockquote] payed out Rs. 485 per share as dividend on September 2014. The stock was trading around Rs. 3960 at that time – a yield of ~12.25% that is not captured by the index.

If you compare just the NIFTY MNC index to other NIFTY indices, it doesn’t look so good:

MNC.returns

Annual returns:
mnc returns

As you can see, all though the MIDCAP index is volatile, it offers returns an order of magnitude greater than the MNC index.

However, this is the index that we are talking about.

MNC Funds vs. Midcap Funds

For a true apples-to-apples comparison between MNCs and Midcaps, we should look at the funds that reference them. This takes care of the dividend reinvestment and vanishing float problems of MNCs. But creates another problem of having to adjust for alpha, but we will ignore that for now.

Let’s compare the BSL MNC fund vs. BSL Midcap Fund:

MNC.vs.MIDCAP.fund.returns

On a cumulative basis, the MNC fund as beaten their Midcap fund… with shallower drawdowns to boot:

MNC.vs.MIDCAP.fund.drawdown.p2p

Given the past performance of the MNC asset class, we had recommended BSL’s and UTI’s MNC funds to investors. However, we had not considered a googly being bowled by the parent companies.

Key Risk

The biggest risk with MNCs is not quantitative but qualitative. Their parent companies do not want the hassle of going through listed India subsidiaries. It is easier to invest in new projects and expatriate profits if they did so through a wholly owned subsidiary rather than a listed one. Key examples:

  1. Suzuki directly set up a factory in Gujarat and Maruti will “buy” cars from the new plant (IiAS.) [stockquote]MARUTI[/stockquote]
  2. Cummins “rationalized” their manufacturing facilities (IiAS.) [stockquote]CUMMINSIND[/stockquote]
  3. In FY15, 32 MNCs paid out an aggregate Rs. 63 bn, which was almost 21% of their pre-royalty pre-tax profits (IiAS.)

It looks like minority shareholders are getting shafted by the parent. The listed companies are being ‘hollowed out’ and turned into mere marketing outfits that command a significantly lower valuation in the markets.

If you are an investor in MNCs as a distinct asset class, it is time to work these risks into your future return expectations.

The R source code for this analysis and charts can be found on GitHub.